A high-order numerical method for sediment transport problems simulation and its comparison with laboratory experiments
Funding information: Generalitat Valenciana, AICO/2019/039
Abstract
This article describes a high-order well-balanced central finite volume scheme for solving the coupled Exner−shallow water equations in one dimensional channels with rectangular section and variable width. Such numerical method may solve the proposed bedload sediment transport problem without the need to diagonalize the Jacobian matrix of flow. The numerical scheme uses a Runge–Kutta method with a fourth-order continuous natural extension for time discretization. The source term approximation is designed to verify the exact conservation property. Comparison of the numerical results for two accuracy tests have proved the stability and accuracy of the scheme. The results of the laboratory tests have also been used to calibrate different expressions of the solid transport discharge in the computer code. Two experimental tests have been carried out to study the erosive phenomenon and the consequent sediment transport: one test consisting of a triangular dune, and other caused by the effect of channel contraction.
1 Introduction
In this work, a well-balanced central finite volume scheme is presented, which is fourth order accurate in time and space, for solving the coupled shallow water equations (SWEs)-Exner equation system in one-dimensional channels with rectangular section and variable width. Sediment transport processes are caused by gravity effects and by friction effects with the air or the fluid containing the sediment. In this article, we focus the study on bedload sediment transport, defined as the type of transport where sediment grains roll or slide along the bed. To model the bedload sediment transport phenomenon caused by the movement of a fluid in contact with the bed sediment, we consider a coupled model constituted by a hydrodynamical component and a morphodynamical component. The hydrodynamical component is given by the SWEs,1 used to study fluid movement in rivers, channels, and so on. A sediment transport equation, depending on the bedload transport rate, is considered to model the morphodynamical component. It is necessary to develop efficient numerical methods to solve this problem accurately.
The need for high accuracy computational schemes has driven the development of numerical schemes for higher-order spatial accuracy. There have been fourth-order accurate numerical methods for certain fluid flows and the convergence analysis has been establish for the incompressible Boussinesq equations.2 Numerical methods for higher-order spatial accuracy also include weighted essentially non-oscillatory (WENO) schemes, discontinuous Galerkin (DG) schemes and PNPM schemes (see for instance a recent review in Reference 3). On the other hand, the most popular numerical methods for higher-order temporal accuracy are the the Runge–Kutta methods and the ADER (Arbitrary DERivative in space and time) methods.4 The Runge–Kutta discretization of a time-dependent ordinary differential equations splits the time evolution into a sequence of stages, each of which is only first order in time. The implementation of these methods is simple because each stage is practically identical to the previous stage. ADER schemes are computationally less expensive because the reconstruction is done only once.
Caleffi et al.5 presented a well-balanced central WENO scheme, fourth-order accurate in space and in time, for numerical integration of 1D SWEs over movable bed. That method combines a great versatility, due to the use of the central approach, with the main advantages of the WENO schemes to achieve fourth-order formal accuracy in smooth regions while maintaining stable, to keep non-oscillatory property near strong discontinuity.6 Even though a high order WENO schemes may use more CPU time than a second order scheme, it may still be advantageous for many application problems because of its high accuracy.7 Balaguer and Conde8 described a new fourth-order nonoscillatory reconstruction procedure for central schemes that satisfies shape preserving and number of extrema decreasing properties. That scheme can be an interesting computational alternative to fourth-order WENO schemes in terms of efficiency and stability. In this article, we will use central schemes with this type of spatial reconstruction.
This article uses a central scheme to solve the proposed sediment transport problem without the need to diagonalize the Jacobian matrix of flow. This property has facilitated its application in problems by incorporating new physical parameters to the model. The numerical scheme uses a Runge–Kutta method with a fourth-order continuous natural extension for time discretization. A Gaussian quadrature rule with two integration nodes is used to evaluate the time integrals. The reconstruction operator, which calculates point values from average values, is based on a third degree polynomial that avoids increasing the number of extreme points of the solution inside each cell. Such polynomial also guarantees that the total number of local maxima and minima does not exceed the initial number of extremes and therefore prevents the development of spurious numerical oscillations. The source term approximation has been designed to verify the exact conservation property. This numerical scheme has been applied in previous works by the authors9, 10 to solve accurately other kind of problems. This article presents its extension to solve bedload sediment transport problems in channels with a rectangular section and variable width, adding new terms of friction.
Some experimental tests in the laboratory of the Institute of Water and Environmental Engineering of the Polytechnic University of Valencia have been carried out in this article to study the erosive phenomenon, and the consequent sediment transport. The first test case consists of a triangular dune, and the second is selected to analyze the effects of flow contraction and expansion, due to the existence of inserted structures such as bridges. Comparison of the numerical results for some accuracy tests have demonstrated the stability and accuracy of the numerical scheme and the results of the laboratory tests have been used to calibrate different expressions of the solid transport discharge in the computer code, computing the best threshold value. The numerical results showed a good agreement with the measured experimental data.
2 The sediment transport system
2.1 Formulation for the bedload sediment transport rate
2.2 Algebraic manipulation of the sediment transport system
In the next sections, we extend the methodology presented by Capilla and Balaguer in Reference 9 to develop a high-order well-balanced numerical scheme that solves the system (12). This extension incorporates to the numerical model the new source term, s(x, u(x, t)), that includes the width of the channel and the friction term.
3 Numerical Scheme
The computational domain [0, L] is divided into N equally spaced nodes xj, then the spatial step is defined. We consider five additional nodes on the left of x = 0, and also on the right of x = L, to avoid loss of accuracy in the domain boundaries and therefore we have the points . Then the nodes are considered.
The ideas described in previous works9, 23 are extended for developing the numerical scheme of this article, considering the source term s, which also includes the channel width s2, and the friction term s3. As we will describe, the numerical algorithm takes into account the reconstruction, at time tn, of averages and point-values , and the reconstruction of Runge–Kutta fluxes, . Time integration will be developed by means of a Runge–Kutta scheme coupled with a natural continuous extension (NCE).21
In the next subsections, we describe the steps of the numerical algorithm, needed to obtain the solution (15) in a single time step.
3.1 Reconstruction, at time tn, of point-values and averaged values
- is monotonically increasing in Ij if .
- is monotonically decreasing in Ij if .
- has a maximum in Ij if and only if .
- has a minimum in Ij if and only if .
Moreover, the parameter in (19) has been defined to preserve the stability and the non-oscillatory behavior of the numerical scheme. In this way, our central approximation give rise to monotone scheme that it avoids spurious oscillations in the solution using a fixed-central stencil. For more details, see References 8 and 9. To maintain the positivity of the numerical scheme, we should add additional requirements to the definition, similar to those described by Liu and Osher24 to satisfy the local maximum principle. This would allow a better treatment of wet/dry fronts.
In Reference 9, a test with a dry bed generation was solved in a fixed bed suggesting that the water depth may be negative if that local maximum principle condition has not been taken into account. We could also change the definition of using the positivity-preserving limiter introduced by Xing et al.25 or Xing and Shu.26 In fact, there have been many scientific computing articles that have theoretically addressed the positivity property for certain physical variables, such as local Lax-Friedrichs type positivity-preserving flux for compressible Navier-Stokes equations,27 positivity-preserving schemes of density and pressure in ideal magnetohydrodynamics and positivity and bound-preserving limiters for the compressible Euler equations.28
3.2 Time integration: Runge–Kutta scheme
3.2.1 Reconstruction of the Runge–Kutta fluxes
Using the interpolating polynomial of degree three defined in Reference 9, the evaluation of the Runge–Kutta fluxes is performed. Furthermore, in the case of a flow at rest, with q = 0 and , then and this ensures that the scheme is well balanced.
3.3 Source term integration
The integrals of the source terms relative to the width channel, , and the friction source term are evaluated using the procedure shown in (26).
4 Applications
In this section, the numerical method described previously is calibrated by means of different test cases. First, in order to prove the global order of accuracy of our method, we present in Section 4.1 two accuracy tests. In Sections 4.2 and 4.3, we describe laboratory scale experiments where we simulate sediment evolution and the numerical solution is compared with the experimental data obtained by the Institute of Water and Environmental Engineering of the Polytechnic University of Valencia. These experiments were carried out in a sand bed open channel, and they will be described in the following paragraphs.
Numerical results for these test experiments were obtained with transport equations described in Section 2.1. Different values for critical shear stress are also considered in the simulations.
4.1 Test 1: Accuracy tests
First, in the Exner equation, we considered that qb(h, q) = 0 and . It can be seen that despite the absence of sediment transport, our scheme interpolates bed elevation values on a staggered grid. Table 1 shows errors in the L1 and L∞ norms together with the numerical orders of accuracy, computed considering different number of cells. Final time of computation was equal to T = 0.1 s, when the solution is still smooth because shocks developed later in time for this problem. We can see that fourth order accuracy is achieved for this example for the free surface elevation and the specific discharge. Figure 1 shows L1 errors given in Table 1 versus CPU times, in a log-log scale. The points of this figure fit a straight line.
| , free surface elevation | q, specific discharge | |||||||
|---|---|---|---|---|---|---|---|---|
| Cells | L1 | Order | L∞ | Order | L1 | Order | L∞ | Order |
| 100 | 8.99E-04 | 1.14E-02 | 7.64E-03 | 9.11E-02 | ||||
| 200 | 7.33E-05 | 3.62 | 1.23E-03 | 3.20 | 6.15E-04 | 3.63 | 1.02E-02 | 3.16 |
| 400 | 3.95E-06 | 4.21 | 9.22E-05 | 3.74 | 3.22E-05 | 4.26 | 7.82E-04 | 3.71 |
| 800 | 1.77E-07 | 4.47 | 5.93E-06 | 3.96 | 1.35E-06 | 4.58 | 5.15E-05 | 3.93 |
| 1600 | 8.74E-09 | 4.34 | 2.62E-07 | 4.50 | 6.97E-08 | 4.27 | 2.22E-06 | 4.54 |

Second, we considered the bed load transport problem assuming that and as in.5 Errors in the L1 and L∞ norms and the numerical orders of accuracy are presented in Table 2. Shape-preserving conditions imposed to define may cause that the numerical scheme is not of order O(▵ x)4 in a small number of cells, so the experimental order of accuracy may be about 3 as we can see in Table 2.
| , free surface elevation | q, specific discharge | |||||||
|---|---|---|---|---|---|---|---|---|
| Cells | L1 | Order | L∞ | Order | L1 | Order | L∞ | Order |
| 200 | 2.96E-04 | 8.21E-03 | 2.49E-03 | 6.91E-02 | ||||
| 400 | 2.65E-05 | 3.48 | 1.15E-03 | 2.84 | 2.22E-04 | 3.49 | 9.69E-03 | 2.83 |
| 800 | 1.40E-06 | 4.25 | 9.53E-05 | 3.59 | 1.19E-05 | 4.23 | 8.08E-04 | 3.58 |
| 1600 | 5.94E-08 | 4.56 | 6.41E-06 | 3.89 | 5.17E-07 | 4.52 | 5.44E-05 | 3.89 |
4.2 Test 2: Triangular dune
In the first case, we apply the numerical model presented to an experiment that consists of a triangular dune. The experimental test was developed introducing a sand layer in the laboratory channel, as it is shown in the sketch of the experiment with dimensions in Figure 2. The dune is 0.15 m long and 0.02 m high, and it starts at x = 0.10 m and ends at x = 0.25 m. The peak is located at x = 0.215 m. The width of the channel is not modified at any point, being 0.064 m in the entire section. For the numerical computations, we consider the one-dimensional domain of 0.6 m length discretized in 360 mesh points.
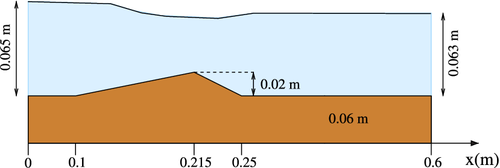
Boundary conditions for this problem are: q(0, t) = (8.75 · 10−4/0.064) m2/s for the water discharge and h(0.6, t) = 0.063 m for the fixed downstream water depth. The following initial conditions are also considered: h(x, 0) = 0.063 m ∀x ∈ [0, 0.6] and q(x, 0) = (8.75 · 10−4/0.064) m2/s ∀x ∈ [0, 0.6]. Remember that B(x) = 0.064 m ∀x. The experimental value, h(0, t) upstream, has been around 0.065 m although it will only be used for comparison.
4.2.1 Numerical-experimental comparative for Test 2
4.2.1.1 Water surface profile
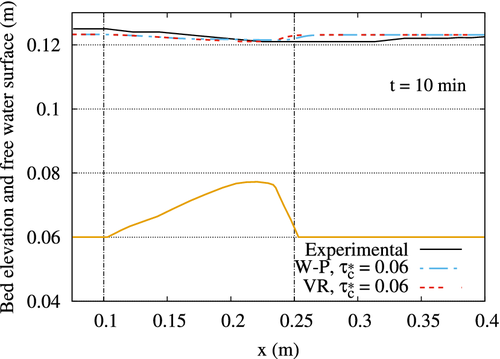
Figure 3 shows numerical and experimental results for the free water surface at t = 10 min in the range 0.07 m ≤ x ≤ 0.4 m. Numerical solutions were obtained with Wong and Parker and Van Rijn models (see Equations (6) and (7)) considering ; this value for has been chosen since the bed elevation obtained with it is closer to the experimental results as will be analyzed later in Figures 4 and 5. The value of the critical shear stress using formula (9) is equal to 0.0311. Figure 3 also shows the experimental result for the sand bed profile at this time step in the same range. The vertical dashed lines represent where the dune starts and ends at the initial time t = 0 s. Numerical water surfaces represented in Figure 3 show that the model is able to simulate the drop in the water level that occurs when the bed level rises, under subcritical flow conditions. This same drop is observed in the experimental results, although it occurs slightly downstream.


4.2.1.2 Sand bed profile
Figures 4 and 5 show the computed profile of the dune at two time steps, t = 5 min and t = 10 min, together with the experimental data for this test. These figures show numerical results obtained with the different formulations described in Section 2.1 for the bedload sediment transport rate. Classical Meyer-Peter and Müller formulation (MPM, Equation (5)) with produces excessive erosion. The same occurs with Wong and Parker (W-P) method with , which is the value of the dimensionless shear stress according to Shields diagram for the hydraulic conditions of the test. The results improve with this same method by increasing to , which is the maximum value that is usually recommended. The Einstein-Brown (E-B, Equation (10)) solution is similar to that of Wong and Parker (W-P) with . Finally, Van Rijn's formulation (VR) using produces results closer to the experimental results. This value for is much higher than that defined using formula (9), which would give a value equal to 0.0311.
4.3 Test 3: Channel with variable width
This case is selected from a set of experiments presented by Nácher-Rodríguez et al. in Reference 23, to be simulated with the numerical model. Cross section of the channel is rectangular, with a variable width. The sand used to represent the river bed has a very uniform grain size distribution. The sketch and parameters for this experiment can be seen in Figure 6. Channel length is 0.9 m with abutment plates of width 0.013 m located in the center.
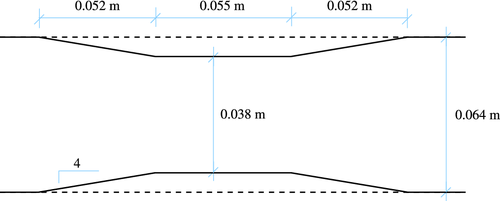
For the numerical computations, we consider the one-dimensional domain of 0.9 m length discretized in 540 mesh points. During the test experiment, a set of photographs were made in order to analyze the profile. To extract data from pictures, two moving vertical scales were located against channel walls. Experimental results from this test comprise water surface and sand bed profiles at different time steps.
The test was carried out for a longer period of time, but after 90 min (1.5 h), we observed that the erosive part of the bed profile did not change significantly. Two different values for critical shear stress are considered in this simulation, these values are and . As in Test 2, first value corresponds to dimensionless shear stress according to Shields diagram for the hydraulic conditions of the test. Second value was fixed in order to achieve a better agreement between numerical and experimental results.
4.3.1 Numerical-experimental comparative for Test 3
4.3.1.1 Water surface profile
Figure 7 shows computed versus experimental free water surface at t = 90 min with W-P and VR models, considering . With the rest of the formulations presented in Section 2.1, the changes in the free water surface are minimal and therefore, as an example, this figure presents results with the two methods that are subsequently deeply analyzed. Figure 7 also shows the experimental sand bed profile at t = 90 min along the maximum depth location; it can be seen that maximum erosion takes place close to the abutments. Vertical dashed lines represent where abutments start and where they end, and also the transitions.
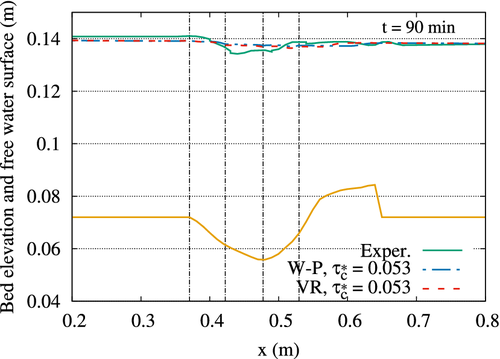
We observe from that figure that there is reasonable agreement between numerical and experimental water surfaces, despite the minor oscillations located between the abutments. These fluctuations in experimental profile located in the contracted flow area are not obtained with the numerical model.
4.3.1.2 Sand bed profiles
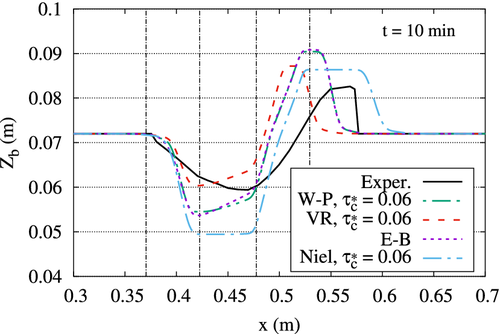
Figure 8 shows the sand bed results at time t = 10 min; in this figure different transport methods are compared with each other and with the experimental data. The transport methods used in this figure are Wong and Parker, Van Rijn, Einstein-Brown and Nielsen, with . We have observed that the results of this same comparison at time t = 30 min are very similar. In this Test, W-P and E-B methods give very similar results; in the erosion zone the W-P method is closer to the experimental result, since the maximum depth is less and therefore more similar to the experiment. From the results obtained for this Test case with the different transport models, we have selected the W-P and VR methods to carry out a more in-depth analysis, as will be shown in the following.
In Figure 9, a comparison between numerical and experimental sand bed profiles is shown for several time steps (10, 30, 60, and 90 min). Left column in the figure shows results obtained with the W-P transport equation, and right column corresponds to VR transport equation. Results of both transport models are presented for two different values for critical shear stress ( and ). It can be seen that both transport models give an erosion/deposition profile qualitatively similar to the experimental profile. Erosion is located between the abutments, and deposition starts at downstream transition. Wong and Parker formula tends to overestimate maximum scour depth, whereas Van Rijn's equation provides smaller values, more consistent with those from the experiment.
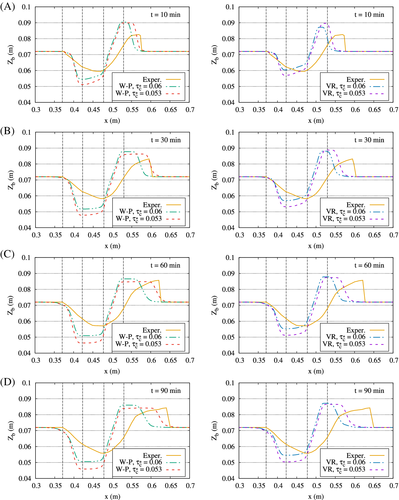
The deposition starts before in the numerical model than in the lab test. At early time steps, both numerical models overestimate maximum height of deposition, but numerical and experimental tend to reach the same value after approximately 60 min. The numerical model described in this research is 1D, and it gives good results when compared to the experiment, where the flow has one main direction, which is the longitudinal one. However, the laboratory flume has a certain width (which is small, in comparison to its length) and the erosive process that takes place is intrinsically 3D, as downward and lateral flows appear as the erosion hole starts to develop. In this case, erosion is mainly caused by the increase in the longitudinal velocity of the flow due to a local narrowing of the channel, and that is why a 1D model is able to simulate the location of the scour hole and its maximum depth. However, there are other processes taking place due to the actual 3D nature of the flow, and while they are not so relevant, they play a role in the final configuration of the sand bed profile. The numerical model cannot represent that effect. Therefore, differences between the experimental and computed bed profile are to be expected.
Table 3 displays the values of the maximum scour depth and its location at different time steps; the table compares the data of the experiment with the numerical results obtained with Wong and Parker and Van Rijn's models and considering two different values for critical shear stress. The relative errors for the values obtained for maximum depth and its location, with respect to the experimental data, are tabulated in Table 4. We can see from these tables that solutions using Van Rijn's model with the higher Shields parameter , differ from experimental result by a 10%, which is acceptable taking into account the model limitations.
| t = 10 min | t = 30 min | t = 60 min | t = 90 min | ||||||
|---|---|---|---|---|---|---|---|---|---|
| Scour depth | X | Scour depth | X | Scour depth | X | Scour depth | X | ||
| Experimental | 0.0126 | 0.469 | 0.0137 | 0.474 | 0.0149 | 0.475 | 0.0162 | 0.479 | |
| Numerical | |||||||||
| W-P | 0.053 | 0.0208 | 0.421 | 0.0241 | 0.419 | 0.0257 | 0.431 | 0.0261 | 0.441 |
| 0.06 | 0.0175 | 0.421 | 0.0202 | 0.416 | 0.0211 | 0.444 | 0.0215 | 0.438 | |
| VR | 0.053 | 0.0150 | 0.418 | 0.0188 | 0.428 | 0.0208 | 0.431 | 0.0216 | 0.436 |
| 0.06 | 0.0116 | 0.418 | 0.0149 | 0.423 | 0.0167 | 0.433 | 0.0174 | 0.434 | |
- Note: Length units are in meters.
| t = 10 min | t = 30 min | t = 60 min | t = 90 min | ||||||
|---|---|---|---|---|---|---|---|---|---|
| Model | Scour depth | X | Scour depth | X | Scour depth | X | Scour depth | X | |
| W-P | 0.053 | 65.1 | −10.3 | 75.9 | −11.5 | 72.5 | −9.2 | 61.1 | −8.1 |
| 0.06 | 38.9 | −10.3 | 47.4 | −12.1 | 41.6 | −6.4 | 32.7 | −8.7 | |
| VR | 0.053 | 19.0 | −11.0 | 37.2 | −9.6 | 39.6 | −9.2 | 33.3 | −9.1 |
| 0.06 | −7.9 | −11.0 | 8.8 | −10.8 | 12.1 | −8.8 | 7.4 | −9.5 | |
5 Conclusions and Future Work
5.1 Conclusions
After analyzing the experimental results and the numerical comparison, we establish the conclusions of this work. We have presented a fourth order accurate central scheme that solves the 1D coupled SW–Exner Equation system in a rectangular channel with variable width. The treatment for the source term spatial integration preserves the time and space accuracy and has been designed to obtain a well-balanced finite volume scheme. This central numerical scheme has been tested in previous works by the authors with other kind of problems, and now the method is extended to the incorporation of the variable width and the friction term. The method is capable of achieving great accuracy without using a very fine mesh. Its non-oscillatory behavior prevents the presence of new outliers in the computed solutions. Also, the method allows to work with different models for the sediment transport rate and to incorporate new physical parameters in the model.
A comparative between experimental results and numerical model has been analyzed: an acceptable agreement under certain conditions was found. Figures 4, 5, 8, and 9 show significant differences between computed sand bed profiles with different critical shear stress values. The model is highly sensitive to this parameter, and therefore special attention is required to determine its value. Model calibration is crucial in sediment transport problems, and when experimental data is not available, sensitivity analysis should always be performed to assess the model's uncertainty.
In the two laboratory tests used in this work, it was necessary to choose a higher Shields parameter than that used in previous references in order to obtain results closer to the experimental ones, avoiding excessive erosion. In the second laboratory test, maximum scour locating was properly computed, and the model is able to simulate both erosion and deposition, but overestimates scour depths. Then, additional modifications have to be implemented, in order to accurately compute maximum scour depths with more representative parameters.
5.2 Future work
Transition from one to two-dimensional tests is necessary and it will provide a better representation of experimental tests. Also the incorporation in the model of a non-erodible fixed bed and the existence of bedforms, that may be the key to obtain smaller computed scour depths. Other factors have to be taken into account; for example, different bed materials and more complex structures or different angles of approach of the flow to the structure, which are factors that normally influence erosive processes.
ACKNOWLEDGEMENT
This work was supported by the Generalitat Valenciana under Project AICO/2019/039. The authors thank the anonymous reviewers for their comments and suggestions.
Biographies

María Teresa Capilla Romá completed her PhD in 2000 at the Faculty of Physics of the Universitat de València, Spain. She is currently an Assoc. Professor at the Department of Applied Mathematics of the Universitat Politècnica de València (UPV). She teaches multivariable calculus in engineering degrees. Her research interests include numerical methods for systems of differential equations, techniques of approximation, and techniques of numerical analysis.

Angel Balaguer-Beser completed his PhD in Mathematics sciences in 1996. He is currently an Assoc. Professor at the Department of Applied Mathematics and a member of the Geo-Environmental Cartography and Remote Sensing Group (http://cgat.webs.upv.es/) at the Universitat Politècnica de València in Spain. He teaches Mathematical Methods, Geostatistics and Multivariate Analysis in Geomatic. His research focuses on modeling of beach and fluvial systems using high-order interpolation methods.

Beatriz Nácher-Rodríguez completed her Civil Engineering Degree in 2011, and MSc Degree in Hydraulics Engineering and Environment in 2012. She has been collaborating as a researcher in the Hydraulic Engineering Laboratory at the Universitat Politècnica de València since 2010. Her research area is mainly focused in river engineering, sediment processes and river morphodynamics, but also in flood analysis and urban hydraulics.

Francisco J. Vallés Morán Assoc. Professor at the Hydraulic Engineering and Environment Department at UPV. MSc Civil Engineer and PhD in Hydraulic Engineering and Environment from UPV. He is a researcher in the Hydraulics and Hydrology area at the Research Institute of Water and Environmental Engineering (IIAMA) in the UPV and head of the Hydraulic Engineering Laboratory in the same university. He is also the head of the Group IIAMA-UPV in the Spanish Hydraulics Laboratory Network (RLHE). He is a specialist in hydraulic design and modeling—both mathematical and physical reduced.


