Enabling Quality of Service Provision in Omni-Path Switches
Funding information: European Commission (FEDER funds), RTI2018-098156-B-C52; Junta de Comunidades de Castilla-La Mancha, SBPLY/17/180501/000498; Ministerio de Ciencia e Innovación, BES-2016-078800; Universidad de Castilla-La Mancha, 2019-GRIN-27060
Abstract
The increasing demand of high-performance services has motivated the need of the 1 exaflop supercomputing performance. In systems providing such computing capacity, the interconnection network is likely the cornerstone due to the fact that it may become the bottleneck of the system degrading the performance of the entire system. In order to increase the network performance, several improvements have been introduced such as new architectures. Intel © Omni-Path architecture (OPA) is an example of the constant development of high-performance interconnection networks, which has not been largely studied because it is a recent technology and the lack of public available information. Another important aspect of all interconnect network technologies is the Quality of Service (QoS) support to applications. In this article, we present an OPA simulation model and some implementation details as well as our simulation tool OPASim. We also review the QoS mechanisms provided by the OPA architecture and present the table-based output scheduling algorithm simple bandwidth table.
1 INTRODUCTION
The expected growth in the demand for supercomputing services will require systems with a processing performance of 1 exaflop in a few years. Increasing the supercomputer performance can be achieved by: a) increasing the number of cores per node without increasing its individual performance; b) increasing the number of nodes without increasing the number of cores per node; c) combining both previous options.
The interconnection network is a key element in these systems because it may become a bottleneck, degrading the performance of the entire system. Interconnection network performance depends on several factors (e.g., topology, routing, and layout), which must be carefully studied by system designers.
One relevant improvement in high-performance switches is to increase the pin density. Designers face two possibilities: build switches with a high number of thin ports (high-radix switches) or build switches with a low number of fat ports (low-radix switches). In order to design a feasible high-radix switch, hierarchical crossbar switch architectures have been introduced. In References 1-5 the advantages of high-radix switches have been discussed. The main advantages of hierarchical architectures are: packet latency, overall system cost and power dissipated by the network are reduced, the network fault tolerance is increased and a distributed packet arbitration process may be applied. Some examples of current hierarchical switches technologies are: YARC,2 Omni-Path,6 and Slingshot's Rosetta switches.7 To build a low-radix switch, non-hierarchical switch architectures are used, for example, InfiniBand.8, 9
The Intel © Omni-Path architecture (Intel © OPA) represents a new product line aimed for high-performance interconnection networks. OPA is designed for the integration of fabric components with CPU and memory components to enable the low latency, high bandwidth and dense systems required for the exascale generation of datacenters and supercomputing centers.
The introduction of Intel © OPA architecture product line marks one of the most significant new interconnects for high-performance computing since the introduction of InfiniBand.8, 9 However, OPA has not been studied as much as other interconnection network technologies such as InfiniBand. One of the reasons why OPA has not been publicly studied may be the fact that is still a very new technology. Another possibility may be the lack of tools that allow the researchers to study OPA-based systems. OPA was initially developed by Intel until 2019, when all the OPA technology IP was transferred to Cornelis Networks, a new company that is continuing the support and development of OPA products.10, 11
In the context of high-performance interconnection networks, Quality of Service (QoS) provision has become a very active topic. Current datacenters provide a wide range of services such as file transfer, real-time applications,12 high-performance computing, cloud applications, big data, and so on. Host applications providing these services generate traffic between the nodes that make up the datacenter. Therefore, an high-performance interconnection network is needed. Applications have different requirements, for example, real-time applications have low bandwidth and low latency requirements. Hence, interconnection network technologies must provide mechanisms to enable QoS to applications. Given that, QoS has become the focus of much discussion and research during the last decades. A sign of this interest is the inclusion of support aimed to provide QoS on interconnection network such as Gigabit Ethernet, InfiniBand, and also OPA.
Simulation is the most common technique to analyze any interconnection network architecture in a flexible, cheap and reproducible way. Regarding OPA, as far as we know, there is not any tool, simulator or simulation model publicly available. This fact slows and, in some cases, hinders research tasks. In this article we present a simulation model and a discrete-event simulator based on the Intel © OPA architecture. We have based our work on all public documents about the architecture. However, some assumptions have been taken because some internal details remain unpublished and are not shared by Intel's staff.
The rest of this article is organized as follows: Section 2 gives an in depth overview of the simulation model that we have developed, and some internal details of the simulator implementation. The QoS mechanisms provided by the OPA architecture are reviewed in Section 3 as well as the simple bandwidth table output scheduler, while evaluation results are presented in Section 4. Finally, Section 5 shows the conclusions and future work.
2 OPA SIMULATOR DETAILS
We have developed a discrete-event network simulator that generates the movement of packets from source nodes to destination nodes using an OPA-based interconnection network. The main elements such as network interfaces, OPA switches and links, have been simulated. The tool is capable of modeling the behavior of OPA switches. Furthermore, the simulation tool offers the possibility of modifying a large range of parameters such as queue sizes, topology, routing, packet sizes, and so on.
The main goal is to obtain a simulation tool as flexible as possible, following the basic behavior of OPA, aimed at performing comparative studies. The tool is already capable of running simulations using a wide variety of synthetic traffic types such as uniform, bit-reversal, bit-complement, and so on, and MPI file-traced applications using the VEF framework.13 Performance and scalability of the network will be evaluated using several metrics: throughput, end-to-end latency, network latency, and so on.
As future work, we will evaluate different solutions for those OPA elements whose behavior is not publicly documented.
2.1 Simulation model
Our first step in the simulation tool development has been to define a design approach based on the public information available6, 14 and to design a specific simulation tool suitable for OPA. Specifically, we have developed OPASim, an event-driven, flexible, open-source, efficient, and fast simulation tool that models the specific details of the OPA switch with enough granularity and accuracy.
We assume that each link transmits one flit per cycle. Hence, the bandwidth is defined based on the needed number of clock cycles and the flit size. Figure 1 details the 48-port switch model that we have considered and implemented into the tool OPASim. For different number of ports the structure can be easily extrapolated.
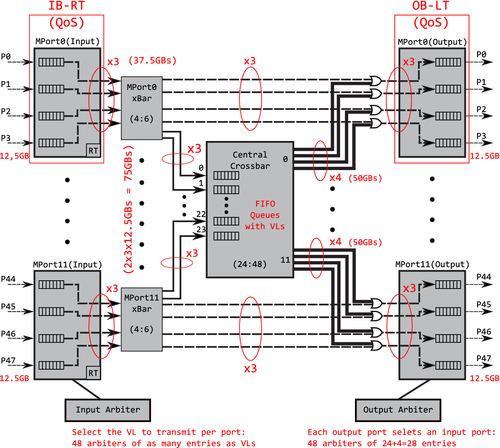
- Input buffers: They store the flits from the input ports. There is one input buffer per input port.
- Routing unit: There is one routing unit per input buffer.
- MPort Xbar: This crossbar has four input ports, one per input buffer; and six output ports: four ports to output buffers and two ports for the central crossbar. Note that the 75 GBps link to the central crossbar is represented in this model as two links. Each link presents a speed-up of x3 (it may deliver 3 flits/cycle) resulting on 2 Links × 3 × (12.5 Gbps) = 75 Gbps.
- Output buffers: They store the flits of the output ports. There is one output buffer per output port.
- Input arbiter: Given an input buffer, it selects the virtual line (VL) that participates in the next allocator phase. The more VLs, the bigger the arbiter is.
- Output arbiter: Given an output buffer, it chooses which input port is going to transmit flits. A flit can arrive at this output buffer coming from an input buffer or from the central crossbar.
- IB (input buffering): Each input buffer can receive 1 flit/cycle. The flit arrives at an input port and is stored in the corresponding queue, depending on the VL. If that flit is the packet header flit, it is set as RT-ready to call the routing unit which determines the flit output port. In other case, it is set as X-ready, and is stored on the input buffer waiting to be moved to the appropriate output or central crossbar buffer. This grant depends on if the destination port is in the same MPort or it needs to cross the central crossbar. If the destination of a given flit is not in the same MPort (because that destination is not directly connected to the MPort), then it will need to cross the central crossbar. For example, let us suppose that in an OPA switch with 48 ports and four ports per MPort (like the model depicted in Figure 1), a flit needs to travel from the input port 0 to the output port 5. The input port is on the MPort 0 (which contains input ports from 0 to 3) and the output port is on the MPort 1 (which contains output ports from 4 to 7), hence, the flit must cross the central crossbar in order to achieve MPort 1.
- RT (RouTing): If the header flit of the packet is tagged as RT-ready, the event performs the routing function, that is, it determines the output port to reach the packet destination node. After that, the header flit is tagged as VA-SA-ready and the input buffer, which stores this flit, is eligible for the VA-SA stage. Note that this event is only applied to header flits, nonheader flits always follow the header flit path through the switch. The routing function is configurable by the user and must be according to the configured topology.
- VA-SA (virtual allocator and switch allocator): A two-stage allocator is considered:
- -
Virtual allocator: Each input arbiter, with at least one VA-SA-ready header flit on it, chooses a VL that will be allowed to deliver a packet. In our first approach, the input arbiter is a round-robin arbiter. However, we are developing more sophisticated arbiters able to provide applications with Quality of Service (QoS). Note that, because the central crossbar ports have VLs as well, this allocator stage is also performed on the input ports of the central crossbar.
- -
Switch allocator: Each output arbiter chooses an input buffer with a VL assigned from the previous stage. The selected input buffers will be allowed to move a packet to an output buffer or to the central crossbar buffer, depending on whether the requested output port is on the same MPort, as we explained before. Buffers allowed to transmit tag the top header flit as X-ready. A central buffer has to arbitrate between the four input buffers which are connected to its MPort. An output buffer has to arbitrate between the 24 central crossbar buffers and its four MPort buffers.
- -
- X (Xbar): Once the allocation is performed, the input and central crossbar buffers, which were selected on the VA-SA stage, transmit those flits tagged as X-ready to the appropriate output buffer or central crossbar buffer. If a packet is moved from an input buffer to the central crossbar, the header flit is tagged again as VA-SA-ready in order to perform a VA-SA stage from central crossbar buffers to output buffers. Flits that reach the requested output buffer are tagged as OB-ready. The bandwidth depends on the input/output pair: 3 flits/cycle can be delivered from input buffers to central crossbar buffers, while 4 flits/cycle can be sent from central crossbar buffers to output buffers.
- OB (output buffering): Each output buffer with OB-ready packets chooses which VL will send flits to the neighbor switch. The scheduler selects a VL to each output buffer with OB-ready packets and enough credits to transmit at least one packet. When an output buffer transmits the last flit of the packet (i.e., the tail flit), the output buffer is released and the scheduler selects another VL. Each output port can send 1 flit/cycle. At this point, QoS and packet preemption can be applied. In our first approach, the VL selection process is performed by a round-robin scheduler and packet preemption is not implemented yet.
At the input, output, and central buffers, VLs are dynamically managed, which means that we do not have an independent buffer per VL. Instead, the buffer storage space is divided according to the traffic requirements. We ensure a minimum and a maximum space per VL. This strategy also provides much more flexibility than having a fixed buffer space for each VL.15 This flexibility is specially useful for future QoS purposes.
2.2 Stage latencies
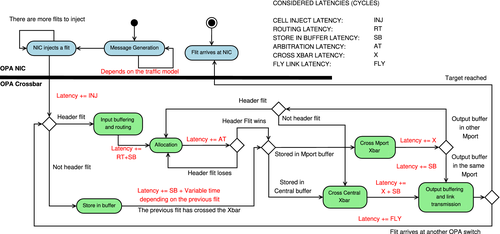
- The source NIC injects the header flit, represented by the “NIC injects a flit” state in Figure 2 (top left).
- The flit adds INJ cycles to the total latency of this packet.
- After that, the header flit triggers the “input buffering and routing” event. The input buffering latency is SB cycles and the routing latency is RT cycles. At this point, the accumulated latency of the header flit is INJ + RT + SB cycles.
- Then, that flit is processed by the “allocation” event, triggered by the “routing” event. The “allocation” event adds the latency AT to the header flit, since this event performs the virtual allocation and the switch allocation. The total flit latency is now INJ + RT + SB + AT cycles.
- The next events triggered are “cross MPort Xbar” and “cross central Xbar,” where the flit is moved to an output buffer or to a central crossbar buffer, depending on the output MPort of the packet. If the flit travels to an output buffer, then the flit adds X and SB cycles to the final latency. However, if the flit has to cross a central crossbar buffer, the flit adds X + AT + X + SB cycles. This is because the header flit will have to cross its MPort, then the “allocation” event will happen again, it will be sent from the central crossbar buffer to the output buffer, and finally, it will be stored on the output buffer. In Section 2.1 (VA-SA and X events descriptions), more details about this process can be found. Then, the total latency at this point is INJ + RT + 2 SB + 2 AT + 2 X cycles.
- Note that there is no latency associated with the central crossbar buffers storage, as we consider those to be “perfect” buffers1. This means that buffers do not require any additional time to store data.
- Finally, the header flit is sent to the neighbor switch. Then, the latency required to go through the link is added (i.e., FLY). Therefore, the final latency is INJ + RT + 2 SB + 2 AT + 2 X + FLY cycles in the worst scenario without contention, which means that the flit does not have to wait to use the switch resources.
It is important to note that we have taken into account two assumptions: the output buffering latency includes serializer and transmission latency and the input buffering latency includes also the deserializer latency.
Finally, we assume that each port has a bandwidth of 100 Gbps and the flit size is 64 bits. This means that the operational frequency is 1.6 GHz. Given that, the latency is 160 cycles in the worst case. The latency distribution is: 32 cycles for routing, 50 cycles for storing in input/output buffers, 16 cycles for arbitration, two cycles for Mport/central Xbar, and eight cycles for transmission.
3 OPA SUPPORT FOR QOS
- Virtual lanes (VLs) provide dedicated receive buffer space for incoming packets at switch ports. VLs are also used for avoiding routing deadlocks. The Intel OPA architecture supports up to 32 VLs.
- Service channels (SCs) differentiate packets from different Service Levels. The SC is the only QoS identifier stored in the packet header. Each SC is mapped to a single VL, but a VL can be shared by multiple SCs. The SCs are used for avoiding topology deadlocks and avoiding head of line blocking between different traffic classes. The Intel OPA architecture supports up to 32 service channels; however, SC15 is dedicated to in-band fabric management.
- Service levels (SL) are a group of SCs. An SL may span multiple SCs, but an SC is only assigned to one SL. SLs are used for separating high priority packets from lower priority packets belonging to the same application or Transport Layer or avoiding protocol deadlocks. The Intel OPA architecture supports up to 32 SLs.
- Traffic classes (TC) represent a group of SLs aimed to distinguish applications' traffic. A TC may span multiples SLs, but each SL is only assigned to a TC. The Intel OPA architecture supports up to 32 TCs.
- A vFabric is a set of ports and one or more application protocols. For each vFabric, a set of QoS policies are applied. A given vFabric is associated with a TC for QoS and a partition for security.
SLs are mapped to SCs via the SL2SC and SC2SL tables, depending on whether the packets are sent or received, respectively. Each SC carries traffic of a single SL in a single TC, and the fabric manager (FM), configures how SCs map onto the VL resources at each port. The FM is the responsible of: discovering the fabric's topology, provisioning the fabric components with identifiers, formulating and provisioning routing tables and monitoring utilization, performance and error rates. A configurable VLArbitration algorithm determines the way packets are scheduled through multiples VLs. In addition, packet preemption can be configured to allow a higher priority packet to preempt a lower priority packet. Packet preemption means that a packet using a high priority VL, arriving at the output port, can preempt an in-progress packet in order to minimize the latency of the high priority packet. Once the high priority packet is transmitted, the suspended packet resumes its transmission.
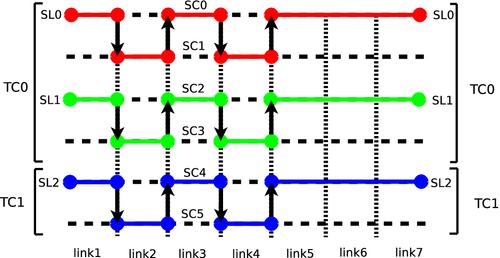
Figure 3 shows an example of the use of TCs, SLs, and SCs across the paths followed by three traffic flows (red, green, and blue) in an OPA network. The different links crossed by these packets are ordered from 1 to 7. In this example, we assume the use of two TCs (TC0 and TC1), three SLs (SL0, SL1, and SL2) and six SCs (SC0, SC1, SC2, SC3, SC4, and SC5). Moreover, each SL is assigned with two SCs, which, in turn, are mapped to two VLs. TC0 (i.e., traffic flows red and green) is used for a request/response high level communication library such as partitioned global address space protocol (PGAS2). TC0 is assigned with SL0 (red traffic flow) and SL1 (green traffic flow). SL0 is mapped to SC0 and SC1, and SL1 is mapped to SC2 and SC3. On the other hand, TC1 is used for storage communications. It is assigned with SL2, and SL2 is mapped to SC4 and SC5. The main goal of assigning a pair of SCs for each SL is topology deadlock avoidance, as it happens normally in tori topologies, while the SLs of TC0 are used for avoiding protocol deadlocks. As we can see in the figure, packets can change of SC link by link; however, the SL and TC are always consistent end-to-end.6
3.1 Simple bandwidth table
In this section, we will explain a QoS algorithm, called simple bandwidth table (SBT). SBT is based on an arbitration table per output port with two columns: the first column records a service level (SL) and the second column stores an associated weight for each SL. Table 1 shows an example where two SLs are considered: SL0, which has a weight of 55; and SL1, which has a weight of 45. These associated weights represent how many packets each SL may deliver on each output port. Weights are subtracted 1 by 1 when a packet on a output port and SL is delivered. When a table runs out of weight, the SBT algorithm resets weights. However, there is an exception: if an SL does not have enough weight left but it is the only one with packets ready for delivery, the SBT algorithm allows the transmission to avoid starvation and waste the link bandwidth. This way, the total bandwidth is split. The bandwidth division is given by the ratio between entries. For example, an SBT with one SL and associated weights of 20, will get 100% of the bandwidth. An SBT with two SLs and an associated weight of 20 and 10, respectively, the first SL will get 66.6% and the second SL will get 33.3% of the total bandwidth. For the sake of simplicity, we have established that the sum of all entries has to be 100. In this way, the ratio can be easily computed.
| SL | Weight |
|---|---|
| 0 | 55 |
| 1 | 45 |
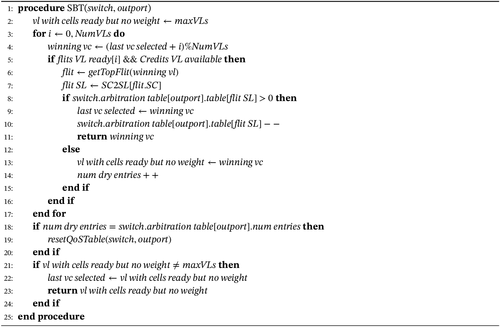
Algorithm 1 shows the generic mechanisms of the SBT QoS algorithm on every port, where the getTopFlit(vl) function allows to extract the VL top flit, that is, the packet header flit, given an VL. Since the architecture uses virtual cut-through as switching technique, this algorithm is only applied to header flits, so that body and tail flits will always follow the header flit. Note that the arbitration table has one entry per SL. Furthermore, according to Reference 6, the SC is the only QoS identifier contained in packets. Because of that, SC2SL tables are used to get the SL from the SC packet identifier.
Each output port implements one arbitration table and each arbitration table has as many entries as SLs in the system. This technique and all QoS mechanisms detailed in Section 3 have been implemented in our simulation tool OPAsim. Moreover, we have implemented other required mechanisms to enable a detailed and flexible simulation tool in order to be able to perform comparative experiments.
4 EVALUATION RESULTS
- End-to-end latency per SL: Average message latency of all the messages labeled with the same SL measured from generation to reception.
- Network latency per SL: Average message latency of all the messages labeled with the same SL measured from injection into the network to reception.
- Throughput per SL: The total amount of delivered information per SL expressed in flits/cycle/NIC.
- Normalized throughput per SL: The total data amount transmitted through the network per SL expressed in percentage.
To stablish baseline for comparison, a simple round-robin output scheduler has been used. The round-robin scheduler distributes equally the total bandwidth among all SLs. The total bandwidth that each SL will obtain is , where NumSLs is the total amount of SLs in the system. Hence, the round-robin scheduler represents an scenario where any QoS provision is given. We have analyzed the performance of a single OPA switch with the configuration of a first generation of OPA switches: 48 ports, flit size of 64 bits, input/output port queue size of 256 flits, and so on (further details can be found at Reference 6). The values shown for each injection rate are the average of 30 different simulations varying the seed of the random number generation.
We have carried out experiments with two traffic patterns. The first traffic pattern is random uniform, which creates contention in the network. The second traffic pattern is generated by the function dst = (src + 1)%NumNICs, where dst is the NIC destination identifier, src is the NIC source identifier and NumNICs is the total amount of NICs in the system, in this case 48 NICs. We have chosen this second traffic pattern because it does not create contention in the network and we have considered interesting to analyze the SBT behavior when all SLs may inject as many packets as they want. We have analyzed different configuration of SLs, SCs, VCs, generation ratios and output tables. For the sake of clarity, we have plotted each SL in different QoS algorithms with the same line color and each QoS algorithm with a different point style.
Table 2 shows the SL2SC, SC2VL, generation percentage and output table configurations. The generation table represents the percentage of messages that each application with a given SL injects into NICs3For instance, let us suppose simulation where the injection rate is 1 flit/cycle/NIC, using the generation percentages shown in Table 2 with the configuration A, the SLs 0, 1 and 2 will inject 0.5, 0.4, and 0.1 flit/cycle/NIC, respectively.
| Configuration A | Configuration B | ||||||||||||||
|---|---|---|---|---|---|---|---|---|---|---|---|---|---|---|---|
| SL2SC | SC2VL | Inj. Per. | Arb. Tab. | SL2SC | SC2VL | Inj. Per. | Arb. Tab. | ||||||||
| SL | SC | SC | VL | SL | % | SL | W | SL | SC | SC | VL | SL | % | SL | W |
| 0 | 0 | 0 | 0 | 0 | 50 | 0 | 60 | 0 | 1 0 | 0 | 0 | 0 | 40 | 0 | 50 |
| 1 | 1 | 1 | 1 | 1 | 40 | 1 | 30 | 1 | 2 | 1 | 1 | 1 | 50 | 1 | 30 |
| 2 | 2 | 2 | 2 | 2 | 10 | 2 | 10 | 2 | 3 | 2 | 2 | 2 | 10 | 2 | 20 |
| 3 | 2 | ||||||||||||||
Figures 4 and 5 show the results of both configurations. Each plot shows the metrics previously described: end-to-end latency (A, B), network latency (C, D), throughput (E, F) and normalized throughput (G, H) per SL. Results show that the SBT algorithm does not provide latency guarantees, but only bandwidth guarantees. In the scenario without contention, the end-to-end latency plots (A, B) have the same trend as the scenario with contention; however, it achieves lower absolute values than the scenario with contention. When there is no network contention, packets can use the network resources as soon as they are requested. Therefore, packets in the network do not suffer additional delays. This fact can be seen in network latency plots: the network latency remains constant for the scenario without contention (plot D), while network latency fluctuates in the scenario with contention (plot C). When the network is not in a congested state, the only limitations imposed to SLs are: the generation rate and the bandwidth division policies (i.e., the output table scheduler). For instance, using the configuration A, the SL0 generates more traffic than the SL1 and the SL0 has a bigger percentage of bandwidth reserved, therefore, the end-to-end latency is reduced. The SL2 has a lower amount of guaranteed bandwidth, but it has also a lower number of packets to transmit. Therefore, the end-to-end latency achieved is lower than that achieved by the SL1.
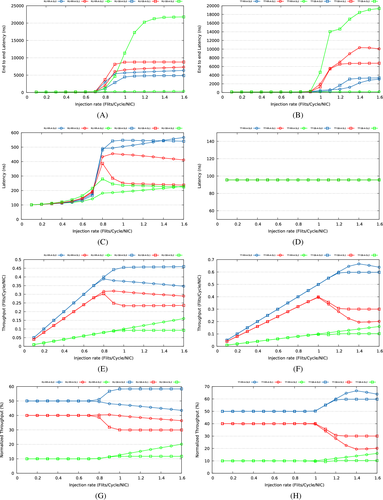
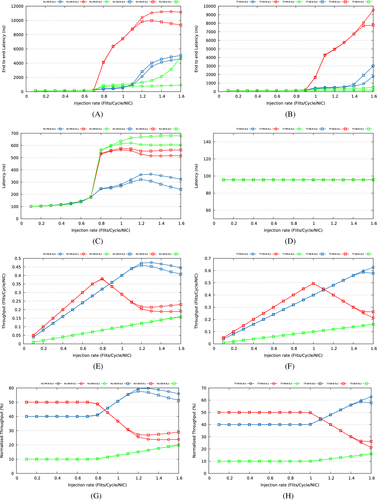
Regarding throughput, in the scenario with contention, apparently, the scheduler does not achieve the requirements specified by the output tables. The reason behind this fact is because the switch is congested from the injection rate 0.7 flits/cycle/NIC, that is, the switch receives more traffic than it is capable to deliver, before to reach the theoretical maximum throughput. For instance, the configuration A specifies 60% of the bandwidth to the SL0, but the SL only gets 0.45 flits/cycle/NIC. Nevertheless, this means 60% of the achieved throughput under saturation, which is the percentage stated by the output table. This fact can be seen in normalized throughput plots (G, H). In the scenario without contention, the achieved throughput for each SL is almost the same as the one configured in the output tables.
Note that for the case of the SBT algorithm, the SL1 is penalized, in both configurations, when there is not enough bandwidth to satisfy the QoS requirements of SLs 0 and 2. While there are enough resources available, SL1 may get 40% of the offered throughput. Nevertheless, when congestion appears, the total available bandwidth is not enough to deliver packets generated by SL0 because SL1 has exceeded the reserved bandwidth. The bandwidth before used by SL1 now is used by SL0 in order to satisfy its QoS requirements. Therefore, SL1 throughput is reduced to 30%, according to the output table configuration.
5 CONCLUSIONS AND FUTURE WORK
This article describes OPASim, which is an OPA-based simulation tool to model the main characteristics of an OPA switch. In addition to the basic mechanisms that enable communications between any pair of network devices, we have implemented the main mechanisms in charge of providing QoS to applications such as SL2SC, SC2VL, arbitration tables, and other elements that allow us to test and compare different QoS policies.
We have tested and compared the SBT output scheduler against a simple round-robin output scheduler. Results show that SBT is able to segregate traffic by SL and provide bandwidth guarantees with respect to the established comparison baseline, round-robin. We have also been able to confirm that in a congestion state, the system is capable of redistributing the bandwidth. Therefore, the SBT scheduler performs a well balancing of the available bandwidth among the output flows.
As a future work, we plan to carry out a comparison of hierarchical and nonhierarchical crossbar switch architectures in terms of QoS provision. The main goal is to implement the same output scheduling algorithm in both architectures and to test if the fact of having different crossbar architectures makes necessary an adaptation of the current output schedulers. We also want to research what the differences are, if any, between both architectures in terms of end-to-end packet latency and throughput.
ACKNOWLEDGMENTS
This work has been supported by the Junta de Comunidades de Castilla-La Mancha, European Commission (FEDER funds) and Ministerio de Ciencia, Innovación y Universidades under projects SBPLY/17/180501/000498 and RTI2018-098156-B-C52, respectively. It is also co-financed by the University of Castilla-La Mancha and Fondo Europeo de Desarrollo Regional funds under project 2019-GRIN-27060. Javier Cano-Cano is also funded by the MINECO under FPI grant BES-2016-078800.
Biographies

Javier Cano-Cano received the degree in Computer Science mention on Computing Engineering from the University of Castilla-La Mancha, Spain, in 2015, and the M.Sc. degree in Computer Science from the University of Castilla-La Mancha in 2016. He is currently a Ph.D. student in the Albacete Informatics Research Institute of Albacete, University of Castilla-La Mancha founded by the MINECO under FPI grant. His research interests include high-performance networks, QoS, multicore systems, switch architecture, and simulation tools.

Francisco J. Andújar received the M.Sc. degree in Computer Science from the University of Castilla-La Mancha, Spain, in 2010, and the Ph.D. degree from the University of Castilla-La Mancha in 2015. He worked in the Universitat Politécnica de Valéncia under a postdoctoral contract Juan-de la Cierva, and currently works in the University of Valladolid as Assistant Professor. His research interests include multicomputer systems, cluster computing, HPC interconnection networks, switch architecture, and simulation tools.

Francisco J. Alfaro received the M.Sc. degree in Computer Science from the University of Murcia in 1995 and the Ph.D. degree from the University of Castilla-La Mancha in 2003. He is currently an Associate Professor of Computer Architecture and Technology in the Computer Systems Department at the Castilla-La Mancha University. His research interests include high-performance networks, QoS, design of high-performance routers, and design of on-chip interconnection networks for multicore processors.

José L. Sánchez received the Ph.D. degree from the Technical University of Valencia, Spain, in 1998. Since November 1986 he has been a member of the Computer Systems Department at the University of Castilla-La Mancha. He is currently an Associate Professor of Computer Architecture and Technology. His research interests include multicomputer systems, QoS in high-speed networks, interconnection networks, networks-on-chip, multicore architectures, parallel programming, and heterogeneous computing.
REFERENCES
- 1 This assumption has been taken for the sake of simplicity. In the early state of the simulation model development, we have realized that latency of these buffers have a huge impact in the performance, in real systems this latency has to be very low.
- 2 Partitioned global address space languages combine the programming convenience of shared memory with the locality and performance control of message passing.
- 3 Our simulation tool does not model the application behavior, just the injection of messages into the NIC queues, which is commonly referred as message generation.


