Asymmetric Diurnal and Monthly Responses of Ecosystem Carbon Fluxes to Experimental Warming
Abstract
Quantifying the diurnal and monthly responses of ecosystem carbon (C) fluxes is critical to accurately understand the feedback between global climate change and ecosystem C dynamics. However, the diurnal and monthly responses of ecosystem C fluxes to climate warming remain unclear. In this study, a field simulated warming experiment was conducted by using open top chambers to explore the diurnal and monthly responses of ecosystem C fluxes during one growing season (GS) in a Tibetan Plateau grassland. The results showed that ecosystem C fluxes responded unevenly to the simulated warming during one GS. Warming significantly increased C uptake (gross primary production) and sequestration (net ecosystem exchange) during the start (May to June) and peak (July to August) of the GS, but promoted ecosystem respiration (ER) during the peak and end (September to October) of the GS. Warming also had more pronounced positive effects on ER during night than during day. In addition, although warming significantly decreased the temperature sensitivity (Q10) of ER over the whole GS, Q10 also responded positively to warming during the start and end of GS as well as during the night. These results highlight the hypothesis that asymmetrical responses of the diurnal and monthly variations of ecosystem C fluxes and Q10 should be taken into consideration to project the C-climate feedback, especially under future non-uniform warming scenarios.
Abbreviations
-
- AGB
-
- aboveground biomass
-
- AIC
-
- akaike information criterion
-
- BGB
-
- belowground biomass
-
- ER
-
- ecosystem respiration
-
- ESM
-
- earth system model
-
- GPP
-
- gross primary productivity
-
- GS
-
- growing season
-
- NEE
-
- net ecosystem exchange
-
- OTC
-
- open-top chamber
-
- Q10
-
- respiration temperature sensitivity
1 Introduction
Global mean temperature has been increasing since the Industrial Revolution and is expected to rise another 1.2–6.1°C by the end of this century 1. This projected warming would have a great potential to alter ecosystem carbon (C) fluxes, causing either positive or negative C-climate feedback 2. Feedback will be positive if warming results in net C release, but negative if warming results in net C uptake in the ecosystem. In the IPCC earth system models (ESMs), C-climate feedback was modeled using uniform diurnal and seasonal ecosystem C fluxes 3, 4, but model results were variable and at times contradictory 5, 6. These modeling results are further undermined by recent research showing that the effects of warming on ecosystem C fluxes vary at different timescales 7-10. Understanding the effects of climate warming on ecosystem C fluxes at multiple timescales would provide valuable information for modeling ecosystem C-climate feedback.
Respiration temperature sensitivity (Q10), measured as the extent of change in respiration caused by a 10°C change in temperature 11, 12, is an important parameter to evaluate ecosystem C-climate feedback. To some extent, Q10 is partly set as a fixed value in many terrestrial biosphere models, such as JULES 13, BIOME-BGC [14], and PnET-CN 15. However, studies showed that Q10 was spatially heterogeneous and varied with environmental factors such as temperature and moisture 11. For example, Q10 was relatively higher during the edges (start and end) of the growing season (GS) than during its peak 16-18. It was also reported that Q10 may acclimate to warming due to depletion of soil substrates, limitation of soil moisture, and alteration of soil microbial activities 19, 20. These findings suggest that using a constant Q10 likely results in miscalculation of ecosystem C-climate feedback 19, and that the presumed strongly positive C-climate feedback might be weaker than previously thought over long time periods. It is thus necessary to gain a precise understanding of how Q10 responds to warming and to what degree this relationship changes both diurnally and seasonally.
Studies from ecologically sensitive regions are especially valuable to understand the responses of ecosystem C fluxes to warming, as these regions are expected to respond rapidly, thus revealing the underlying patterns of ecosystem C fluxes more clearly 21, 22. As the highest grassland on the Eurasian continent, the Tibetan Plateau is experiencing a higher than average increase in surface air temperature 1. Owing to its large area, high elevation, and large amount of soil C stocks, the C-climate feedback on the Tibetan Plateau has significant potential impacts for regional and global climate 21, 23, 24. Understanding how ecosystem C fluxes respond to climate warming on the Tibetan Plateau is therefore an important goal in and of itself; meanwhile the Plateau's high average Q10 also makes it an excellent site to study the C-climate relationship at a very fine scale.
Much of the previous research on ecosystem C-climate feedback on the Tibetan Plateau leaned heavily on modeling approaches, due in part to the harsh and challenging physical environment. However, modeling predictions were based on a set of controversial hypotheses, and resulting models have been at times contradictory and often contested 3, 25, 26. For example, a process-based biogeochemical model showed that warming increased net primary production and soil respiration by 0.52 and 0.22 Tg C per year, respectively, resulting in a net C sink on the Tibetan Plateau 4. Contrarily, a second study that organized C and hydrology into dynamic ecosystem models showed that an increase of temperature by 2°C stimulated a transfer of 10% of soil C to the atmosphere, even though warming also significantly increased net primary productivity by 9% 3. Model parameters and projections clearly need to be carefully examined against empirical evidence from field experiments; therefore, field observations of the responses of ecosystem C fluxes to experimental warming from the Tibetan Plateau are urgently needed.
As one of the most widespread vegetation types on the Tibetan Plateau, alpine meadow grasslands account for about 48% of the Plateau's land area. However, the way ecosystem C fluxes respond to warming in this sensitive and remote region remain unclear, especially at different timescales. Here, a field warming experiment was established by using open-top chambers (OTCs) to study the effects of warming on the diurnal and monthly variations of net ecosystem exchange (NEE), ecosystem respiration (ER), and gross primary productivity (GPP). In light of previous field observations and modeling results, the following hypotheses were proposed; (i) warming would stimulate ecosystem C fluxes, resulting in higher NEE, ER, and GPP because temperature is a limiting factor on the cold Tibetan Plateau, and (ii) warming would have uneven effects on diurnal and monthly variations of NEE, ER, and GPP, due to fluctuating environmental factors or to the uneven responses of temperature sensitivity at different timescales.
2 Materials and methods
2.1 Study site
This study was conducted at the Haibei Grassland Ecological Monitoring Station of the China, Meteorological Administration in the meadow grasslands of the Xihai Town, Haiyan County, Haibei Prefecture, Qinghai Province, China (100°51′E, 36°57′N, 3140 m above sea level). Located deep in the interior of Eurasia, the study area has a typical continental plateau climate. The average annual precipitation is 398.2 mm from 1976 to 2010 and 85% of this fell during the GS from April to October. The annual average air temperature is 0.8°C, with the monthly mean air temperature ranging from −14.2°C in January to 13.4°C in July (Haibei Grassland Ecological Monitoring Station of the China Meteorological Administration). The study site has a sandy loam soil texture and is classified as “mountain brown” according to the Chinese soil classification system (cambisols in the Food and Agriculture Organization classification). The vegetation is typical meadow grassland dominated by Stipa sareptana var. krylovii, Aristida purpurea, Koeleriacristata, Cryptantha crymophila, Kobresia humilis, Artemisia scoparia, and Aster tataricus. The GS lasts from 20 April to 20 October (175 days), based on observations of phenology and plant growth traits 18, 27.
2.2 Experimental design
The study site (200 × 400 m2) was selected in 2008 and fenced to provide a relatively stable environment (Supporting Information Fig. S1). Before fencing it was freely grazed as a winter pasture, after fencing all livestock grazing was completely excluded. There were 10 m wide buffer strips on all four sides of the study site. The study site was divided into six replicate blocks (about 180 × 60 m2 each), and each block was divided into two sub-blocks (about 90 × 60 m2 each), one for warming treatments and one for control. In August 2010, six OTCs were randomly installed in the six warming sub-blocks. The OTCs were made of 6 mm thick solar transmitting material that was conical in shape and 40 cm in height, covering 2.05 m2 at the ground (Supporting Information Fig. S1). These OTCs were modified according to the methods of the International Tundra Experiment 28 and have successfully been used in previous studies 29, 30.
2.3 Measurements
2.3.1 NEE and ER measurements
Diurnal NEE was measured with a cubic transparent chamber (0.125 m3, 0.5 m on each side) attached to an infrared gas analyzer in 2012 (LI-8100, LI-COR, Lincoln, NE). The chamber was sealed to an aluminum frame that had been inserted 2–3 cm into the soil to provide a seal between the soil surface and the chamber 31. Chamber walls were made of glass, which allows >90% of photosynthetically active radiation to pass into the chamber. Two small fans were used to mix the air inside the chamber during the measurement. After steady-state conditions were achieved within the chambers for 10 ∼ 30 s, consecutive recordings of CO2 concentrations were taken within 120 s. The increase in air temperature within the chamber during the measuring period was <0.2°C. Build-up or draw-down of the CO2 concentration in the chamber was insufficient to significantly alter stomata conductance, canopy photosynthesis, or respiration during the 2 min process 18, 31. Following the NEE measurement, the chamber was vented, replaced onto each frame, and covered with an opaque cloth. Usually, it took 30 s to achieve a steady state. Because light was eliminated, the values of CO2 exchange represented ER. ER was measured from 8 am to 5 pm (at 8 am, 11 am, 2 pm, and 5 pm, Beijing time) and NEE during daytime and nighttime (at 8 am, 11 am, 2 pm, 5 pm, 8 pm, 11 pm, 2 am, and 5 am). Nighttime values of NEE were equal to those of ER. GPP was calculated as the difference between NEE and ER from 8 am to 5 pm. Positive NEE values represent net C release from the ecosystem, while negative NEE values represent net C sequestration by the ecosystem 32. Measurements were taken twice each month from May to October 2012, on clear sunny days.
2.3.2 Plant biomass
 (1)
(1)Belowground biomass (BGB) was measured by soil core (3.5 cm in diameter) from depths of 0–40 cm with six replicates both in the warming and control sub-blocks 18. Roots were first washed and then oven dried at 65°C for 72 h. AGB, BGB coverage, and height were measured in each month during the GS.
2.3.3 Soil temperature and moisture
Soil temperature and moisture were recorded by HOBO data loggers (Onset Computer Company, Pocasset, MA) at 10 cm soil depths. Soil temperature was measured using a thermocouple probe. Soil volumetric water content was measured using gypsum cast around two concentric stainless steel electrodes (Delmhorst Instrument, Towaco, NJ). The data loggers recorded the average soil temperature and soil moisture every 5 min during the whole experimental period.
2.4 Data analysis
The whole GS was divided into three stages (start of GS [May to June], peak of GS [July to August], and end of GS [September to October]) based on the long-term observations from the eddy covariance technique and the long-term observations of phenology and meteorology 13-15, 35, 36. Diurnal and monthly mean values were calculated from the diurnal measurements for each replicate. Monthly mean values were calculated using all of the diurnal values from each of the two measurement days in each month. Repeated measure ANOVA analysis was used to examine the effects of sampling date, warming, and their interactive effects on NEE, ER, GPP, AGB, and BGB. Repeated measure ANOVA was applied both for each date measurement (eight groups of repeated measurements) and for the whole GS. For the whole GS, ecosystem carbon fluxes were calculated from the average values from each month, which were first calculated from the diurnal measurements for each replicate. Significant differences were evaluated at the level p < 0.05. Regression analysis was used to evaluate the relationships of monthly variations of soil temperature, soil moisture, and the monthly variations of NEE, ER, GPP. Multiple regression analysis was adopted to test warming-induced changes in soil temperature, soil moisture, AGB, and BGB and the corresponding changes in NEE, ER, and GPP, respectively. Warming-induced variations were calculated as the difference between the warming and control plots. The goodness of fit relative to the number of model parameters was evaluated by the Akaike information criterion (AIC) for each model. The model with the smallest AIC value was selected as the best regression model 37. Pearson correlation analysis was used to evaluate monthly variations of soil temperature, soil moisture, and Q10.
 (2)
(2) (3)
(3)Both diurnal and monthly variations of Q10 for ER were calculated. Monthly calculations were based on the diurnal measurements in each month, and diurnal calculations were based on all data from day and night.
3 Results
3.1 Variations in microclimate, biotic, and abiotic factors
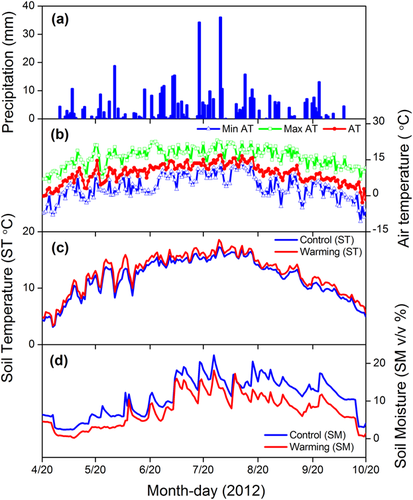
Precipitation in the study region falls mostly during May to October, and about 60% of the GS precipitation fell in July and August in 2012 (Fig. 1A). Monthly air temperatures co-varied with precipitation, with peak values of 13.29°C in July (Fig. 1B). The OTCs resulted in an increase in soil temperature but a decrease in soil moisture. The mean soil temperatures were 12.86 and 13.84°C for control and warming sub-blocks, respectively, whereas the mean soil moistures were 13.22 and 8.97% (Fig. 1 and Supporting Information S2). The effects of OTCs on soil temperature and soil moisture were greater during the day than during the night (Supporting Information Fig. S3).
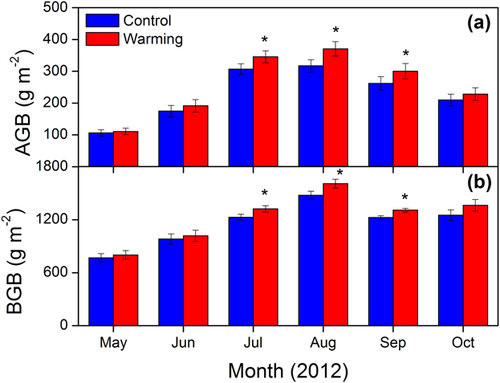
AGB and BGB increased rapidly from early May to late July, when peak values occurred (Fig. 2). Compared with control treatments, experimental warming significantly increased AGB and BGB over the whole GS by 12.3 and 7.1%, respectively. When comparing growth during each month interval, significant responses of AGB and BGB were only observed during the peak of GS. Experimental warming significantly increased AGB by 12.7, 16.9, and 14.5%; and significantly increased BGB by 7.7, 8.8, and 6.8% in July, August, and September, respectively (Fig. 2).
3.2 Diurnal and monthly variations of NEE, ER, and GPP
The results of the repeated measure ANOVA showed that there were significant differences between warm and control plots and between different dates for NEE, ER, and GPP, while the significant interactive effects of warming and measuring date effects were observed only for NEE and ER over the entire GS (Tab. 1).
| 19 May | 15 Jun | 10 Jul | 27 Jul | 14 Aug | 23 Aug | 14 Sep | 30 Sep | 13 Oct | GS | |
|---|---|---|---|---|---|---|---|---|---|---|
| Net ecosystem exchange | ||||||||||
| W | 32.50** | 56.63** | 15.67* | 45.40** | 5.68* | 13.35* | 1.88 | 3.11 | 0.02 | 38.08** |
| D | 108.20** | 27.61** | 27.54** | 48.90** | 230.68** | 57.94** | 130.16** | 135.36** | 48.52** | 219.98** |
| W × D | 14.46** | 1.31 | 0.62 | 0.92 | 1.23 | 0.98 | 1.38 | 4.75 | 0.21 | 4.08* |
| Ecosystem respiration | ||||||||||
| W | 2.93 | 5.48 | 5.22 | 20.41** | 24.76** | 10.89* | 35.07** | 13.82* | 35.16** | 26.56** |
| D | 80.19** | 72.46** | 73.55** | 125.04** | 239.11** | 94.96** | 64.83** | 28.83** | 116.06* | 320.81** |
| W × D | 0.87 | 0.74 | 2.20 | 0.25 | 0.55 | 0.24 | 0.28 | 0.15 | 1.77 | 4.70* |
| Gross primary productivity | ||||||||||
| W | 21.38** | 30.06** | 6.43* | 40.20** | 7.50* | 8.46* | 11.33* | 6.72* | 2.71 | 23.92** |
| D | 372.43** | 75.39** | 43.35** | 132.93** | 524.34** | 330.44** | 157.84** | 66.74** | 84.00** | 297.81** |
| W × D | 15.03** | 1.40 | 0.73 | 0.88 | 1.54 | 1.37 | 1.14 | 2.28 | 0.56 | 3.19 |
- Repeated measure ANOVA was applied both for each date measurement and for the whole growing season.
- *Significant difference at p < 0.05.
- **Significant difference at p < 0.001.
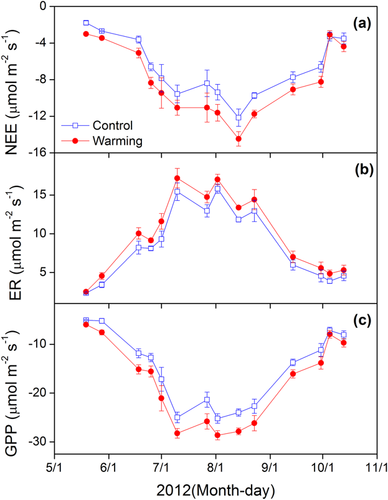
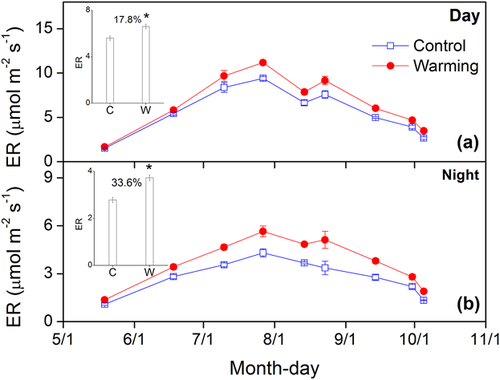
Monthly NEE, ER, and GPP all peaked in late July or early August (Fig. 3), which was in line with the monthly variations in soil temperature and soil moisture. When compared within each month, warming significantly increased NEE and GPP during the start (May to June), and peak (July to August) of the GS, while warming had no effects on NEE and GPP during the end (September to October) of the GS. In contrast, warming had no effect on ER during the start of the GS, but warming significantly increased ER during the peak and end of the GS (Tab. 1). In addition, there was more pronounced positive response of ER to warming during the night than the day (Fig. 4). Warming significantly increased ER by 17.8 and 33.6% during day and night, respectively.
3.3 Factors affecting NEE, ER, and GPP
NEE, ER, and GPP significantly increased with higher soil temperature and soil moisture (Supporting Information Fig. S4). The results of multiple regression analysis showed that warming-induced variations in NEE, ER, and GPP were closely associated with warming-induced changes in soil temperature, soil moisture, AGB, and BGB (Supporting Information Tab. S1). Biotic factors (AGB and BGB) together explained 50.4, 78.1, and 49.5% variation of NEE, ER, and GPP, respectively, while abiotic factors (soil temperature and soil moisture) accounted 42.4, 51.5, and 41.3% of variations. Biotic factors or abiotic factors together can explain more variations than any single factor for NEE, ER, and GPP.
3.4 Temperature sensitivity of ER
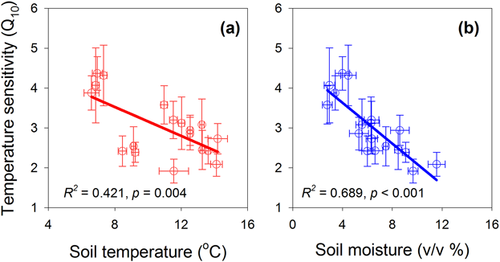
The values of Q10 in the current study varied from 1.92 to 4.37 (Tab. 2). During the whole GS, Q10 was 3.20 and 2.88 for the control and warming sub-blocks, respectively. Experimental warming significantly decreased Q10 by 8.2 and 10.0% for the daytime and the whole GS, respectively, but warming significantly increased Q10 by 18.2% during the nighttime. Q10 was relatively higher during the start and end of GS than during the peak of GS, and during the night than during the day (Tab. 2). Monthly average Q10 values were negatively correlated with soil temperature and soil moisture, in which soil temperature and soil moisture explained 42.1 and 68.9% of the monthly variations in Q10 (Fig. 5).
| Date | Control | Warming |
|---|---|---|
| 19 May | 3.88 ± 0.43 | 4.37 ± 0.42* |
| 15 Jun | 3.58 ± 0.48 | 3.2 ± 0.47* |
| 10 Jul | 3.12 ± 0.66 | 2.94 ± 0.38 |
| 27 Jul | 2.86 ± 0.41 | 2.43 ± 0.33* |
| 14 Aug | 3.08 ± 0.65 | 2.73 ± 0.38* |
| 23 Aug | 2.45 ± 0.49 | 2.09 ± 0.3* |
| 14 Sep | 2.54 ± 0.49 | 1.92 ± 0.3* |
| 30-Sep | 2.42 ± 0.38 | 2.39 ± 0.25 |
| 13 Oct | 4.07 ± 0.94 | 4.32 ± 0.76* |
| Day | 2.82 ± 0.23 | 2.59 ± 0.2* |
| Night | 2.53 ± 0.18 | 2.99 ± 0.2* |
| GS | 3.2 ± 0.16 | 2.88 ± 0.13* |
- *A significant difference between the control and warming at p < 0.05, values are mean ± standard error of six replicates.
4 Discussion
4.1 Warming effects on microclimate and plant productivity
The OTCs in the current study resulted in a relatively warmer and drier microclimate (Fig. 1 and Supporting information S2), which was consistent with previous reports from other study sites 38, 39. The warming magnitudes by OTCs were also similar to the mean global temperature increase (0.76°C) since the Industrial Revolution 40, validating the use of OTCs to mimic realistic climate change 28. However, the OTCs were more effective at increasing daytime temperatures than night time temperatures (Supporting information Fig. S3), which has been reported in previous studies 38, 41. The difference in daytime versus nighttime temperature mediation can be explained by the OTC design, which magnifies solar warming in daylight but provides little insulation to maintain higher temperatures through the night 28. OTCs also led to significant decreases in soil moisture, which can be attributed to a combination of reduced precipitation within the OTCs due to their conical shape, the elevated temperature-induced increases in internal evapotranspiration, and the elevated evapotranspiration associated with the increased plant biomass 24.
Experimental warming significantly increased AGB and BGB over the whole GS (Fig. 2), which is consistent with recent results from the Tibetan Plateau and other regions 42-44. Vegetation growth on the Tibetan Plateau is typically constrained by the low temperatures, thus it was not surprising that the relatively warmer climate would significantly increase plant growth 45-47. Because temperature and precipitation share the same seasonal pattern, it is difficult to assess the relative influence of each on plant growth. However, the fact that the OTCs promoted AGB and BGB despite relatively lower soil moisture suggests that soil moisture may not be a key limiting factor at this range of temperature and precipitation, though the situation might be different in a drought 48, 49. Other possible explanations for the warming-induced increases in AGB and BGB might include warming-induced changes in community composition 50, prolonged GS [36], and enhanced nutrient availability 45.
4.2 Asymmetric effects of warming on ecosystem C fluxes
The responses of ecosystem C fluxes to warming may depend on timescales, since they were promoted by different phenological and ecophysiological processes 51, 52. Warming significantly increased C uptake (GPP) and sequestration (NEE) during the start but not the end of GS (Tab. 1). OTC-induced advanced green up and rapid plant development 53 have been suggested as the most likely mechanisms during that period 54-57. In contrast, warming had no effects on NEE and GPP during the end of GS (Tab. 1), even though warming has been reported to delay leaf senescence in other ecosystems 58. It is likely that photosynthetic activity was repressed by other factors during this period, such as lower soil temperature, soil moisture, soil nitrogen availability 59, or phonological patterns tied to photoperiod rather than temperature 60.
Contrary to NEE and GPP, warming significantly increased ER during the end but not the start of GS (Tab. 1). Given that respiration from microbes accounts for more than half of ER 61, 62, the warming effects on ER may be largely driven by availability of nutrients for microbes 20, 63. During the end of GS, a warming-induced higher input of fresh litter and greater amount of C transfer from aboveground to belowground enriched the soil with large amounts of available biological food for microbes 64, 65. This fresh C input would also stimulate soil organic matter decomposition through priming effects 65. These results provide clear evidence that warming had asymmetrical effects on ecosystem C fluxes during one GS, in which warming stimulated C uptake and sequestration during the start of GS, while warming enhanced C respiration during the end of GS.
Warming had more pronounced effects on ER during the night than during the day (Fig. 4). This was unexpected, since warming by OTCs had smaller effects on soil temperature during the night than during the day (Supporting Information Fig. S3). One possible explanation might be that warming during the day stimulated plant photosynthesis and C transfer to belowground, which would supply the plants and microorganisms with substrates for respiration during night 66, 67. In addition, ER was more temperature sensitive during the night than during the day (Tab. 2), meaning that even small increases in temperature would have comparatively large effects on ER during the night. This finding is particularly important in light of the fact that nights are warming faster than days 1. These results suggest that asymmetric diurnal responses of ER to warming should be taken into consideration when studying or modeling ecosystem C fluxes, particularly across regions with large diurnal temperature swings.
4.3 Warming effects on the temperature sensitivity of ER
Q10 is among one of the most important parameters in the current terrestrial biosphere models, even though the variations and the factors affecting Q10 are still under debate. The results show that warming decreased Q10 through the entire GS; the reductions in Q10 and the range of Q10 in the current study are also comparable to other related studies on the Tibetan Plateau and other regions. From a mechanistic perspective, warming-induced reductions in Q10 can be ascribed to decreased soil moisture 68, depletion of labile substrates 69, or acclimation of both plant and microbial respiration 70. Plants and microbes on the cold Tibetan Plateau have long been constrained by the lower temperatures, thus it is possible that they may respond positively to even small increase in temperatures, at least for the current short-term warming experiment. Therefore, warming-induced reductions in soil moisture and depletion of soil substrate would contribute the most to the observed reductions in Q10, yet further studies are needed to clarify the soil moisture and substrate regulation of Q10. To some extent, Q10 was treated as a constant value in ESMs 71, 72, the results of which tended to show a major positive feedback loop of respiration to reinforce global warming 73. Warming-induced decreases of Q10 in the current study might therefore weaken the predicted positive ecosystem C climate feedback, but this finding also hides important variability.
Relative higher Q10 is observed during the edges of GS than during the peak of GS, contrasting with the monthly variations of soil temperature and soil moisture during one GS (Tab. 2). This may suggest that Q10 would vary temporally and soil temperature and soil moisture may affect the monthly variations of Q10. Plants and microorganisms are typically more metabolically sensitive to temperature changes at the upper or lower ends of their optimal ranges 18, 27, 74, thus it is likely that they would respond abruptly to even small changes in soil temperature and moisture. This might be one of the reasons for the large temperature sensitivity during the edges of GS. ER is primarily limited by low temperatures on the cold Tibetan Plateau, and appears to rise in a logarithmic curve once the limiting floor temperature is exceeded (Supporting Information Figs. S4 and S5). During the peak of GS, temperature is relatively high and mostly above the range of logistic variation, so Q10 is relatively low compared to the colder months during the start and end of the GS. This trend was consistent with further regression analysis showing that Q10 was inversely related to monthly averaged temperatures (Fig. 5). The relationship between temperature and Q10 can also account for the higher Q10 values observed during the night than during the day.
What then explains the positive responses of Q10 to warming during the edges of GS and during the night (Tab. 2), when temperatures are relatively low? ER is driven largely by microbial activities, which is known to be relatively lower in spring and fall in part due to thermal constraint by low temperatures 61. When ambient temperature is close to the microbial metabolic low threshold, as is likely during the cold Tibetan springs, autumns, and nights, microbes would be highly sensitive to even small increases in temperature 20, 22. Experimental or climatic warming during these time periods would then allow for greater microbial activity and thus elevated ER and Q10. Other studies have also reported that warming-induced elevated input of root exudates, fresh litter, and the higher amount of C transfer from aboveground to belowground would also stimulate microbial activities, leading to relatively higher Q10 64, 65, 75. While warming resulted in a lower average Q10 over the entire GS, the average effect may be less informative or relevant than the relative timing of climate warming and Q10 fluctuations.
4.4 Uncertainties
A previous publication showed that warming significantly enhanced NEE and GPP, but had no impacts on ER in the annual scale 61. The enhanced NEE and GPP might be largely associated with the warming-induced changes in plant functional types and plant biomass, while the non-significant response of ER resulted from the contrasting responses of its components. However, the effects of warming on ecosystem C fluxes also varied on timescales, since these processes were largely dependent on the phenological and ecophysiological stages 51, 52. Therefore, understanding the responses of ecosystem C fluxes at different timescales, such as the diurnal and monthly responses would contribute greatly to the understanding of the feedback between ecosystem C fluxes and global warming 3, 4. Because of the difficulty associated with taking the diurnal measurements on the Tibetan Plateau (ecosystem C fluxes were measured at 3 h intervals during day and night over the whole GS), the diurnal variations of ecosystem C fluxes in the current study were only measured in one GS in 2012. Long-term observations of the diurnal and monthly variations of ecosystem C fluxes would make the patterns and underlying mechanisms more clear. Although the one GS observations may partially weaken the conclusion, the results provide clear evidence that warming has uneven effects on the diurnal and monthly variations of ecosystem C fluxes, as well as on the Q10. These processes are not well captured in current ESMs.
Each possible experimental warming method will have some unexpected impacts, making the control plots differ in more aspects than temperature alone 76, 77. Although the OTC is one of the most widely used warming methods, it should also be noted that there are some inevitable shortcomings for the warming experiment by OTC 61, 78, 79. First, warming by OTC may have larger effects on air temperature than soil temperature, making the plants may suffer extremely high temperatures and relatively low air humidity 61, 80. Second, OTC would reduce soil moisture due to enhanced soil evaporation and plant transpiration as also observed in the current study 81, 82. Third, OTC may also reduce the input of photosynthetically active radiation 83, but the design of OTC (material, height, and angle) in the current study closely followed the methods developed by International Tundra Experiment for grassland, and they are not large enough to affect the solar input 84, 85. Nevertheless, warming by OTC also has many advantages, particularly for the remote Tibetan Plateau regions, such as: inexpensive to operate, no supervision required, and easy to conduct and transport. This information suggests that warming by OTC may be one of the most suitable methods to study the climate warming effects in this remote meadow grassland.
5 Conclusion
Ecosystem C fluxes on the cold and temperature-sensitive Tibetan Plateau are expected to be highly sensitive to warming climate. The results showed that warming stimulated C uptake and sequestration during the start of GS, but increased C respiration during the end of GS. Together with the positive responses of Q10 to warming during the start and end of GS, these results suggest that warming would promote C respiration during these periods, especially during the end of GS. In addition, warming had more pronounced positive effects on ER during the night than during the day, and warming also significantly increased Q10 during the night. Such diurnal and monthly asymmetrical responses of ecosystem C fluxes and Q10 to warming scenarios are critically important in attempting to better understand ecosystem C fluxes, especially under the non-uniform warming scenarios.
This study suggests that models of climate warming and ecosystem C flux that use constant rates of C exchange and Q10 are prone to inaccuracy because they do not account for phenological and temperature-specific variations of these variables across seasons and diurnal periods. Due to these interactions, regions with strong seasonality of temperatures and where temperatures frequently encounter metabolic maximums or minimums for either plants or soil biota should be expected to respond more strongly to climate warming, and be more difficult to model.
Acknowledgments
This study was supported by “the Fundamental Research Funds for the Central Universities (3102016QD078),” the Ministry of Science and Technology (2012BAH31B03), State Key Laboratory of Loess and Quaternary Geology, Institute of Earth Environment of Chinese Academy of Sciences (SKLLQG1303), Natural Science Basic Research Plan in Shaanxi Province of China (2014JQ5177, GK201603079), and Hainan Marine Science and Technology Promotion (SQ2014KJXH0010). The authors gratefully acknowledge financial support from China Scholarship Council (award for one year's study abroad at the University of Oklahoma). We appreciate field assistants in the Haibei Grassland Ecological Monitoring Station of the China Meteorological Administration who provided valuable assistance during the field measurements and data collection.
The authors have declared no conflict of interest.


