Unraveling the atomic interdiffusion mechanism of NiFe2O4 oxygen carriers during chemical looping CO2 conversion
Da Song and Yan Lin contributed equally to this work.
Abstract
By employing metal oxides as oxygen carriers, chemical looping demonstrates its effectiveness in transferring oxygen between reduction and oxidation environments to partially oxidize fuels into syngas and convert CO2 into CO. Generally, NiFe2O4 oxygen carriers have demonstrated remarkable efficiency in chemical looping CO2 conversion. Nevertheless, the intricate process of atomic migration and evolution within the internal structure of bimetallic oxygen carriers during continuous high-temperature redox cycling remains unclear. Consequently, the lack of a fundamental understanding of the complex ionic migration and oxygen transfer associated with energy conversion processes hampers the design of high-performance oxygen carriers. Thus, in this study, we employed in situ characterization techniques and theoretical calculations to investigate the ion migration behavior and structural evolution in the bulk of NiFe2O4 oxygen carriers during H2 reduction and CO2/lab air oxidation cycles. We discovered that during the H2 reduction step, lattice oxygen rapidly migrates to vacancy layers to replenish consumed active oxygen species, while Ni leaches from the material and migrates to the surface. During the CO2 splitting step, Ni migrates toward the core of the bimetallic oxygen carrier, forming Fe–Ni alloys. During the air oxidation step, Fe–Ni migrates outward, creating a hollow structure owing to the Kirkendall effect triggered by the swift transfer of lattice oxygen. The metal atom migration paths depend on the oxygen transfer rates. These discoveries highlight the significance of regulating the release–recovery rate of lattice oxygen to uphold the structures and reactivity of oxygen carriers. This work offers a comprehensive understanding of the oxidation/reduction-driven atomic interdiffusion behavior of bimetallic oxygen carriers.
1 INTRODUCTION
Chemical looping (CL) is an attractive and promising technology due to its highly efficient CO2 capture and resourceful CO2 utilization capabilities.1, 2 In essence, it splits a conventional chemical reaction into multiple steps, and each takes place in a separate reactor, to achieve the step-wise conversion of chemical energy.3 In a circulating fluidized bed system (as shown in Figure 1), the oxygen carrier (OC, or MeO) provides an oxygen source for the conversion of fuel via active lattice oxygen, which is absorbed from the oxidizing medium (CO2, H2O, or air).2 Metal oxides (OCs) can effectively transfer oxygen between reduction and oxidation environments to partially oxidize fuels to syngas and convert CO2 into CO in different reactors, respectively. This endows the CL approach with several unique advantages.4 In particular, CL can achieve the clean and efficient conversion of fuels such as biomass, methane, or alkanes,5 thereby allowing for effective CO2 capture, because a sequestrable CO2 stream is readily produced without the need for an energy-consuming CO2 separation step.6 Most importantly, the reduced OC can convert CO2 into CO for CO2 resource utilization.7 Thus, CL is both an effective solution for CO2 reduction and a source of high-value-added fuels or chemicals.8 Therefore, CL is beneficial for solving a series of problems related to fossil fuel consumption and global climate change because it provides zero CO2 emissions and cascade energy utilization.9

Generally, OCs are necessary for the successful implementation of the CL technique. They can efficiently transfer lattice oxygen to the fuel and quickly absorb oxygen from the oxidizing medium (CO2, H2O, or air), as well as transfer heat between multiple reactors.10 To date, thousands of OC materials have been tested, but only a few metals/metal oxides (e.g., Cr, Zn, Co, Ce, and Fe) have shown reasonable CO2 reduction capacities.11, 12 Meanwhile, some studies have discovered that the multimetal composite oxides that are formed by combining two or more active components (e.g., Ni/Fe/Cu and Mn/Co oxides) generally exhibit enhanced reactivity due to synergistic effects.13-17 These composite metals provide enhanced CL reactivity and achieve CO2 resource utilization when used as OCs. They can be divided into two main types: (i) perovskite-type materials18-23 and (ii) iron-based materials.24-27 The latter are particularly attractive because of their high oxygen-loading capacity, good oxygen-transport ability, high redox reaction rate and selectivity, low cost, and environmental friendliness.28 Therefore, extensive studies have been conducted on the reaction properties of Fe-based composite OCs during CL conversion.29, 30 However, there have only been a few studies on the use of Fe-based composite metal OCs to convert CO2 into CO. For example, our research group has performed a detailed investigation on the reactivity of Fe–Ni bimetallic OCs during the CL process.31, 32 In particular, NiFe2O4 spinel composite OCs have been shown to exhibit excellent oxidation, reduction, and catalytic capabilities in the CL gasification of solid fuels, the CL dry reforming of gaseous fuels, and the CL hydrogen process.33 Thus, NiFe2O4 is regarded as an excellent OC candidate for the CL process.
Most CL CO2 conversion applications developed thus far involve oxygen transfer.3 During the partial oxidation of fuels to syngas, the lattice oxygen supplied by the OC determines the reaction rate and product selectivity. The reduced OCs split CO2, thereby converting the molecular oxygen of CO2 into lattice oxygen and producing CO. Therefore, investigations on the migration of lattice oxygen and the spatial evolution of the active component in the OC are paramount for the design and development of high-performance composite OCs. To date, several researchers have discussed oxygen-transfer mechanisms. For example, Li et al.28 used a Pt marking method to perform an experimental study on the diffusion of O anions inside an OC and discovered that the addition of a TiO2 carrier enhanced the oxygen anion diffusivity. Meanwhile, Chen et al.34 used ex situ X-ray photoelectron spectroscopy (XPS) to demonstrate that the lattice oxygen of a cerium-based OC decomposed CH3SH at 450°C, and they concluded that improved catalytic stability is closely related to the rapid migration of bulk lattice oxygen.34 Similarly, Zhao et al.35 utilized ex situ XPS to analyze the changes in oxygen concentration and the metal transitions that occurred on the surface of an OC at different stages of reduction, and they proposed that the reaction boundary was fixed at the physical boundary of the OC. Furthermore, Liu et al.36 used thermogravimetric analysis (TGA) to determine the various reduction degrees of copper–iron composite OCs and used ex situ XPS to obtain chemical information at three positions in the radial direction of the cross-sectional surface. Their results demonstrated that the ratios of different oxygen species at the three points were very similar. Notably, almost all previous studies have focused on the surface of metal composite OCs and have used either first-principles calculations37, 38 or ex situ characterization techniques.34-36 Consequently, the bulk oxygen migration and spatial evolution of the active components have only been demonstrated indirectly or surmised. However, while the surface oxygen of OCs is important for providing a fast initial reaction, the bulk lattice oxygen is the main oxygen source that plays an important role in CL CO2 conversion. Nevertheless, owing to certain technical challenges, no in situ studies have been conducted on the spatial evolution inside OCs. These challenges include relatively high fuel reactor temperatures. Since CL systems typically operate at 600–950°C, it is considered impractical to use hydrocarbons, such as H2, CO, or CH4, as model reactants to explore the migration and transformation of oxygen species within OCs.34 Meanwhile, optical or X-ray adsorption spectroscopies only reveal the average structural information on a macroscopic scale with statistical significance.39 Thus, an in-depth and systematic understanding of the lattice oxygen migration and spatial evolution characteristics of active components inside OCs during the CL process remains elusive.40
Conversely, in this study, redox tests were performed with an NiFe2O4 spinel OC under reducing (H2) and oxidizing (CO2/lab air) atmospheres using in situ environmental transmission electron microscopy (ETEM) in conjunction with in situ electron energy loss spectroscopy (EELS) at 850°C, which is close to the operating temperatures of most CL processes. The EELS technique offers the advantages of acquiring spectral information with a nanoscale spatial resolution and producing qualitative and quasi-quantitative information on nanoparticles from the interior to the surface.41 The ETEM dynamic video and EELS analyses were used to identify the migration and transformation of lattice oxygen and the spatial evolution of the active components inside the OC. Additionally, quasi-in situ XPS was used to investigate the surface reaction mechanism of the OC during CH4 reduction and CO2 oxidation. Finally, numerical calculations based on density functional theory (DFT) and ab initio molecular dynamics (AIMDs) were used to confirm the experimental findings. We discovered that the presence of the weak oxidant CO2 effectively maintained the reactivity of the OC in 10 redox cycles with high CO yields. Most importantly, we discovered that the metal atom migration paths depend on the oxygen transfer rates. Specifically, during CO2 oxidation, lattice oxygen migrates slowly (∼14 min), and a portion of Fe is oxidized initially, forming an Fe oxide layer on the surface. Meanwhile, a portion of Ni also migrates to the bulk phase and combines with the remaining Fe to form Fe–Ni alloys. Conversely, during air oxidation, lattice oxygen migrates rapidly, triggering the Kirkendall effect (∼2 s), and the atoms of the formed Fe–Ni alloys migrate toward the surface and rapidly combine with the lattice oxygen to form multiple hollow-shaped nanoparticles. The rapid release and recovery of lattice oxygen leads to an inhomogeneous distribution of metal atoms within the OC and promotes phase separation and material deactivation. Thus, this work demonstrates that the rate of lattice oxygen transfer can be modulated using oxidizing agents with suitable oxidizing activity, which in turn maintains the reactivity of the OC.
To the best of our knowledge, this study is the first to provide direct experimental evidence for the ionic migration and morphological evolution in spinel oxides during redox reactions using in situ ETEM–EELS and XPS techniques. Previous studies have generally concluded that during CL, metal atoms are fixed, and only lattice oxygen migrates. However, our discovery that the migration paths of metal atoms depend on the oxygen transfer rates highlights the importance of regulating the release–recovery rate of lattice oxygen to maintain the structure and reactivity of the material. This is crucial for designing high-performance OCs in the future.
2 MATERIALS AND METHODS
2.1 OC preparation
The preparation procedures are comprehensively described in previous work.42 The sol–gel method was used to prepare the NiFe2O4 nanoparticles. Nickel nitrate hexahydrate [Ni(NO3)2·6H2O] and iron nitrate nonahydrate [Fe(NO3)3·9H2O] were dissolved in deionized water to obtain 1 M Ni(NO3)2 and 2 M Fe(NO3)3 solutions, respectively. Citric acid, in an equivalent molar ratio to Ni(NO3)2, was then added to each solution, and a pH of 7.5 was obtained. Finally, each solution was heated to 65–75°C to evaporate two-thirds of the water, and a gel was formed when the solution was cooled to room temperature. The precursors were dried in a vacuum evaporator at 120°C and then calcined in a muffle furnace under an air atmosphere to create the ferrite phase. In each case, the temperature was increased from 25°C to 400°C at a ramping rate of 8°C/min and then maintained for 2 h. Thereafter, the temperature was further increased to 1200°C at a heating rate of 4°C/min and maintained for 2 h.
2.2 In situ ETEM and EELS
The OC was analyzed using ETEM (Titan ETEM G2). During the in situ experiments, the gas (H2 for reduction and CO2/lab air for oxidation) was continuously introduced into the ETEM microscope. During the redox experiments, the temperature and pressure of the reaction were kept constant at 850°C and 0.1 MPa, respectively. The O–K, Fe–L, and Ni–L edges were probed via EELS to obtain a quantitative analysis of the NiFe2O4 OC and to clarify the distribution of Fe and Ni ions on the surfaces and in the interiors of the particles.43 The valence states of the 3d transition metals were examined according to the intensity ratios of their white line features (Fe–L3/L2 and Ni–L3/L2), whereby a high peak value ratio for a particular element indicates a high valence.44 The metals and metal oxides were distinguished according to the difference in contrast using a high-angle annular dark-field (HAADF) detector, with the metals being brighter than the oxides because of the scattering effect of oxygen atoms.45 The relative content of each element was calculated from the EELS spectra using Gatan Microscopy Suite (GMS-3) software.
The lattice oxygen migration behavior exhibited during the CL process includes release and replenishment. In this study, the release process was studied using H2 as the reducing agent, and the replenishment process was studied using CO2/lab air as the oxidizing agent. The H2 reduction experiment was performed for 14 min, and the ETEM–EELS tests were conducted at reduction times of 3 and 10 min. The in situ oxidation was performed step-wise under a flow of CO2 and air for 14 min, with ETEM–EELS scanning at oxidation times of 30 s and 14 min.
2.3 Quasi in situ XPS
The valence states of the various metal ions and oxygen species of the OCs were investigated using quasi in situ XPS (Thermo Fisher Scientific ESCALAB 250Xi) with an Al Kα X-ray source (1486.6 eV) at an operating voltage of 20 kV and a current of 10 mA. For each experiment, a fresh (completely reduced) OC sample was prepared using a thermogravimetric analyzer (STA-409/PC). Each sample (about 100 mg) was then placed in the in situ reaction cell in the XPS device, and a gas (10 vol% CH4, CO2, or lab air) was continuously introduced at a flow rate of 100 mL/min. The temperature and pressure of the reaction cell were maintained at 850°C and 0.1 MPa, respectively, and OC reduction/oxidation times of 0, 5, 10, 20, and 50 min were investigated
2.4 DFT calculation
The DFT calculations were performed using the CP2K software package.46 The Perdew–Burke–Ernzerhof (PBE) function47 with Grimme's D3 correction48 was used to describe the system. Although the Kohn–Sham DFT has been used as the electronic structure in the framework of the Gaussian and plane wave method,49, 50 this PBE function fails to correctly reproduce the more strongly correlated Fe, Ni 3d electrons. Hence, this study adopted the “+U” Hubbard correction, which includes a different Hubbard Hamiltonian solely for the chosen localized electrons. Specifically, U values of 4.5 and 6.0 eV were adopted for the Fe and Ni atoms, respectively. The Goedecker–Teter–Hutter (GTH) pseudopotentials51 and DZVP-MOLOPT-GTH basis sets49 were used to describe the molecules. A plane-wave energy cutoff of 500 Ry was employed. Additionally, an AIMD simulation was performed on the NiFe2O4 surface. The NVT ensemble was performed at 1100 K using canonical sampling through velocity rescaling52 with a time step of 2 fs. The surface simulation was performed in a 3d periodic boundary box of 17 × 12 × 30 Å3.
2.5 Cyclic performance tests
Two comparative cycling experiments confirmed that the lattice oxygen release–recovery rate in the different atmospheres significantly influenced the synergistic effect and reactivity of the bimetallic OCs. First, 0.1 g of NiFe2O4 was used as the OC in the in situ reaction cell with methane serving as the fuel to evaluate the CO2 thermocatalytic splitting reactivity of the NiFe2O4 OC. Subsequently, in situ Raman spectroscopy was used to monitor the changes, and the flow rates of CH4, CO2, and air were maintained at 30, 30, and 100 mL/min, respectively, using mass flow meters. After being cooled, purified, and dried, the generated gas was collected in a sampling bag for gas chromatography (SHIMADZU Gas Chromatograph, GC-2014) analysis. During the experiment, the reaction times of CH4 reduction, CO2 reforming, and air oxidation were kept at 60 min, and the reaction temperature was maintained at 850°C.
3 RESULTS AND DISCUSSION
3.1 Characterization of the NiFe2O4 nanoparticle
To investigate the migration mechanism of the NiFe2O4 lattice oxygen, a NiFe2O4 nanoparticle was fixed on the sample platform for ETEM–EELS observation, as indicated by the red rectangle in the ETEM image in Figure 2A. The ETEM morphology and EELS mapping images show that the NiFe2O4 nanoparticle was about 200 nm in size and contained several relatively small nanoparticles. Moreover, a uniform distribution of the Fe, Ni, and O elements can be observed in the EELS mapping scan of NiFe2O4 (Figure 2A, top right image).
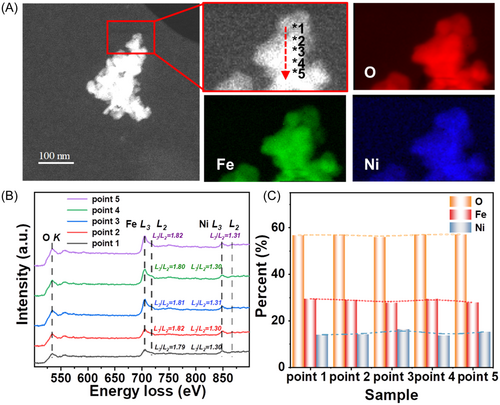
The EELS spot-scanning spectra obtained at 2 nm intervals (points 1–5) along the 10 nm red arrow in Figure 2A are presented in Figure 2B, where the O–K, Fe–L3, Fe–L2, Ni–L3, and Ni–L2 edges are located at approximatively 530, 705, 718, 848, and 867 eV, respectively. Furthermore, the chemical valences of Fe and Ni are indicated by white-line intensity ratios (L3/L2) of approximatively 1.8 and 1.3 for Fe3+ and Ni2+, respectively.44 This indicates that Fe3+ and Ni2+ are uniformly distributed in the bulk material along the 10 nm red arrow. Moreover, the quantitative analysis results presented in Figure 2C reveal that the Fe:Ni:O ratio was 4:2:1, which is consistent with the theoretical value for NiFe2O4. This result confirms that the Fe, Ni, and O contents in NiFe2O4 can be accurately detected by EELS. Moreover, the results of the characterization of NiFe2O4 using other basic techniques (XRD, scanning electron microscopy, etc.) have already been published.25, 32, 33
3.2 Fuel conversion (lattice oxygen release of OC)
Figure 3A presents the ETEM–EELS results obtained at a reduction time of 3 min. Here, a distinguishable phase separation between Ni and Fe can be observed, such that the NiFe2O4 diverges into two regions: points 1–4 (designated as Ni@Fe–O) and points 5–11 (designated as Fe–O). Notably, some elemental Ni detached from the NiFe2O4 bulk to accumulate and form a few metallic Ni (Ni0) with their surfaces covered by a layer of Fe oxides (Ni@Fe–O). The residual NiFe2O4 was transformed into homogeneous Fe–O. Unexpectedly, the valence state of Fe increased.
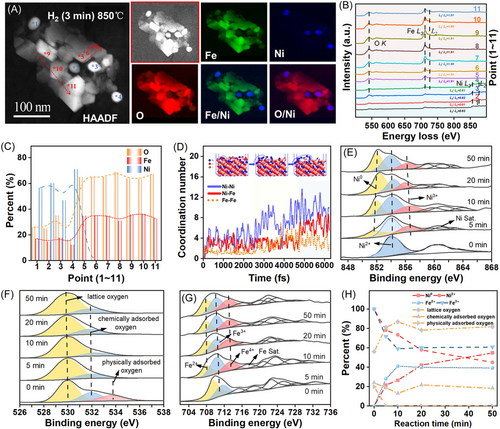
The EELS spectra at points 1–11 are shown in Figure 3B, which reveal that the Ni–L3/L2 intensity ratios of the Ni@Fe–O agglomerate decreased from around 1.3 for fresh NiFe2O4 to ∼0.9, indicating a decrease in the valence state of Ni. This indicates that Ni2+ is reduced into Ni0 during the H2 reduction process. Meanwhile, the Fe–L3/L2 intensity ratio of the Fe–O agglomerate increased from approximatively 1.8 for the fresh sample to approximatively 1.9 after 3 min of H2 reduction, suggesting an increase in the valence state of Fe. The formation of Fe4+ in the Ni–Fe oxide indicates the synergistic effect of Ni and Fe during the redox cycle. A similar phenomenon has been observed in NiFe oxide electrocatalysts for the oxygen evolution reaction.54 Moreover, Gao et al.55 used TGA measurements, in situ XRD, DFT calculations, and Mössbauer spectroscopy to reveal the presence of surface Fe4+ species and the formation of active peroxide, which are the most likely active species for CL. Furthermore, the formation of Fe4+ on the surface was confirmed by quasi-in situ XPS, as described below. The quantitative analysis results presented in Figure 3C indicate that the Ni@Fe–O agglomerates (points 1–4) had high Ni contents of 46%–69% and Fe/O ratios of approximatively 0.5–0.77 (FeO2–Fe3.08O4), whereas the Fe–O agglomerates (points 5–11) had Fe/O ratios of around 0.5 (FeO2). The uniform distribution of the Fe and O elements in the Fe–O and Ni@Fe–O agglomerates suggests that the concentration gradients of Fe and O along the radial distribution are not significant here.
Figure 3D presents the results of the AIMD simulation of the reduction process. Here, the plots of CN against time indicate that Ni0 and metallic Fe (Fe0) reacted spontaneously to form Ni–Ni, Ni–Fe, and Fe–Fe bonds. This can be understood in terms of the formation energies of the Ni–O and Fe–O sites, which were −4.4 and −0.1 eV, respectively. This suggests that oxygen vacancies are more likely to occur on the Ni–O sites than on the Fe–O sites. Consequently, numerous Ni–Ni bonds form more quickly than Ni–Fe and Fe–Fe bonds, confirming that Ni tends to agglomerate during the release of lattice oxygen. The simulation results for the H2 reduction process also revealed a significant phase separation between the Ni and Fe phases, which is consistent with the abovementioned EELS results.
The quasi-in situ XPS results shown in Figure 3E–H further explain the variations in the chemical states and surface compositions of the NiFe2O4 agglomerates during the reduction process. These results indicate that the distributions of metallic species on the near surface are correlated with those of the oxygen species, clarifying the interface between the migration and transformation of lattice oxygen. The binding energy positions of the various metallic species and oxygen species are marked and described in detail in our previous paper.32 As indicated, Fe4+ appeared on the surfaces of the OC particles, which is consistent with the abovementioned EELS results. The results shown in Figure 3E–H indicate that the Ni in the fresh sample (i.e., at 0 min) was in the form of Ni2+ cations. However, when the OC was reduced by H2, peaks corresponding to the Ni0 species appeared, and the intensity of the Ni0 peaks increased from 0% to 54.93% as the reduction time increased from 0 to 20 min. Meanwhile, the intensity of the Fe2+ peak remained stable at approximatively 40% during 10–50 min of reduction, and an Fe4+ peak was observed, but no Fe0 peak was detected. This indicates that some Ni2+ in the OC was reduced into Ni0, while the overall stability of Fe2+, Fe3+, and Fe4+ on the surface after 5 min was mainly due to the continuous migration of Ni2+ to the surface and its conversion into Ni0. Moreover, owing to the rapid migration, the relative lattice oxygen content on the surface remained unchanged, and the stability was around 80%. In other words, the surface lattice oxygen is continuously consumed by the fuel, and the bulk-phase lattice oxygen rapidly migrates to the surface to refill the oxygen vacancies created there. A dynamic balance is formed to maintain the stability of the surface lattice oxygen content. This is consistent with the abovementioned ETEM and EELS analysis results (EELS revealed insignificant concentration gradients of Fe and O in the radial direction, which is very consistent with a rapid rate of lattice oxygen migration). Additionally, the quasi-in situ Mössbauer spectroscopy56, 57 results revealed that the reduced OC comprised Fe3+ and Fe4+. The fresh OC displayed different peak patterns, including Fe3+, which is a characteristic of NiFe2O4 (Supporting Information).
Figure 4 presents the ETEM–EELS analysis results of the NiFe2O4 agglomerates after 10 min of H2 reduction. Here, the Fe–O agglomerate is shown to have transformed into a dumbbell-shaped Fe0 core (points 1–4) surrounded by an iron oxide shell (points 5–7) (Figure 4A). Note that the HAADF image, ETEM image, and EELS mappings do not show any further significant changes after longer than 10 min of reduction, indicating that the NiFe2O4 OC was completely reduced by around 10 min. This is further confirmed by the supplementary video, which shows the dynamic morphological and structural evolution of the NiFe2O4 agglomerate during reduction times of 10–14 min. Moreover, the locations and elemental distributions at points 8–11 of the Ni@Fe–O agglomerates after 10 min of reduction (Figure 4) are almost identical to those observed after 3 min of reduction (Figure 3). As shown in Figure S1, the L3/L2 intensity ratios of Ni and Fe in the Ni@Fe–O agglomerates were also similar at 3 and 10 min of reduction. This indicates that the Ni agglomerates were completely reduced.
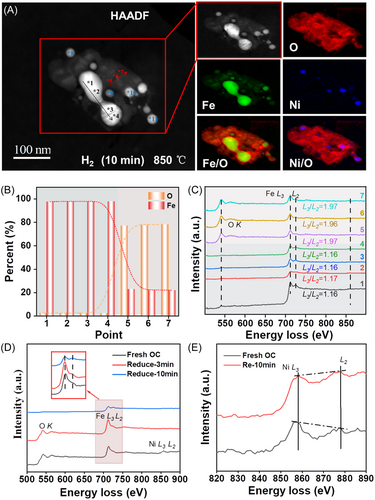
The EELS spectra and quantitative analysis results of points 1–7 shown in Figure 4B,C reveal almost no Ni signal, along with a weak (almost negligible) O signal, at points 1–4. Additionally, the Fe–L3/L2 intensity ratio decreased to around 1.16, which is clearly lower than that of Fe3+ (∼1.80) and can be assigned to Fe0. This suggests that Fe0 was the dominant element in the dumbbell-shaped agglomerate. The quantitative analysis results also revealed an Fe0 content of almost 100%. Conversely, O and Fe signals were observed at points 5–7, while the Fe–L3/L2 intensity ratio increased, close to 1.97, indicating that it had a higher valence than Fe3+. Meanwhile, the Fe/O ratio was about 1:4, which differed from that observed after 3 min of reduction. This implies that although NiFe2O4 was reduced by a 10 min flow of H2, the agglomerate was covered by an oxygen-enriched shell. The above results suggest that the Ni and Fe cations migrate toward the core of the agglomerate, while the lattice oxygen migrates toward the surface during the H2 reduction process. All the ions have fast migration rates. Once oxygen vacancies have formed, the lattice oxygen and Ni and Fe cations move rapidly to reach a new equilibrium (i.e., until the concentration gradients have disappeared), and the interfacial reaction with the reducing agent on the OC surface becomes the rate-determining step of the reduction process. Consequently, the concentration gradients cannot be observed in the EELS spot-scanning spectra. Thus, as shown in Figure 4D,E, the Ni2+ ions were reduced into Ni0, while the Fe3+ ions were converted into Fe0 and high-valence Fe ions upon 10 min of H2 reduction. The dumbbell-shaped Fe0 agglomerate was located in the core of the particle, while the Ni0 agglomerates were scattered on the side of the Fe0 core. Consequently, the Fe0 and Ni0 agglomerates were covered by an oxygen-enriched shell with high-valence Fe ions, and this shell was negligibly reduced by hydrogen in the later stages.
3.3 Conversion of CO2 into CO (lattice oxygen recovery of OCs)
Figure 5 presents the results of the subsequent in situ oxidation of the completely reduced NiFe2O4 OC under a CO2 flow for 30 s. Here, the overall shape of the agglomerate is shown to be similar to that observed in the final reduction state, but the Ni distribution began to change, such that the Ni@Fe–O agglomerates split into about eight agglomerates surrounded by high-valence Fe oxides. The chemical states and distributions of the Ni–Fe–O along the red line from the edge to the dumbbell-shaped Fe0 agglomerate in Figure 5A (i.e., points 4–7) are revealed by the EELS spot-scanning spectra in Figure 5B. The lack of any change in the valence state of Ni demonstrates that Ni was not oxidized by CO2, as further revealed by the EELS spot-scanning spectra in Figure S2 (i.e., points 1–3). Meanwhile, the Fe L3/L2 intensity ratio of the Fe–O agglomerate remained stable at approximately 1.97 (Figure 5B), indicating that the valence state of Fe remained unchanged. Additionally, the O signal at point 8 was significantly stronger than that at point 9. Moreover, at point 8, the L3/L2 intensity ratio of Fe increased to approximately 1.18, which was higher than that of Fe0 (point 9). This indicates that some Fe0 at the edge of the Fe0 core was oxidized by CO2.
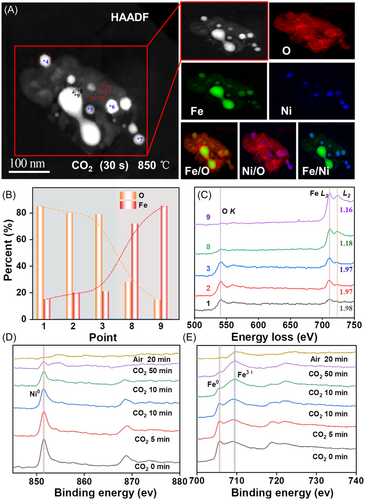
The results presented in Figure 5C reveal the presence of Fe and O concentration gradients going from the edge to the core of the dumbbell-shaped Fe0 agglomerate (i.e., points 8–9). Specifically, the Fe content decreased from 85% at point 9% to 72% at point 8, while the O content increased from 15% to 28%. Thus, changes in the oxygen concentrations and valence states were observed at the edge of the Fe0 agglomerate (points 8–9), while no such changes were observed in the Fe4+ oxides (points 1–3). This suggests that the Fe4+ oxides provide an active reaction interface and that the O atoms rapidly migrate inward from this interface. However, when the O atoms migrate into the Fe0 agglomerate (points 8–9), this agglomerate is oxidized slowly owing to the close arrangement of the Fe atoms.
The oxidation process is further revealed by the XPS results presented in Figure 5D,E. Specifically, the Ni signal near the surface of the sample gradually disappeared during the CO2/lab air oxidation process. Similarly, the near-surface Fe0 signal gradually disappeared, while the signal due to Fe3+ gradually increased. During the oxidation process, CO2 is first adsorbed onto the surface of the OC and is continuously split to form negative oxygen ions. Hence, the Fe atoms migrate outward and combine with the O ions to form a surface oxide, enabling the valence of Fe on the surface to gradually increase. Conversely, Ni0 migrates inward and combines with the remaining Fe0 to form Fe–Ni alloys. These results are consistent with the abovementioned EELS and ETEM results.
Contrarily, the morphology and elemental distributions in the NiFe2O4 OC changed significantly upon 14 min of CO2 oxidation (Figure 6A). Specifically, the dumbbell-shaped Fe-enriched agglomerate that is shown in Figure 6A transformed into an elliptical core, and most of the Ni fused into this core. Notably, the Ni@Fe–O agglomerate depicted in the lower right corner of Figure 6A is almost unfused with the Fe–O agglomerate and is relatively independent of its main body, whereas the other Ni@Fe–O agglomerates are surrounded and interconnected by high-valence Fe oxides. This suggests that Fe4+ oxides may provide a necessary channel for the fusion of Ni@Fe–O and Fe agglomerates.
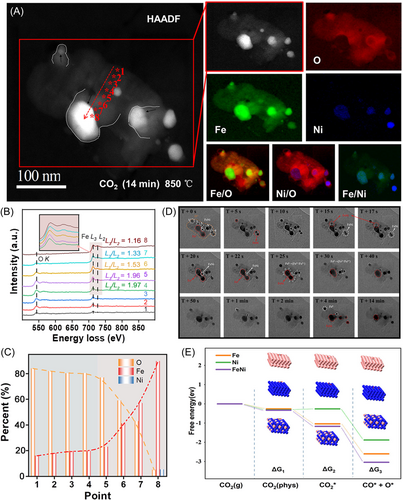
Figure 6B presents the EELS spectra obtained along the red arrow in Figure 6A (i.e., points 1–8). In this case, the Fe–L3/L2 ratio decreased gradually from approximately 1.97 at point 1 to approximately 1.16 at point 8, indicating a decrease in the valence state of Fe from the surface to the core. Moreover, the quantitative analysis results presented in Figure 6C indicate that the Fe and O concentration gradients became more significant as they moved from the edge to the core of the agglomerate (points 4–8). Specifically, the Fe content increased from 19.6% to 89.9%, while the O content decreased from 80.4% to 5%. Since the Fe atoms in the Fe0 agglomerate are closely arranged, the O ions must overcome a high resistance to enter the lattice. Hence, a high exogenous oxygen potential is required to fill the lattice with oxygen, and a significant lattice oxygen concentration gradient can be observed in the agglomerates. This phenomenon further proves that Fe migrates toward the surface of the agglomerate and that O atoms migrate toward the core.
The time evolution of the active metals (Fe and Ni) during the CO2 oxidation step is illustrated in detail in Figure 6D, where significant changes in the ETEM images can be observed. Specifically, the dumbbell-shaped iron-enriched core accumulated gradually as an elliptical agglomerate, and the scattered multiple Fe and Ni agglomerates gradually recombined into four Fe/Ni-enriched agglomerates. Consequently, if the oxidation is controlled by the outward diffusion of metallic cations, it can be assumed that a hollow particle structure will eventually form. Hence, the observed results strongly suggest that the oxidation step is controlled by the inward diffusion of lattice oxygen. For example, at 30 s of oxidation (T + 30 s), the ETEM morphology can be divided into the following three typical regions: (i) an Fe–Ni alloy (white circles 1–6), (ii) Fe0 (red circle), and (iii) oxygen species combined with Fe atoms (yellow circle). Notably, the shape of region (iii) shows slight variations throughout the entire CO2-to-CO conversion process, indicating that there was no build-up of carbon on the surface and that the combination of the oxygen species with the Fe cation was very stable. At the same time, two small nuclei of Fe–Ni alloys with diameters of approximately 2 nm (white circle 6) can be observed. At increased oxidation times of 45–47 s, these nuclei underwent rapid growth via atomic migration and coalescence under the CO2 atmosphere but then shrank significantly at 50–55 s of oxidation. This indicates that the coalescence of the Fe–Ni alloy and the oxidation of Fe0 occur almost simultaneously. Similarly, the small Fe–Ni nuclei indicated by white circle 2 are shown to migrate toward and coalesce with Fe0 (red circle) at 45–47 s of oxidation. Another two such Fe–Ni nuclei (white circles 3 and 5) migrate toward Fe0 and coalesce at 50–52 and 70–80 s of oxidation, respectively. Further, owing to the migration of Ni0, the shape of the Fe–Ni alloy indicated by white circle 1 changed from hexagonal with sharp corners to round Fe0 at 5 min of oxidation, while the dumbbell-shaped Fe0 was converted into an Fe–Ni alloy and underwent constant contraction. These results demonstrate that various metals coalesce via migration as the lattice oxygen migrates inward, confirming the interaction between Fe and Ni reported in previous work. In the previous work, 1 g of reduced NiFe2O4 was found to produce CO, which was twice that obtained using 1 g of reduced NiO–Fe2O3 (a 1:1 mixture of NiO and Fe2O3) mixed oxides. These results indicate that some of the Fe0 and Ni0 phases combine to form a new Fe–Ni alloy phase, thereby providing a synergistic effect that can improve the oxidizability of the reduced OC. Notably, the distance between the two small Fe–Ni nuclei indicated by white circle 4 gradually increased due to the increase in the amount of Fe oxides between them. The direction of diffusion during the oxidation of the Fe0 is indicated by the red arrow in the T + 5 min image. Finally, four other small Fe–Ni nuclei were formed, along with two soon-to-disappear Fe0 nuclei (white circles 1 and 3), with the outermost layer wrapped by the Fe oxide.
The calculated free energies of dissociation of CO2 to CO on the Fe(111), Ni(111), and Fe–Ni(111) surfaces are presented in Figure 6E to explain the excellent reaction performance of the fully reduced OC during CO2 oxidation and to determine the dynamic migration law of the metal atoms. These results indicate that CO2 is most easily split on the surface of the Fe–Ni alloy which has a significantly lower reaction energy barrier than Fe and Ni. Thus, when both Fe0 and Ni0 are present in the OC, these atoms migrate via the pathway with the lowest reaction energy barrier during the continuous CO2 oxidation process. In other words, the Fe0 and Ni0 atoms spontaneously form Fe–Ni alloys to lower the reaction energy barrier. This result is consistent with the above observations from the time-sequential ETEM images.
3.4 Air oxidation (regeneration of OCs)
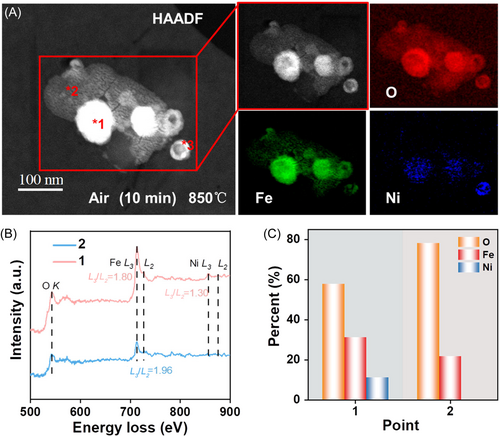
The EELS mapping images in Figure 7A show the elemental distribution of the completely oxidized OC after 10 min of exposure to air. Here, the spherical Fe and Fe–Ni alloy is shown to have fully oxidized to form a core structure. This is due to the Kirkendall effect, implying that the reactions were dominated by the outward diffusion of Fe and Ni rather than the inward migration of lattice oxygen. Thus, the Fe–Ni alloy particles formed an oxidized product with the core structure wherein Fe, Ni, and O were uniformly distributed and connected to form a whole. The local chemical states of the core structure and the outer layer are further revealed by the EELS analysis results presented in Figure 7B, which were obtained from the two beam positions labeled in red in Figure 7A. It can be observed that the L3/L2 intensity ratio of Fe in the core structure (point 1) was stable at around 1.8, which was the same as that of the fresh OC and corresponds to Fe3+. Similarly, the L3/L2 intensity ratio of Ni was the same as that of the fresh OC (∼1.30), which corresponds to Ni2+. Furthermore, the quantitative analysis results presented in Figure 7C indicate that the Fe/Ni/O ratio in the core structure was approximately 5.2:2.85:1. This demonstrates that the O, Fe, and Ni contents are consistent with the theoretical elemental ratio in NiFe2O4 + Fe2O2.83. Meanwhile, only Fe and O were detected in the outer layer (point 2), probably representing Fe2O3 and Fe4+, respectively.
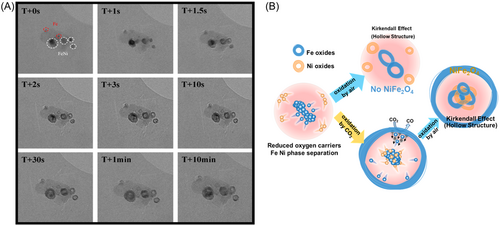
Finally, the oxidation process of the spherical Fe and Fe–Ni alloy under the air atmosphere is further revealed by the time-sequenced transmission electron microscopy images in Figure 8A, which show that the reaction rate was very rapid, consequently enabling the reaction to be almost completed within 2 s. It is worth noting that point 3 in the lower right corner only shows a small amount of Fe, which is almost entirely in the form of NiO (as shown in Figure S3). Thus, the fully oxidized OC comprised mainly NiFe2O4 and Fe2O3. Furthermore, Fe0 and Ni0 were segregated in the completely reduced OC. If the weak oxidant (CO2) is removed and the air is introduced directly, the Fe0 and Ni0 atoms will migrate outward and come into contact to form NiFe2O4 owing to the Kirkendall effect. However, because the extent of this outward migration is limited in the case of strong oxidation, numerous Fe and Ni atoms are unable to come into contact with each other, making it impossible to recover the NiFe2O4 structure (as shown in Figure 8B). Thus, the weak oxidation process not only converts CO2 into CO but may also help to inhibit the phase separation of the OC by promoting the formation of Fe–Ni alloys via the migration of metallic atoms. In conclusion, the use of a reasonably weak oxidizing gas instead of a simple air oxidation process prevents the phase segregation of OCs and maintains the structural stability and electronic effects between Fe and Ni (bimetallic synergy).
3.5 Discussion on the deactivation of NiFe2O4 during the redox cycle
According to the above discussion, the oxygen migration rate directly determines the migratory diffusion path of the metal atoms, particularly during the oxidation process. Objectively, the difference in the oxygen migration rate is due to the different oxidizing abilities of the oxidizing gases (CO2 vs. air). Gradual lattice oxygen migration leads to the inward migration of Ni and the formation of Fe–Ni alloys, while rapid lattice oxygen migration leads to the outward migration of Fe and Ni and the formation of hollow structures (as shown in Figure 9A). We further verified this conclusion by comparing the results of the cycling experiments. We discovered that using a weak oxidizing agent to slowly restore the lattice oxygen of the OC enabled the OC to maintain enhanced reactivity with a relatively high CO yield after 10 cycles. Additionally, the ratio of H2/CO in the syngas produced from the partial oxidation of CH4 was consistently maintained at 2–3 (as shown in Figure 9B,C).
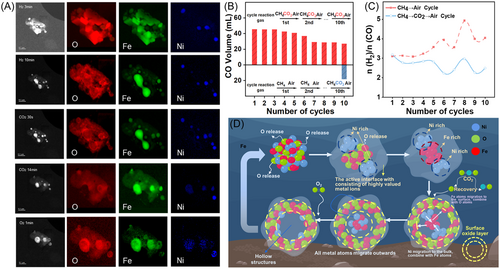
Figure 9D shows the proposed migration mechanism of lattice oxygen in the NiFe2O4 spinel OCs during the CL process. During the reduction process, the Ni–O bond is broken to release lattice oxygen and Ni2+, which migrate toward the surface where Ni2+ is reduced into Ni0 and tends to agglomerate. Subsequently, the outward migration of lattice oxygen causes the iron oxides to shrink to form iron nuclei. Meanwhile, Fe3+ is converted into a high-valence state before being reduced into Fe0, and the surface lattice oxygen is continuously consumed by the fuel until all the lattice oxygen has been released to form the final reduced product (i.e., Fe0 and Ni0 with almost no Fe–Ni alloy). During the subsequent oxidation process, oxygen continuously migrates from the surface to the bulk to refill the oxygen vacancies and fully recover the lattice oxygen that is released during reduction. Meanwhile, as the Fe oxide forms on the surface, Fe0 and Ni0 tend to aggregate to form Fe–Ni alloys. Finally, the spherical Fe and Fe–Ni alloys are fully oxidized by air to form a core/shell structure that consists of a mixture of NiFe2O4 and Fe2O3.
4 CONCLUSIONS AND PERSPECTIVES
Our multiscale studies revealed that the chemical reaction interface is fixed on the surface of OC particles during the release/uptake of lattice oxygen (i.e., during the reduction/oxidation process). A mechanistic analysis of the reduction process revealed that the release of lattice oxygen upon Ni–O bond breakage is accompanied by the migration of Ni2+ toward the surface, where it is reduced into Ni0 and tends to agglomerate. Subsequently, the outward migration of lattice oxygen causes the iron oxides to shrink to form iron nuclei. However, no oxygen concentration gradient could be observed owing to the rapid migration of bulk lattice oxygen to the surface. The experimental results indicated that Fe3+ is converted into a high-valence state before being reduced into Fe0. Meanwhile, the surface lattice oxygen is continuously consumed by the fuel until all the lattice oxygen has been released to form the final reduced product. This product comprises Fe0 and Ni0, with almost no Fe–Ni alloy. Regarding the subsequent oxidation process in the presence of CO2, oxygen continuously migrates from the surface to the bulk, thereby refilling the oxygen vacancies and fully recovering the lattice oxygen that is released during reduction. Meanwhile, as the Fe oxide forms on the surface, Fe0 and Ni0 tend to aggregate to form Fe–Ni alloys. Finally, the spherical Fe and Fe–Ni alloy particles are fully oxidized by air to form a core/shell structure that consists of a mixture of NiFe2O4 and Fe2O3. This indicates that the migration paths of metal atoms depend on the oxygen-transfer rates. These findings highlight the importance of regulating the release–recovery rate of lattice oxygen to maintain the structures and reactivity of OCs.
In the future, the migration of lattice oxygen and the spatial evolution of the active components in the OC can be controlled using several approaches. For example, an inert oxide can be wrapped on the surface of the OC. Atoms in inert oxides do not diffuse during redox processes, enabling the inert shells to prevent the metal atoms in the OC from diffusing outward. Moreover, an oxidizing medium with an appropriate oxidizing capacity can be chosen. The ion migration processes of OCs under different oxidizing gases (i.e., strong or weak oxidizing gases) vary dramatically. A suitable oxidizing gas prevents the Kirkendall effect and resists the phase separation caused by the migration of metal atoms during the oxidation process. Our work unveils how Fe–Ni bimetallic OCs evolve structurally and chemically during CL conversion, which not only advances the understanding of the interaction between Fe and Ni but also provides insights into the design of efficient OCs for the thermochemical CO2 reduction reaction and CL conversion.
ACKNOWLEDGMENTS
The authors gratefully acknowledge the financial support from the National Natural Science Foundation of China (Grant Nos. 52076209, 52006224, 52106285, 22179027), the Foundation and Applied Foundation Research of Guangdong Province (Grant No. 2022B1515020045), the Guangxi Natural Science Foundation (Grant No. 2021GXNSFAA075036), and the Young Talent Support Project of Guangzhou Association for Science and Technology (Grant No. QT-2023-042). Thanks are due to Dr. Dongsheng He of Southern University of Science and Technology and Peili Chen of Guangzhou Institute of Energy Conversion for assistance with the experiments.
CONFLICT OF INTEREST STATEMENT
The authors declare that there are no conflicts of interests.


