Modeling Iron Ore Breakage with the Tavares Model and DEM Simulation of a Laboratory Jaw Crusher
Abstract
Selection of jaw crushers to be used in the first size reduction stages can be a challenge in the design of comminution circuits, given the impossibility of conducting tests at full scale and the limited representativity of small-scale tests. An alternative that has emerged is advanced simulation using the discrete element method (DEM). However, it requires detailed testing with very coarse particles, which can be challenging. The work presents detailed characterizations of particle shapes, breakage model, and contact parameters for simulations in Rocky DEM of an iron ore from Brazil. Validation consisted in comparing predictions to laboratory jaw crushing test results. Good agreement was found between measured and predicted throughputs, whereas simulations marginally underpredicted power and some overpredicted product fineness.
1 Introduction
Jaw crushers are widely used in the first stages of the comminution processes. Their simplicity and versatility result in their use in applications in mineral-processing plants [1, 2], quarry sites [3, 4], and demolition waste–recycling plants [5, 6].
Several studies have dealt with the analysis of the machine throughput [3], energy consumption [5], product quality [7, 8], and liner wear [9-11], which are key aspects of jaw crusher operation. Other studies have attempted to describe quantitatively the operation through either empirical relationships [12] or phenomenological models. These later attempted to describe separately the capture probability and particle breakage [13, 14] but are naturally limited because they describe the average response of the ore/rock to the process, with important simplifications.
Important advances have been made in the last couple of decades in the simulation of crushing processes in general [15] and of jaw crushing in particular [16-20], using the discrete element method (DEM). DEM allows us to account, in great detail, for the geometry of the machine, the motion of the swing jaw, and the characteristics of the particulate material. Indeed, different approaches have been used to simulate jaw crushers in DEM, some of which use the bonded particle model [16-18]. Alternatively, some authors [19, 20] preferred to use the particle replacement model with spheres to simulate breakage and flow of particles inside the crushing chamber, predicting throughput, energy consumption, and product size distribution of jaw crushers operating in the laboratory and at industrial scale. Particle replacement models have the advantages of greater control of fragment size distribution and lower computational demand [21]. In either case, data from single-particle breakage are required to properly describe the material response.
Data on breakage response of ores and rocks at very coarse sizes are indispensable for simulation of coarse comminution in DEM. However, access to samples at coarse sizes is not straightforward, and appropriate devices that may be used to measure their characteristics are not easily available. The result is that very few published studies present results on the breakage response of rocks at and above the 100 mm size range. For instance, fracture energies of iron ore particles [22] and of quarry rocks [23] were measured under impact conditions, whereas the breakage response of selected rocks was analyzed under slow compression by Unland and Szczelina [24].
The present work describes the methodology for material breakage characterization and DEM contact parameter calibration of an itabirite iron ore, using realistic 3D particle shape models. The model parameters were then validated by comparing simulations of a lab-scale jaw crusher using Rocky DEM software to experiments.
2 Methodology
3 Experimental Procedures
Samples from six mining faces of an iron ore mine operating in the Quadrilátero Ferrífero of Minas Gerais (Brazil) have been collected. They are classified as Supercompact Itabirite, which is a banded iron ore formation that is characterized by comparatively higher competence than other itabirites [25].
These samples, totaling over 3 t and containing particles as coarse as 450 mm, were received for testing. All tests were carried out separately for each of the six samples, but data were compiled into a single set for modeling parameters for simulation.
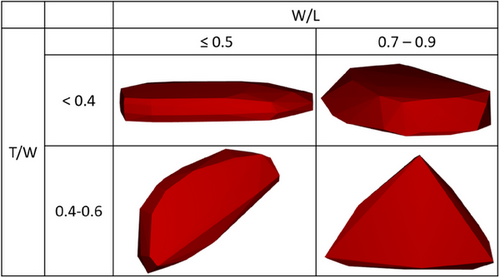
At first, they were characterized regarding their sizes and characteristic dimensions using Digital image analysis software (Fig. 1), in which L was the length, W was the width, and T was the thickness of the particles. Such data were collected from over 50 particles coarser than 100 mm and served as the basis for creating polyhedral metaparticles contained in 16 classes spanning different aspect ratios (W/L and T/W), described in detail elsewhere [26].

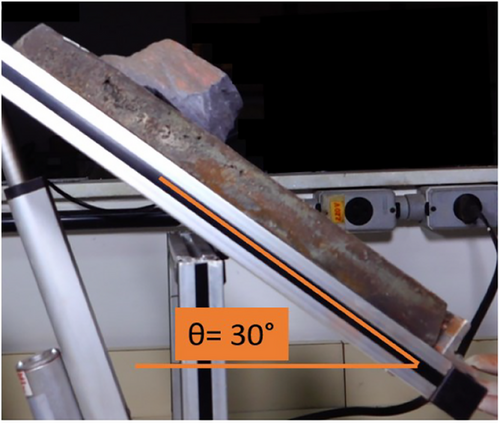
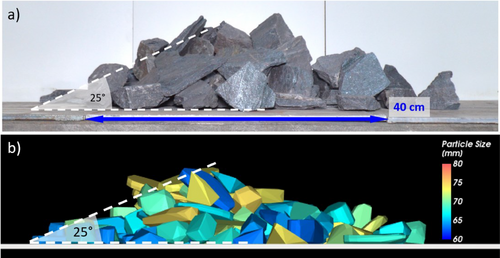
An indirect approach was used at first to calibrate the contact parameters, through which bulk material properties were measured and the simulation parameters were fitted until the output of corresponding DEM simulations matched the measurement results. Repose angle tests were carried out in triplicate with 31.3 kg of material, in addition to inclined angle tests, both with particles contained in the 75–53 mm size range. Fig. 2 shows a test of a single particle sliding on an inclined surface represented by the fixed jaw of the laboratory crusher.
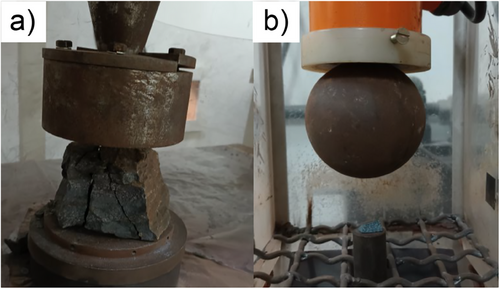
Following the non-destructive tests, particles were then submitted to single-particle breakage experiments. Several tests were conducted to estimate the breakage parameters required for the simulation using the Tavares Breakage Model in Rocky DEM (Fig. 3). Tab. 1 summarizes the tests, with the corresponding particle size ranges and deformation rates. Additional details on the test procedures may be found elsewhere [27, 28]. All tests were carried out separately for each of the six ore samples, and data were compiled to represent the average ore response for model fitting.
| Test | Size range [mm] | Deformation rates [m s−1] | Device |
|---|---|---|---|
| Drop test | 450–212 | 8.9–12.4 | Drop test apparatus |
| Slow compression | 212–75.0 | 1.7 × 10⁻⁴ | Shimadzu® 1000 kN press |
| 37.5–31.5 | 1.7 × 10⁻⁴ | Instron® Model 33R5567 press | |
| Impact work index | 75.0–50.0 | 0.5–3.5 | Twin pendulum device |
| Drop weight test | 63.0–13.3 | 2.0–6.0 | Drop weight tester |
| Repeated impact test | 45.0–37.5 | 1.5–1.9 | 19-mm impact load cell (ILC) |
| Double compression | 19.0–4.75 | 1.0–1.5 | 19-mm impact load cell (ILC) |
Additional tests were performed to characterize the response of each of the six samples to mechanical size reduction, namely the Los Angeles test [28] and the Bond abrasion index test [29], besides measurement of specific gravity using the Archimedes method.
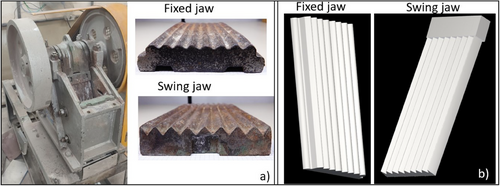
Crushing tests were carried out using a laboratory Denver scale jaw crusher (Fig. 4). The operating parameters used in the tests are listed in Tab. 2. Tests were run for each of the six samples, with particles contained in three different size ranges: 90–75, 75–63, and 53–37.5 mm. Batches containing 10–20 kg were crushed in each test.
| Parameter | Value | Unit |
|---|---|---|
| Feed opening | 155 × 120 | mm × mm |
| Closed side setting | 25 | Mm |
| Stroke | 10 | Mm |
| Frequency | 6 | Hz |
| Nominal motor power | 3.73 | kW |
Power consumed by the jaw crusher during the test was measured using the DMI P100 power analyzer (ISO Telecom) and was subtracted from the no-load power. This no-load power was estimated at 0.54 kW. Throughput was measured using a load cell coupled to an Arduino UNO board, which acquired the cumulative mass of the crushed material as a function of the test time. Product particle size distributions were measured using sieves following a Tyler series. Deformation rates experienced by particles varied along the crushing chamber, with the maximum value of 0.12 m s−1 at the discharge. This value was well within the range of values tested through the experiments in the laboratory (Tab. 1).
3.1 Simulations
With the objective of validating the DEM contact and the breakage model parameters of the iron ore particles and assessing the capability of the simulation to predict throughput, power, and product size of the laboratory jaw crusher, simulations using the Rocky DEM® software version 2024 were performed in quadruplicate. A workstation equipped with an Intel® Core i7-4590-3 GHz, 16 Gb of RAM was used. A CAD model of the crusher was built, with liners illustrated in Fig. 4b. Motion of the swing jaw was programmed considering the combination of two translation motions, thus being able to mimic the laboratory crusher operation.
The contact model used to calculate normal forces was the hysteretic linear spring model, whereas the tangential forces were calculated using the linear spring Coulomb model [30].
The size of each particle is determined in Rocky DEM according to the largest dimension of the particle and its second largest perpendicular dimension [33]. Particle size will be based upon the dimensions of a square hole that is just large enough for the particle to pass through. Besides the explicitly resolved particles, a post-processing script that used an approach that is analogous to the one described elsewhere for spherical particles [37] has been used to extend the size distribution below the minimum resolved particle size.
4 Results and Discussion
4.1 Standard Tests and Variability Analysis
A preliminary analysis was carried out of the results of the standard tests from each of the six itabirite samples, and a summary is presented in Tab. 3. It shows that the iron ore samples presented, on average, moderate values of impact work index and point-load strength, with medium-to-high values of impact parameter A × b and LA abrasion fragmentation index. Their abrasiveness, measured using the Ai bond value, was also moderate to high [28]. Comparative analysis of variability of the data shows that the samples presented low variability in specific gravity but moderate variability in Bond work index, point-load strength, and LA abrasion index. Medium-to-large variability was found for Bond abrasiveness and high variability for the A × b impact response.
| Parameter | Mean | Standard deviation | Coefficient of variation [%] |
|---|---|---|---|
| Specific gravity [kg m−3] | 3262 | 172 | 5 |
| Bond impact work index [kWh t−1] | 10.0 | 1.3 | 13 |
| Los Angeles abrasion index [%] | 49.0 | 8.6 | 18 |
| Point-load strength–Is50 [MPa] | 14.3 | 2.7 | 19 |
| A × b DWT [%.t kWh−1] | 168 | 104 | 62 |
| Bond abrasiveness Ai [g] | 0.296 | 0.090 | 31 |
4.2 Material Model and Contact Parameter Estimation
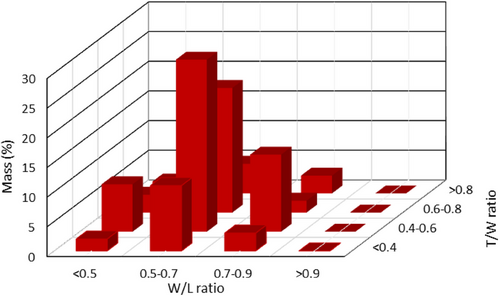
Based on the aspect ratios measured and the 16 groups of virtual polyhedral particles created as part of a previous study [26], the distribution presented in Fig. 5 was obtained. The high flakiness of the iron ore is evident from the large proportion of particles with W/L ratio below 0.7 (nearly 80 %). Fig. 6 shows examples of 3D modeled particles for some of the shape classes represented in Fig. 5.
From the point-load tests, the Young's modulus of the iron ore was estimated using the approach proposed elsewhere [31], considering literature values of Poisson's ratios (Tab. 4).
| Iron ore | Steel | |
|---|---|---|
| Density [kg m−3] | 3262 | 7850 |
| Young's modulus [GPa] | 7.7 | 160 |
| Poisson's ratio [–] | 0.30 | 0.25 |
Measurement of the angle of repose on a steel surface and the sliding angle of a jaw surface (Fig. 2) resulted in the values of 25.1° ± 5.8° and 30.9° ± 3.1°, respectively. From this sliding angle, the coefficient of static friction can be estimated at about 0.6 [32]. With particles modeled using the appropriate shapes (Fig. 5), parameters of the contact model were selected by trial and error (Tab. 5). A snapshot of the simulation of the angle of repose test is shown in Fig. 7, which resulted in an angle of repose of 25.1° ± 1.1°, which agrees very well with the experiments. However, the coefficient of friction that needed to be fitted to the data (Tab. 5) was about 46 % lower than the measured in the sliding test. This may be attributed, at least partially, to the significant vibrations during crusher operation, which contrast with the nearly static flow conditions in the angle of repose test.
| Coefficient | Steel-particle | Particle-particle |
|---|---|---|
| Friction | 0.325 (0.138)a) | 0.400 |
| Restitution | 0.300 | 0.300 |
- a) Later modified in order to reach better agreement with jaw crusher test results.
4.3 Breakage Model Parameter Estimation
In Rocky DEM, the Tavares Breakage Model has been implemented considering size-independent values of variance of the distribution of particle fracture energies [31, 33]. Fig. 8a shows that data for several sizes of the composed iron ore sample approximately collapse into a single curve. This curve is characterized by the absence of an upper truncation (resulting in a selection of the nominally high ratio Emax/E50 of 100) and by a constant variance σ2. Fig. 8b shows the measured results of the median particle fracture energies (E50) as a function of particle size and the model fitted from the estimated values of parameters E∞, do, and ϕ [31]. It shows that, in spite of the differences in deformation rates used in the tests, the data approximately follow a single general trend.
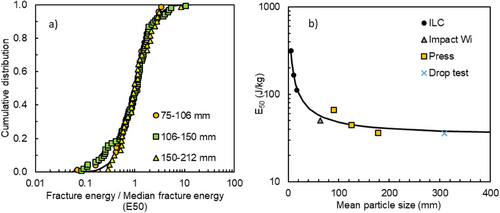
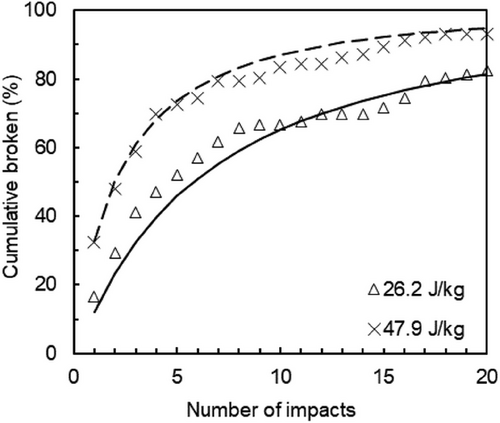
Fig. 9 shows the fitted distribution of particle fracture energies and results from the repeated impact tests used to estimate the parameter that controls weakening by repeated stressing events, that is, the coefficient of damage accumulation γ [34]. It shows that the fitted value of γ resulted in very good agreement of the model to experiments.
The median fracture energy value for particles in the size range 75–50 mm presented in Fig. 8b was back-calculated from data from impact work index tests using the approach described elsewhere [35], considering values of coefficient of damage accumulation (γ) and the variability in data for coarser sizes (σ2). A comparison between all data from impact work index tests and the model is shown in Fig. 10, which demonstrates good agreement.
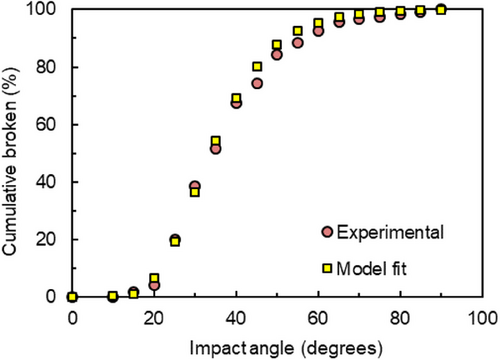
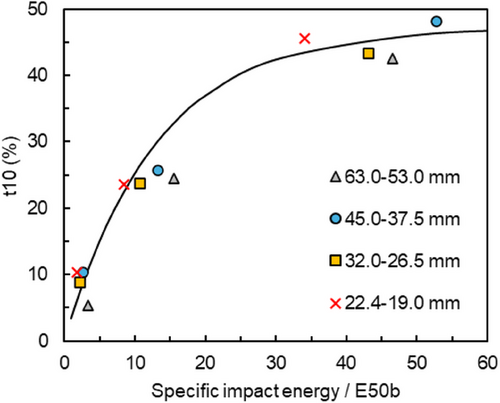
Fig. 11 compares experimental values of t10 from drop weight tests as a function of the normalized impact energy to the model fit. From the fitted parameters, the product A × b′ was equal to 3.61. Comparison to other materials [36] demonstrates a very high susceptibility to secondary breakage of the iron ore samples analyzed.
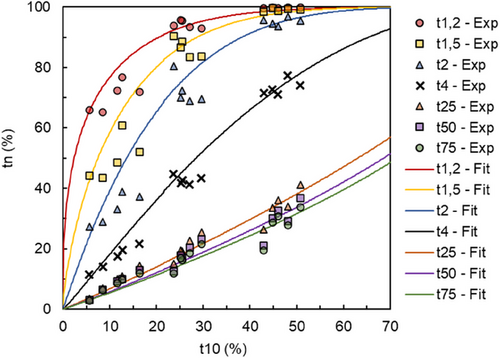
As demonstrated in earlier work that data for iron ores often do not conform to the general fragmentation pattern observed for most rocks and ores [37], it was necessary to examine this relationship for the Supercompact Itabirite. Data for the six samples are shown in Fig. 12, where the relationship between the various tn and t10 values is modeled. In spite of the large scatter in the data, parameters of the incomplete beta function [36] provided a reasonable fit to the data.
The list of Tavares Breakage Model, as well as simulation, parameters used in the simulations is presented in Tab. 6. Values of minimum absolute size and minimum size ratio were selected considering those that were found to be optimal in a previous study [38].
| Submodel | Parameter and unit | Value | |
|---|---|---|---|
| Fracture energy distribution | σ [–] | 0.552 | |
| Emax/E50 [–] | 100 | ||
| Size-scale model | E∞ [J kg−1] | 32.5 | |
| d0 [mm] | 46.1 | ||
| Φ [–] | 0.967 | ||
| Weakening | γ [–] | 4.0 | |
| Body-breakage distribution | A [%] | 47.0 | |
| b′ [–] | 0.0768 | ||
| α1.2/β1.2 | 0.345 | 4.666 | |
| α1.5/β1.5 | 0.684 | 5.215 | |
| α2/β2 | 1.001 | 4.752 | |
| α4/β4 | 1.086 | 2.264 | |
| α25/β25 | 1.024 | 0.707 | |
| α50/β50 | 1.028 | 0.609 | |
| α75/β75 | 1.017 | 0.555 | |
| DEM simulation | Emin [J kg−1] | 1 | |
| Minimum absolute size [mm]a) |
3.30 (90–75 mm) 2.75 (75–63 mm) 1.78 (53–37.5 mm) |
||
| Minimum size ratio [–] | 0.2 (1/5) | ||
| Minimum volume fraction disabling [–] | 0.5 | ||
- a) 1/25th of the feed top size used in each crusher simulation.
4.4 Crushing Simulations
Preliminary simulations of the laboratory-scale jaw crusher fed with material contained in the size range 75–63 mm were conducted using parameters from Tabs. 4–6. However, it was evident that events of slippage of particles upwards when nipped between jaws, observed in the experiments, did not occur in the simulations, resulting in significantly higher throughput in the latter. As such, the particle-steel coefficient of friction was further reduced from 0.325 to 0.138 (Tab. 5). This lower value, however, resulted in a predicted value of angle of repose of only 13.0°, which is significantly lower than the measured value (Fig. 7a).
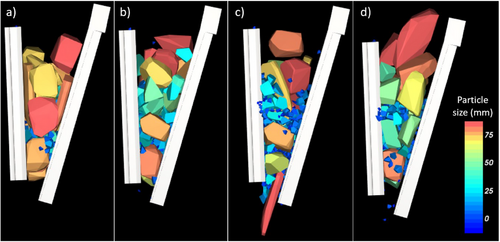
Fig. 13 illustrates results from a laboratory-scale jaw crusher simulation at different times, with material contained in the range of 75–63 mm. It clearly shows the different shapes of the particles fed to the simulations and those generated because of breakage. In the simulation it was evident that, as they entered the crushing chamber and were compressed between the swing and fixed jaws, particles did not break immediately, sliding until they were effectively captured and broke, a behavior that was already observed in the experiments.
Comparisons are first presented of the variation, as a function of time, of throughput and power. Fig. 14 compares experimental and simulation results for throughput, and comparisons for power are presented in Fig. 15. In analogy to the experimental tests, the DEM simulations show variation in performance when the simulations are repeated. This is explained by the variability in both the fracture energies and the shape of the particles contained in the jaw crusher feed in the DEM simulations, the latter influencing the probability of each particle being captured between the jaws. Such variability in crusher performance is comparable in simulations and experiments, although marginally higher in the simulations involving the coarser size ranges. Fluctuations in the experiments and simulations overlap in the case of throughput for the coarser classes, whereas net powers predicted in the simulations were distinctly lower than those measured in the experiments for all sizes. This lower power in the simulations when compared to experiments was also observed in laboratory cone crusher simulations [39] and may be partially attributed to an additional component of friction that appears in the crusher operation during loading, which is not properly accounted for by subtracting power during operation by the no-load power. The predicted throughput results are reasonably consistent for the coarser sizes; however, for the finer sizes, predictions significantly overestimate the values, likely caused by the low value of the steel-particle coefficient of friction selected and the shape and size of the particles, which allow them to accelerate and exit the crushing chamber at higher velocities.


Fig. 16 compares the measured and predicted product size distributions, including the post-processing addition of the fine fraction (below the minimum absolute sizes in the simulations) that is implicit in the simulation [37], which is available in Rocky DEM version 2024. The error bars in the experiments represent data from each of the six individual samples, indicating the variability in the data, already evident in Tab. 3. A reasonably good agreement of the simulations to the experimental data is observed, although simulations slightly overestimated the fineness of the measured product for the coarser feed sizes. However, the high flakiness of the experimental product, with as much as 45 % of material coarser than the open-side setting (35 mm), was not reproduced in the simulations, in which the Voronoi tessellation approach does not allow the control of fragment shapes, which are likely flakier than predicted. In the case of the finer feed (53–37.5 mm), good agreement was found, as limited size reduction occurred of the particles in the crusher. In addition, good agreement was found at the finer sizes (<4 mm) for the coarser sizes, attesting to the validity of the novel post-processing approach in including the unresolved fines. In the case of the finer feed size, the smaller proportion of fines predicted is not surprising, as most material was able to leave the crushing chamber without size reduction. Indeed, at least part of the fines observed in the experiments resulted from surface breakage, which is not yet explicitly taken into account in the model implemented in Rocky.

The predicted values of throughput, power, specific energy, product size distribution, and reduction ratio are then summarized from an average of four simulations of the crusher operating for 40 s, whereas those from the experiments are from the average of the six samples in Tab. 7. It shows generally good agreement, with the exception of power and specific energy for all size ranges and throughput for the 53–37.5 mm feed size range. Nevertheless, both simulations and experiments confirmed the higher throughput for the finer size range and the drop in reduction ratio as feed size reduced.
| Metric | 90–75 mm | 75–63 mm | 53–37.5 mm | |||
|---|---|---|---|---|---|---|
| Exp. | Sim. | Exp. | Sim. | Exp. | Sim. | |
| Throughput [t h−1] | 1.39 ± 0.46 | 1.82 ± 0.92 | 1.27 ± 0.10 | 1.56 ± 0.64 | 2.11 ± 0.50 | 6.80 ± 0.40 |
| Net power [kW] | 0.45 ± 0.23 | 0.29 ± 0.24 | 0.48 ± 0.23 | 0.27 ± 0.22 | 0.37 ± 0.21 | 0.15 ± 0.14 |
| Specific energy [kWh t−1] | 0.32 ± 0.09 | 0.22 ± 0.053 | 0.38 ± 0.22 | 0.18 ± 0.18 | 0.18 ± 0.09 | 0.06 ± 0.04 |
| F80 [mm] | 87.0 | 87.0 | 72.6 | 72.6 | 47.5 | 47.5 |
| P80 [mm] | 44.0 | 35.1 | 40.4 | 32.8 | 42.1 | 43.2 |
| Reduction ratio [F80/P80] | 1.98 | 2.48 | 1.80 | 2.21 | 1.13 | 1.10 |
5 Conclusions
A variety of test methods have been used to fit the parameters of the Tavares Breakage Model. In spite of the wide range of deformation rates used in the tests, consistent results could be obtained for particles ranging in size over two orders of magnitude.
Results from experiments of a laboratory-scale jaw crusher operating with different feed sizes showed that significant variability appeared in both, which is attributed to variations in particle shapes and particle fracture energies (strengths). That, however, required running multiple simulations of the tests to capture variations in particle shape and fracture energies, resulting in comparable variabilities in the tests when compared to the experiments.
Simulations of the laboratory-scale jaw crusher were able to provide reasonable predictions of throughput and product size distribution, the latter particularly at the fine end. This has been attributed to the high flakiness of fragments generated from breakage of iron ore, which could not be properly captured in the DEM simulations using the Voronoi tessellation approach. Yet, good agreement was reached when the finest feed size was used, being explained by the limited size reduction of the particles. Such reasonable results were only obtained after the steel-particle friction coefficient calibrated from the angle of repose tests was reduced nearly in half; otherwise, all throughputs would have been severely overestimated. This shows that the challenge posed by the highly irregular and unusual shapes of the itabirite iron ore particles and the lack of control of fragment shapes in Rocky DEM require further developments in the future in order to improve predictions.
Acknowledgments
The authors would like to thank the financial support by the Brazilian Research Agencies CNPq (grant numbers 313425/2021-3 and 406964/2022-0) and FAPERJ (grant number E-26/205.848/2022). The support of Ansys through the Rocky DEM license is greatly appreciated. The authors would like to thank Dr. Victor A. Rodriguez for his assistance in part of the experiments and Mr. Tulio Campos for processing part of the data.
The Article Processing Charge for the publication of this research was funded by the Coordenação de Aperfeiçoamento de Pessoal de Nível Superior - Brasil (CAPES) (ROR identifier: 00x0ma614).
Symbols used
-
- A
-
- [%]
-
- Ai
-
- [g]
-
- b
-
- [t kWh−1]
-
- b′
-
- [–]
-
- d0
-
- [mm]
-
- Emax/E50
-
- [–]
-
- Emin
-
- [J kg−1]
-
- E∞
-
- [J kg−1]
-
- Is50
-
- [MPa]
-
- L
-
- [mm]
-
- T
-
- [mm]
-
- t10
-
- [%]
-
- W
-
- [mm]
Greek letters
-
- αn
-
- [–]
-
- βn
-
- [–]
-
- γ
-
- [–]
-
- σ
-
- [–]
-
- Φ
-
- [–]


