Sustainable Adsorbents for Wastewater Treatment: Template-Free Mesoporous Silica from Coal Fly Ash
Abstract
The adsorption of methylene blue (MB) onto silica synthesized from coal fly ash (CFA) was investigated to evaluate its efficiency, kinetics, and thermodynamics. Adsorption studies revealed nearly 100 % MB removal under optimized conditions (50 ppm MB, pH 7, 3.1 g adsorbent dosage, and 50 min contact time). Equilibrium data fitted best with the Langmuir isotherm model (R2 = 0.9881, Qmax = 32.76 mg g−1), confirming monolayer adsorption and strong adsorbate–adsorbent interactions. Kinetic modeling showed that the pseudo-second-order model (R2 = 0.99) best described the process, indicating chemisorption as the dominant mechanism. Thermodynamic analysis confirmed that the adsorption was spontaneous and exothermic (ΔG < 0, ΔH = − 22.84 kJ mol−1), with a decrease in system entropy, suggesting an energy-efficient process that favours lower temperatures. Reusability studies demonstrated that the silica adsorbent retained 97.5% ± 0.17 % MB removal efficiency over 12 cycles, highlighting its economic and industrial feasibility. Additionally, ethanol-based desorption proved to be effective, ensuring sustainable regeneration. These findings establish silica from CFA as a cost-effective, environment friendly, and highly efficient adsorbent for wastewater treatment applications, particularly in dye-contaminant removal.
1 Introduction
Ecosystems are presently experiencing substantial damage due to the depletion of natural resources and environmental degradation caused by the development of industrial activities and unforeseen calamities [1, 2]. Simultaneously, the increasing prevalence of water pollution, a matter of critical importance, presents significant hazards to the fundamental life-sustaining component of the Earth, underscoring its essential function in sustaining life [3, 4]. Primary factors contributing to pollution include exposure to harmful chemicals and pathogens, which contaminate water sources and infiltrate the food chain, ultimately limiting access to safe drinking water and food [5, 6].
The global textile sector, employing over 35 million people [7, 8], plays a significant role in water pollution, accounting for roughly 20 % of the world's water pollution [9]. It ranks as the second-largest polluter, trailing only the oil industry [9-11]. In recent years, the textile dyes market has experienced notable growth, with sales rising from $9.69 billion in 2023 to approximately $10.58 billion in 2024, reflecting a compound annual growth rate (CAGR) of 9.3 % [12]. Projections suggest continued growth to $14.84 billion, with a CAGR of 8.8 % [12]. This expansion can be attributed to several factors, including industrialization, growing consumer demand for diverse colors, chemical advancements, textile manufacturing growth, and fashion trends. The textile industry is among the industrial sectors with notably high water and chemical usage [9, 13]. Wastewater generated by the industry often contains significant levels of unfixed colors and dyeing auxiliaries [14-16]. Approximately 700 000–800 000 t of dyes are produced annually, with 10–15 % lost to the environment [3, 17-19].
Methylene blue (MB) and Rhodamine B are examples of cationic dyes, while Congo Red, Methyl Orange, and Reactive Black-5 represent common anionic dyes [20, 21]. These dyes, along with neutral counterparts, are extensively used in the textile industry due to their widespread application in fabric coloring processes [22]. However, the persistence of dyes, including the investigated material MB, results from their complex composition and diverse applications, disrupting environmental balance [23]. MB, used extensively in wool, silk, paper, cosmetics, temporary hair coloring, cotton, textiles, food, and in pharmaceuticals, is valued for its therapeutic and medicinal properties [24]. Despite its widespread use, MB is known for its enduring environmental presence and toxic, carcinogenic, and mutagenic nature [25]. The discharge of pigmented wastewater into ecosystems contributes significantly to eutrophication [26], visual pollution, and disruptions to aquatic life, posing substantial health and environmental risks [24, 27]. The dye's thermal and photo stability in the environment causes it to absorb and reflect sunlight, which disrupts the process of algal photosynthesis and interferes with the natural flow of the food chain [23, 28, 29]. Long-term exposure to MB can have serious negative effects on health, including methemoglobinemia, anemia, cancer, vomiting, eye irritation, nausea, and mental disorientation [28, 30-32]. As a result, the inevitable effects of these contaminants highlight the necessity of treatment before release into the environment to stop environmental damage [28, 33]. MB should be handled as hazardous waste before disposal. Regulatory limits for MB in wastewater vary depending on regional and institutional standards [34]. The US Environmental Protection Agency (EPA) generally recommends a maximum allowable concentration of 0.2 mg L−1 to help reduce potential environmental and health risks [35].
Conventional techniques of treating wastewater have been well studied, such as chemical coagulation, activated sludge, runoff, carbon adsorption, and photodegradation, and are not effective in removing dyes, especially MB, from industrial effluents due to their limited propensity to degrade complex dye molecules and sludge generation [28, 36]. Promising alternatives can be found in sophisticated techniques such as advanced oxidation processes, reverse osmosis, chemical precipitation, nanofiltration, membrane separation, electrocoagulation, ion exchange, photocatalysis, and electrodialysis [37]. These methods offer advantages such as high removal efficiency, broad pollutant applicability, and low sludge generation [38]. Nevertheless, these sophisticated techniques are accompanied by disadvantages such as substantial energy and chemical usage, operating expenses, and the requirement for proficient technologists, underscoring a discrepancy between the expectations for water quality and the treatment capabilities [28, 36]. Among the several technologies available, adsorption emerges as a prominent and extensively employed method for the removal of MB from textile industry effluent because of its cost-effectiveness and ecologically sustainable nature [39-41].
This study addresses key limitations in wastewater treatment, particularly the low reusability and sustainability of conventional silica-based adsorbents, by introducing template-free mesoporous silica synthesized from coal fly ash (CFA), a low-cost and abundantly available industrial waste. Using MB as a model dye, the material exhibited excellent adsorption performance and maintained high removal efficiency over 12 adsorption and desorption cycles. This level of durability and effectiveness exceeds that of previously reported silica adsorbents derived from pure chemicals and other recycled materials, offering a more sustainable and economically viable solution for wastewater treatment [42-44]. This remarkable longevity significantly enhances its economic value by minimizing replacement costs, making it a cost-effective solution for large-scale applications. Additionally, its high surface area, abundance of active sites, and strong adherence to the Langmuir isotherm and pseudo-second-order kinetics reinforce its superior adsorption capabilities. Although this material has demonstrated high effectiveness in removing MB, its potential applicability to other cationic dyes, such as crystal violet (triarylmethane), rhodamine B (xanthene), and basic red 9 (azo), is suggested based on structural similarities; however, further experimental studies are required to confirm this performance. With its low-cost production and alignment with cleaner production principles (which emphasizes on minimizing waste and reducing energy consumption) [11], this mesoporous silica offers a sustainable and economically viable alternative to conventional adsorbents, providing a long-term solution for water pollution mitigation.
2 Materials and Methods
2.1 Materials
The mesoporous silica used in this study was derived from CFA [45], MB dye (Merck), Sigma Aldrich NaOH (98 %) and HCl (32 %).
2.2 Characterization of Silica
Powder X-ray diffraction (XRD) measurements of the mesoporous silica were carried out using a PANalytical X'Pert Pro X-ray diffractometer equipped with a CuK_ X-ray source (wavelength 1.5405). The diffractograms were recorded in the 2-theta range of 10–80 degrees at 40 kV and 40 mA. Following the scan, prominent peaks were identified and matched with patterns in the software library, selecting the highest percentage agreement.
Sample morphologies were analyzed using a high-resolution scanning electron microscope (SEM) (Carl Zeiss Gemini SEM500). Chemical compositions were determined with the BRUKER S8 TIGER XRF spectrometer. Compound identification in the spectral range of 400–4000 cm−1 was performed using a ThermoFisher Scientific Nicolet iS50 Fourier transform infrared (FTIR) spectrometer. Specific surface area and pore size were assessed using a Brunauer–Emmett–Teller (BET) analyzer (Micromeritics 3flex). Known sample amounts (40–60 mg) were loaded into the BET tube, degassed under vacuum (10–5 torr) at 100 °C for 1 h, and then further degassed overnight at 250 °C.
2.3 Point of Zero Charge of Adsorbent (Silica)
Potentiometric titrations (PMTs) were conducted under normal atmospheric conditions for a blank solution and suspensions containing different masses of immersed silica at a constant temperature of 25.0 °C ± 0.1 °C [46, 47]. A small amount of 1 M KOH was added to each vessel with a given amount of silica to deprotonate part of the surface sites, making the surface negatively charged. The aqueous suspensions with the silica were equilibrated for 24 h before titration. The suspensions were then titrated with small increments of 0.5 M aqueous HNO3 solution. The pH was measured and recorded after each addition of the acidic solution relative to its volume. The same titration process was also followed for the blank solution. A blank titration was performed in the absence of the silica adsorbent to establish a baseline for accurate interpretation of results. It accounts for pH changes resulting solely from the titrant, ensuring that subsequent shifts in pH during sample titration are attributed only to interactions with the adsorbent surface.
2.4 Adsorption Studies
Design-Expert software was used in this study to design experiments and model experimental data through response surface methodology (RSM) using the central composite design (CCD) technique, and the results were thoroughly analyzed using ANOVA (analysis of variance) [48]. RSM is a statistical and mathematical method that evaluates the effects of independent variables and investigates the interaction of several parameters that affect the process by varying them all at once [49]. Four independent variables were studied, as shown in Tab. 1: contact time, initial pH, adsorbent dosage, and initial dye concentration.
| Factors | Low | Higher |
|---|---|---|
| Contact time [min] | 10 | 90 |
| MB concentration [ppm] | 50 | 250 |
| pH | 3 | 11 |
| Adsorbent dosage [g L−1] | 0.1 | 3.1 |
2.5 Batch Equilibrium Studies
2.6 Kinetics and Equilibrium Studies
2.7 Reusability Performance of Silica (Adsorbent)
2.8 Desorption Studies
To restore desorption, 100 mL of an MB aqueous solution at a concentration of 100 mg L−1 was mixed with 1 g of adsorbent in a 250 mL Erlenmeyer flask. The flask was placed on a shaker and rotated at 600 rpm for 120 min. The concentration of MB in the centrifuged solution was then measured using a UV–Vis spectrophotometer. The used mesoporous silica was separated from the solution, rinsed with distilled water, and dried promptly at 110 °C for 3 h. Once fully dried, the mesoporous silica was transferred to an Erlenmeyer flask containing 100 mL of 95 % ethanol. The flask was placed on a shaker under the same conditions as before for 4 h. Samples of 5 mL were taken from the container at 30-min intervals over 4.5 h. The concentration of the desorbed substance was measured using a spectrophotometer to assess the effectiveness of ethanol regeneration.
3 Results and Discussions
3.1 Adsorbent Characterization
3.1.1 XRD Analysis
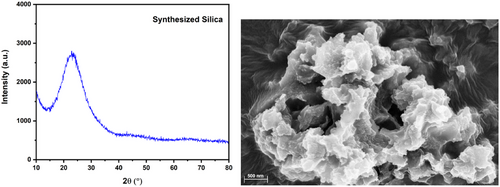
The noisy spectra from amorphous silica, showing a broad peak between 20 and 30 (Fig. 1), suggest the small particle size, nearing the nanoscale. This characteristic makes the mesoporous silica a promising adsorbent [50]. SEM imaging reveals the absence of crystalline or regular particle arrangement, confirming the amorphous nature of mesoporous silica in line with other studies. This structural irregularity leads to high porosity and a large surface area per unit volume, providing more active sites for adsorption and easier access to accommodate adsorbates [51].
3.1.2 BET Analysis
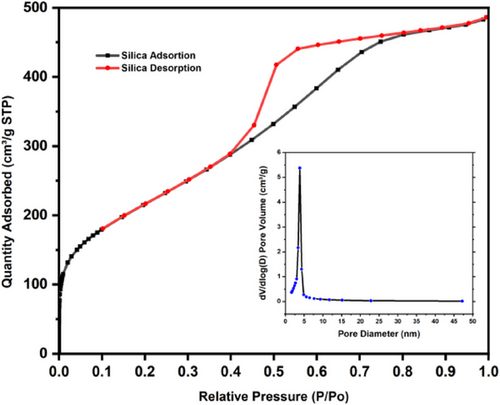
The N2 adsorption–desorption isotherm was conducted to assess silica's specific surface area and pore size distribution. As depicted in Fig. 2, the isotherm follows a type IV pattern based on the BET method, signifying a variety of adsorption behaviors, including monolayer and multilayer adsorption, as well as capillary condensation [51]. These phenomena are typical in mesoporous materials such as silica, which are good adsorbents. The isotherm displays a hysteresis loop in the range of 0.4 < P/Po < 0.8, indicating ongoing capillary evaporation and condensation of N2 during the adsorption process [52]. The pore-size distribution, derived from the adsorption branch of the N2 isotherms using the Barrett–Joyner–Halenda (BJH) method, reveals that most pore diameters in silica range from 2 to 50 nm, with an average pore diameter of 3.93 nm. The template-free silica has a surface area of 793.51 m2 g−1 and a purity of 99.1 % [45].
3.1.3 Point of Zero Charge (PZC)
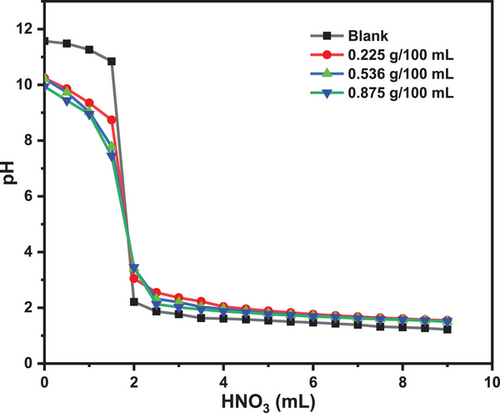
The point of zero charge (PZC) is a crucial surface parameter that characterizes the acid–base behavior of solids, mainly mineral oxides, in electrolytic suspensions. It represents the solid surface's pH level with a net zero charge, indicating that the positive and negative surface sites are in balance [46, 48, 53, 54]. Fig. 3 shows the experimental curves for the PMT technique recorded for SiO2.
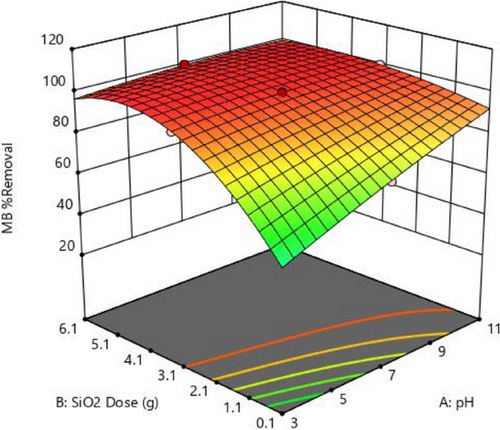
Fig. 3 demonstrates that silica's PZC is around 5, identified at the common intersection of the three mass lines. When the pH falls below the PZC, silica's surface gains a positive charge; above the PZC, the surface takes on a negative charge. This variation in surface charge significantly impacts the adsorption process. Research on the PZC of silica derived from CFA is limited; however, one study by de Oliveira reports a PZC value of 7 for silica sourced from CFA [55].
3.2 Optimization of Methylene Blue (MB) Adsorption
Tab. 2 shows the 30 experimental results for the adsorption of MB using silica extracted from CFA. The removal efficiency of silica ranged from 24.6 % at pH 3, 0.1 g dosage, 90 min and 50 ppm MB concentration to 100 % at pH 7, 3.1 g dosage, 50 min, and 50 ppm MB concentration.
| Run | Factor 1 A: pH | Factor 2 B: SiO2 dose [g] | Factor 3 C: Time [min] | Factor 4 D: MB Conc. [mg L−1] | Response 1: MB % removal |
|---|---|---|---|---|---|
| 1 | 11 | 0.1 | 90 | 50 | 99.7 |
| 2 | 3 | 3.1 | 50 | 150 | 96.2 |
| 3 | 7 | 3.1 | 50 | 250 | 99.7 |
| 4 | 11 | 6.1 | 10 | 50 | 99.9 |
| 5 | 11 | 3.1 | 50 | 150 | 99.7 |
| 6 | 7 | 3.1 | 90 | 150 | 99.7 |
| 7 | 7 | 3.1 | 50 | 150 | 99.5 |
| 8 | 11 | 0.1 | 90 | 250 | 88.8 |
| 9 | 11 | 6.1 | 10 | 250 | 99.6 |
| 10 | 3 | 0.1 | 10 | 250 | 82.0 |
| 11 | 3 | 6.1 | 10 | 250 | 93.9 |
| 12 | 7 | 3.1 | 50 | 150 | 99.6 |
| 13 | 7 | 3.1 | 50 | 150 | 99.9 |
| 14 | 7 | 0.1 | 50 | 150 | 73.6 |
| 15 | 11 | 6.1 | 90 | 250 | 99.4 |
| 16 | 11 | 0.1 | 10 | 50 | 96.3 |
| 17 | 3 | 6.1 | 90 | 50 | 97.8 |
| 18 | 7 | 3.1 | 50 | 150 | 99.3 |
| 19 | 7 | 3.1 | 10 | 150 | 98.8 |
| 20 | 7 | 3.1 | 50 | 150 | 98.9 |
| 21 | 11 | 0.1 | 10 | 250 | 83.2 |
| 22 | 3 | 0.1 | 10 | 50 | 25.1 |
| 23 | 7 | 3.1 | 50 | 150 | 99.4 |
| 24 | 3 | 0.1 | 90 | 50 | 24.6 |
| 25 | 7 | 3.1 | 50 | 50 | 100.8 |
| 26 | 3 | 0.1 | 90 | 250 | 81.9 |
| 27 | 7 | 6.1 | 50 | 150 | 99.8 |
| 28 | 11 | 6.1 | 90 | 50 | 99.2 |
| 29 | 3 | 6.1 | 10 | 50 | 97.0 |
| 30 | 3 | 6.1 | 90 | 250 | 97.1 |
3.3 Analysis of the Adsorption Process and Modeling
The ANOVA results for the MB removal efficiency by silica are shown in Tab. 3. The Model F-value of 2727.00 implies that the model is significant. There is only a 0.01 % chance that an F-value this large could occur due to noise. P-values less than 0.0500 indicate model terms are important. A, B, C, AB, AC, AD, BC, BD, CD, A2, B2, ABC, ABD, A2D, and AB2 are significant model terms. The F-value of the adsorbent dose (11 795.51) is significant more important than other parameters, which shows that it has the most effect on the MB removal efficiency.
| Source | Sum of squares | df | Mean square | F-value | p-value | |
|---|---|---|---|---|---|---|
| Model | 10 722.10 | 16 | 670.13 | 2727.00 | <0.0001 | significant |
| A-pH | 6.25 | 1 | 6.25 | 25.43 | 0.0002 | |
| B-SiO2 dose | 2898.62 | 1 | 2898.62 | 11 795.51 | <0.0001 | |
| C-time | 8.60 | 1 | 8.60 | 35.00 | <0.0001 | |
| D-MB Conc. | 0.5270 | 1 | 0.5270 | 2.14 | 0.1668 | |
| AB | 1264.76 | 1 | 1264.76 | 5146.73 | <0.0001 | |
| AC | 1.44 | 1 | 1.44 | 5.86 | 0.0309 | |
| AD | 1133.77 | 1 | 1133.77 | 4613.69 | <0.0001 | |
| BC | 1.85 | 1 | 1.85 | 7.53 | 0.0167 | |
| BD | 554.92 | 1 | 554.92 | 2258.17 | <0.0001 | |
| CD | 1.92 | 1 | 1.92 | 7.83 | 0.0151 | |
| A2 | 7.43 | 1 | 7.43 | 30.25 | 0.0001 | |
| B2 | 557.19 | 1 | 557.19 | 2267.40 | <0.0001 | |
| ABC | 13.37 | 1 | 13.37 | 54.39 | <0.0001 | |
| ABD | 1259.12 | 1 | 1259.12 | 5123.78 | <0.0001 | |
| A2D | 62.26 | 1 | 62.26 | 253.36 | <0.0001 | |
| AB2 | 132.89 | 1 | 132.89 | 540.76 | <0.0001 | |
| Residual | 3.19 | 13 | 0.2457 | |||
| Lack of fit | 2.62 | 8 | 0.3270 | 2.83 | 0.1338 | Not significant |
| Pure error | 0.5786 | 5 | 0.1157 | |||
| Cor. Total | 10 725.30 | 29 |
3.4 Interaction Effects Plots of MB Removal Efficiencies
3.4.1 Adsorbent Dosage and pH
The interaction effects of mesoporous silica dosage and initial as a function of response in the MB adsorption process are depicted in Fig. 4. The initial pH of the solution can influence the adsorbent surface charge, promoting or inhibiting dye adsorption on the adsorbent surface [48, 57]. As observed in Tab. 2, the value of MB removal is as low as 24.6 at pH 3 but increases to 100 % at pH 7. As depicted in Fig. 4, augmenting both the dosage and pH leads to a notable enhancement in MB removal. This effect arises from the increased dosage providing a more significant number of active sites for MB molecule attachment [58].
Various studies have shown that negatively charged functional groups on the adsorbent surface are required for basic dye adsorption. According to research, the surface of silica is surrounded by H3O+ ions at low pH when pH < pHZPC [59]. As a result of the competition between H3O+ ions and the electrostatic repulsion between the MB dye molecules and the positively charged active adsorption sites on the surface of silica, dye molecule adsorption is reduced [58, 60]. At higher pH values, such as pH > pHZPC, the amount of hydroxyl ions (OH−) in the solution increases, increasing the number of negatively charged sites and increasing the interaction between positive dye molecules and the negative surface of the prepared silica [61, 62].
3.4.2 Initial MB Concentration and Dosage
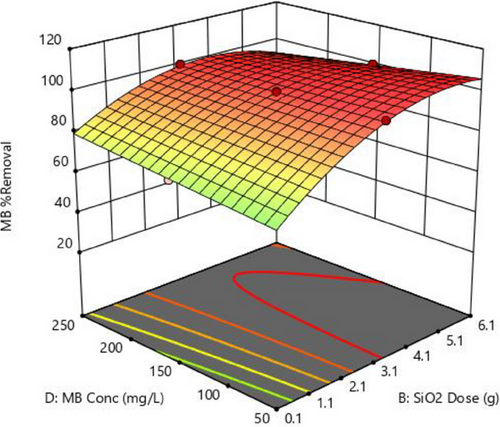
The relationship between MB concentration and adsorbent dosage, as depicted in Fig. 5, is essential in water treatment adsorption techniques. MB concentration denotes the dye quantity in the solution, whereas adsorbent dosage represents the material capable of adsorbing the dye. Higher MB concentrations typically increase adsorbent capacity due to a greater abundance of dye molecules [63-65]. Increasing adsorbent dosage at lower concentrations enhances adsorption effectiveness by providing more active sites and vice versa, as shown in Fig. 5. The maximum removal efficiency for this surface plot was reached at 3.1 g rather than at 6.1 g. However, a saturation threshold exists where further increments in concentration or dosage yield diminishing returns, indicating full utilization of available adsorption sites [48]. Understanding this interaction is pivotal for optimizing adsorption processes in water treatment.
3.4.3 Time and Adsorbent Dosage
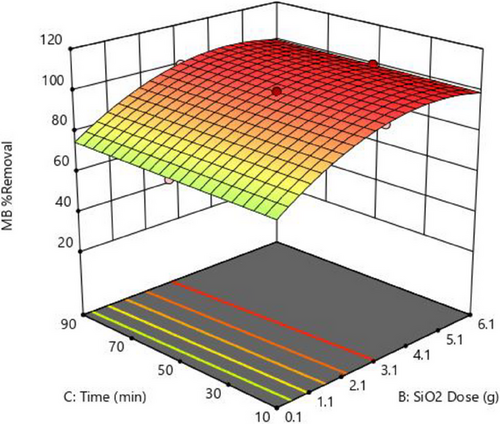
The prolonged contact between MB and the adsorbent, as shown in Fig. 6, shows limited influence on removal efficiency, suggesting that MB adsorption reaches equilibrium quickly, rendering extended contact negligible for efficiency gains [66, 67]. Conversely, increasing the adsorbent dosage markedly improves removal efficiency, highlighting a direct relationship between adsorbent quantity and adsorption capacity. This underscores the pivotal role of adsorbent dosage in optimizing removal efficacy, as evidenced by the apparent trend depicted in Fig. 6, with the highest MB removal at 100 % at 3.1 g dosage and 50 min.
3.5 Equilibrium Studies—Adsorption Isotherms
Adsorption isotherms describe and explain the relationship between adsorbent and adsorbate, which is important for optimizing adsorption processes [68]. As the adsorption process approaches equilibrium, the equations illustrate the distribution of an adsorbate between the liquid and solid phases [69]. Mapping the experimental data to various isotherm models is a critical step in determining a suitable model for process design [69, 70]. In this study, the Langmuir and Freundlich isotherm models, widely used in the scientific community, were used to analyze the experimental adsorption equilibrium data.
3.5.1 The Langmuir Isotherm Model
The linear and nonlinear Langmuir isotherm is depicted in Fig. 7:
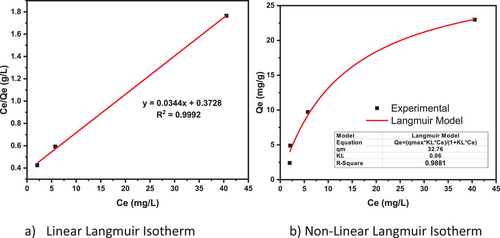
From the two plots, the nonlinear Langmuir isotherm (b) has the highest correlation coefficient (R2 = 0.9881) value than the linear form (R2 = 0.9992). The model variables are summarized in a Tab. 4:
| Langmuir | |||
|---|---|---|---|
| R2 | Qm [mg g−1] | KL [L mg−1] | RL |
| 0.9881 | 32.76 | 0.06 | 0.253 |
3.5.2 Freundlich Isotherm Model
The magnitude of the exponent, 1/n, in the adsorption process indicates the adsorption's favorability [73]. If the values are 1/n < 1, it means that as new adsorption sites appear, the type of isotherm required, the adsorption intensity, and the adsorption capacity increase. If 1/n > 1, the adsorption bond weakens, reducing the dye adsorption capacity [74].
The Freundlich plots in Fig. 8 (linear and nonlinear) show that the nonlinear has a higher correlation than the linear. The calculated Freundlich adsorption constants n and KF are 1.56 and 2.38, respectively. As 1/n < 1 (1/n = 0.64), the adsorption capacity increases and physical adsorption is advantageous (Note: physical adsorption process, n > 1, linear adsorption process, n = 1, and chemical adsorption, n < 1), indicating that the value of n is more than 1 [75].
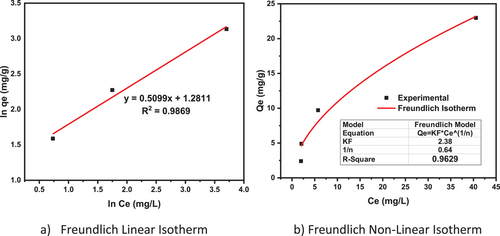
But the correlation constants of Freundlich isotherms are lower than the Langmuir models. As a result, it is possible to argue that MB adsorption on silica is a monolayer adsorption type. According to the Langmuir isotherm, Qm = 32.76 mg g−1), Qm >> 1, and value of RL for MB adsorption was 0 < RL < 1, indicating that MB adsorption was favorable [56].
The MB adsorption capacity results from this study demonstrate a moderate performance of our mesoporous silica when compared with literature data (Tab. 5). However, this efficiency is noteworthy because the material was synthesized without the use of structure-directing agents, seeding with pure silica sources, or any functionalization to improve MB adsorption. This simplicity in synthesis and processing not only reduces production costs but also highlights the inherent efficacy and versatility of our mesoporous silica, making it a promising, sustainable option for future applications in water treatment and dye removal.
| Silica source | Silica source | Surface modification/Template | Surface area [m2 g−1] | Pore size [nm] | MB removal efficiency [%] | Maximum adsorption capacity, Qmax [mg g−1] | References |
|---|---|---|---|---|---|---|---|
| Mesoporous silica | CFA | N/A | 793.51 | 3.93 | 100 % | 32.76 | This work |
| Poly-HIPE@nano-silica | Sigma Aldrich | Polystyrene coated | 30.95 | 17.78 | – | 23.1 | [76] |
| Cysteine-functionalized mesoporous silica | Sigma Aldrich chemicals | CTAB | 652 | 5 | – | 140 | [77] |
| Mesoporous silica | Rice husk | CTAB | 150.28 | 3.62 | 95 | 4.94 | [44] |
|
SBA-15 Al-SBA-15 |
CFA | P123 |
1014 871 |
7.06 8.34 |
90.5 ∼100 |
160.15 190.1 |
[78] |
| Silica gel desiccant | Commercial desiccant | – | 633 | 2.3 | 85.7 | 34.30 | [79] |
| Micro-mesoporous silica | ZSM-5 Zeolite | CTAB | 840 | 2.5 | 73–91 | 303 | [42] |
3.6 Kinetics
The kinetic study is an essential part of the adsorption process in water and wastewater treatment as it can provide valuable data about reaction pathways and dye adsorption reactions [80]. Furthermore, adsorption kinetics can predict the rate of solute adsorption, which is dependent on the retention time or adsorption reaction at the solid solution interface [81]. As a result, the adsorption rate or kinetic of adsorption is an important factor to consider when selecting adsorbent materials, designing processes, controlling operations, and predicting adsorption amount [71].
In this study, pseudo first-order (PFO) and pseudo second-order (PSO) adsorption mechanism of kinetic models were evaluated using Eqs. 7 and 8 [82].
Adsorption rates were calculated using both aforementioned models, and the results are shown in Fig. 9a PFO and Fig. 9b PSO plots.
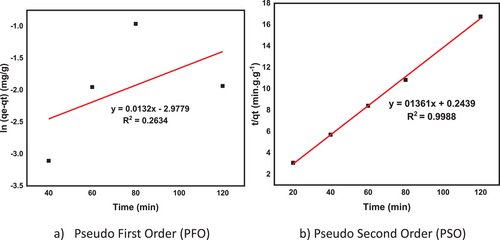
The obtained kinetic parameters for both models are also shown in Tab. 6. The results showed that the pseudo-second-order model had a better fit than the pseudo-first-order model, with a regression coefficient (R2) of 0.9988, a maximum adsorbent amount of 7.35 mg g−1, and a rate constant of 0.076 g mg−1 min−1.
| Pseudo first order model | Pseudo second order model | ||||
|---|---|---|---|---|---|
| qe [mg g−1] | K1 [min−1] | R2 | qe [mg g−1] | K2 [g mg−1 min−1] | R2 |
| 0.001052204 | 0.03 | 0.2634 | 7.35 | 0.076 | 0.9988 |
The pseudo-second-order model is typically applied in situations where the adsorption involves a multicomponent system, the process is relatively slow, or the adsorption follows an irreversible reaction. This kinetic model characterizes the adsorption of adsorbates onto adsorbents [83, 84], where chemical interactions (chemisorption) between adsorbates and functional groups on the adsorbent's surface determine its adsorption capacity [85].
3.7 Adsorption Thermodynamics
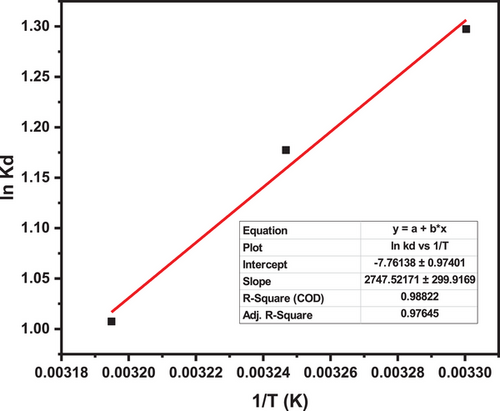
The thermodynamic analysis of MB adsorption onto silica provides key insights into the process's feasibility and underlying interactions and is comparable with other studies [86, 87]. The negative enthalpy change () confirms the exothermic nature of the adsorption, indicating that heat is released, and minimal energy is required for the process to occur. This behavior is driven by strong molecular interactions, including electrostatic attraction between the positively charged MB molecules and the negatively charged silica surface, hydrogen bonding with silica's silanol groups, van der Waals forces, and π–π interactions involving MB's aromatic rings [88-91]. The negative entropy change (ΔS = −64.52811 J (mol K)−1 = −64.53 J (mol K)−1) suggests a decrease in randomness as MB molecules transition from the bulk solution to a more ordered state on the silica surface [92].
Additionally, as seen in Tab. 7, the negative Gibbs free energy values (ΔG ranging from − 3.29 kJ mol−1 at 303 K to − 2.65 kJ mol−1 at 313 K) confirm that adsorption is thermodynamically spontaneous and favorable at lower temperature ranges [93, 94]. However, the decreasing spontaneity at higher temperatures (e.g., ΔG = −1.51 kJ mol−1) at 328 K) is consistent with the exothermic nature of the process, as increased thermal energy reduces the driving force for adsorption [95]. These findings highlight silica's efficiency as an adsorbent, requiring minimal energy input for dye removal. Its strong adsorption capacity and spontaneous nature make it a cost-effective and environmentally viable option for wastewater treatment applications.
| Thermodynamic parameter | ||
|---|---|---|
| ΔH [kJ mol−1] | ΔS [J (mol K)−1] | ΔG [kJ mol−1] |
| −22.84 | −64.53 | −3.29@303 K |
| −2.97@308 K | ||
| −2.65@313 K | ||
| ● | ||
| −1.51@328 K | ||
3.7.1 Adsorption Mechanism
The adsorption of MB onto silica, as depicted in Fig. 11, occurs through inner-sphere and outer-sphere complexation, depending on the nature of interactions between MB molecules and the silica surface. Inner-sphere complexation involves strong, direct bonding, including electrostatic attraction between negatively charged silanol groups (SiO⁻) and cationic MB⁺, hydrogen bonding between silica's hydroxyl (–SiOH) groups and MB's functional groups, and π–π stacking/interaction between MB's aromatic rings and surface-bound organic compounds. These interactions enhance adsorption stability and affinity.

In contrast, outer-sphere complexation relies on weaker, indirect interactions, such as van der Waals forces, which facilitate temporary adhesion, and solvent-mediated adsorption, where water molecules create a barrier that inhibits direct bonding. The combination of these mechanisms ensures efficient MB adsorption, reinforcing silica's potential as an effective and sustainable adsorbent for dye removal in environmental applications [88-91].
3.8 Reusability of the Adsorbent
In addition to its high adsorption capacity, the reusability of mesoporous silica adsorbent is crucial for ensuring economic viability in adsorption studies. In this study, 12 cycles of adsorption and regeneration were carried out using silica sorbent for MB adsorption (Fig. 12).
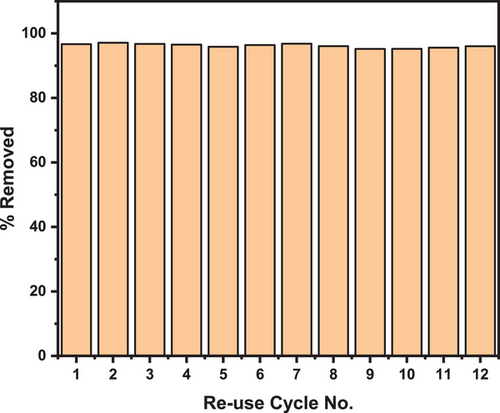
The cyclic adsorption experiments used 1 g of sorbent in a 100 mg L−1 concentration of MB dye, at a pH of 7 (without adjustment) and a temperature of 25 °C. The consistency in MB removal capacity across all 12 cycles, with an average removal rate of approximately 97% ± 0.17 %, demonstrates the economic potential of template-free, high-purity silica synthesized from CFA. Despite these encouraging results, there is a lack of research on the reusability of silica derived from CFA in MB adsorption.
Comparative studies using commercial silica gel or modified silica have shown a decline in adsorption capacity within the first five cycles of reusability. For instance, Subhan's [42] study on cetyltrimethylammonium bromide (CTAB)-synthesized micro-mesoporous silica (MMZ, BET 840 m2 g−1 and pore diameter 3.91 nm) from ZSM-5 zeolite reported a slight decrease in maximum MB adsorption over successive cycles. This reduction may result from a decline in surface area and weight loss during MMZ collection in adsorption and regeneration cycles. Similarly, Koyuncu's [43] study examined the reusability of silica (BET 652 m2 g−1, pore diameter 17.7 nm) and carbon-silica hybrid aerogels (BET 519 m2 g−1, pore diameter 32.1 nm) made from paddy waste ash. The study found that although there was minimal change in dye adsorption capacity from the first cycle (83.5 %) to the fourth cycle (79.7 %), a significant drop occurred in the fifth cycle, with dye removal decreasing to 59.7 % [43].
Usgodaarachchi's [44] research on mesoporous silica nanoparticles derived from rice husk and surface-controlled amine functionalization (MSN-A, BET 150 m2 g−1 and pore size 3.62 nm) for MB adsorption observed a decrease in MB adsorption rate over five cycles. The equilibrium adsorption capacity decreased from 13.72 mg g−1 in the first cycle to 11.05 mg g−1 in the fifth cycle [44].
These findings highlight the significance of further investigating the reusability of silica from various sources, mainly CFA, which is both an inexpensive and abundant waste material. Utilizing silica derived from CFA enhances its performance and cost-effectiveness in adsorption applications and contributes to environmental remediation by repurposing an industrial byproduct.
Fig. 13 illustrates the ability of silica to desorb adsorbed MB, a process that holds significant economic importance for the reutilization of the adsorbent.
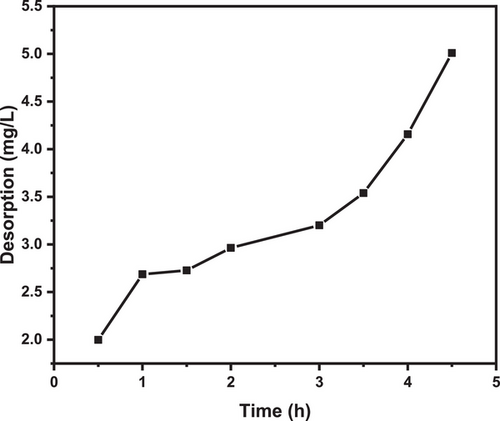
This study explores the potential of ethanol as a desorbing agent for MB dye from spent silica. Ethanol's suitability for silica regeneration stems from its easy removal through water rinsing, low-cost, low-toxicity, and convenient recycling [96]. Fig. 11 shows that silica exhibits a time-dependent increase in desorption potential at pH 7, reaching a desorption capacity of 5.5 mg L−1 within 5 h. This suggests the release of physical-adsorbed MB, consistent with findings from previous research [75]. The observed desorption aligns with the Freundlich isotherm model (n = 1.56, n > 1), indicating the effectiveness of the desorption process and applicability in describing the interaction between MB and silica.
4 Conclusion
The adsorption of MB onto the silica surface demonstrated excellent removal efficiency, achieving nearly 100 % under optimal conditions (50 ppm MB, pH 7, 3.1 g adsorbent dosage, and 50 min contact time). The adsorption process was best described by the Langmuir isotherm model (R2 = 0.9881, Qmax = 32.76 mg g−1, KL = 0.059 L mg−1), confirming monolayer adsorption and strong adsorbate–adsorbent interactions. Kinetic analysis showed that the pseudo-second-order model (R2 = 0.99) provided the best fit, indicating that the adsorption process was primarily governed by chemisorption mechanisms. Thermodynamic analysis further revealed that the adsorption was spontaneous (ΔG < 0), exothermic (ΔH = −22.84 kJ mol−1), and accompanied by a decrease in randomness at the solid–liquid interface (ΔS = −64.53 J (mol K)−1). The negative enthalpy confirmed that adsorption released heat, making it more favorable at lower temperatures, whereas the negative entropy suggested increased molecular organization upon MB attachment to the silica surface. As a low-cost and environment-friendly adsorbent, the synthesized silica has strong potential for water and wastewater treatment. Reusability studies demonstrated that silica maintained high MB removal efficiency, consistently achieving 97.5 % ± 0.17 % removal over 12 cycles, underscoring its economic and industrial feasibility. The desorption process using ethanol, a low-cost, low-toxicity solvent, proved highly effective, further enhancing MB removal over multiple cycles. These findings highlight silica's viability as a sustainable and cost-effective solution for water purification and dye-contaminant removal.
Symbols used
-
- Ce
-
- [mg L−1]
-
- Co
-
- [mg L−1]
-
- KF
-
- [L mg−1]
-
- KL
-
- [L mg−1]
-
- Qm
-
- [mg g−1]
-
- R2
-
- [%]
-
- qe
-
- [mg g−1]
Abbreviations
-
- ANOVA
-
- analysis of variance
-
- BET
-
- Brunauer–Emmett–Teller
-
- CAGR
-
- compound annual growth rate
-
- CCD
-
- central composite design
-
- CFA
-
- coal fly ash
-
- CTAB
-
- cetyltrimethylammonium bromide
-
- FTIR
-
- Fourier transform infrared
-
- MB
-
- methylene blue
-
- MMZ
-
- micro-mesoporous silica
-
- P123
-
- Pluronic-123
-
- PFO
-
- pseudo first-order
-
- PMTs
-
- potentiometric titrations
-
- PSO
-
- pseudo second-order
-
- PZC
-
- point of zero charge
-
- RL
-
- separation coefficient
-
- RSM
-
- response surface methodology
-
- SEM
-
- scanning electron microscope
-
- UV–Vis
-
- ultraviolet–visible
-
- XRD
-
- powder X-ray diffraction
-
- XRF
-
- pro X-ray diffractometer
Open Research
Data Availability Statement
Data are available upon reasonable request.
The authors declare no competing interest.


