A Reference Material for Bulk Solid Investigations
Abstract
This is an introduction into the idea of using a reference material in bulk solid investigations. The considered investigations deal with the phenomenon of dust emissions arising when handling bulk solids. Here, the idea is to simplify the structure of a bulk material and to characterize the chosen components in detail. Then, the comprehension and interpretation of complex mechanisms is going to be facilitated. Outlined are the introduction of the general framework and the approach of the selection process.
1 Introduction
The handling of bulk materials is accompanied by dust emissions affecting their environment. The intensity of these particle emissions depends on the bulk material properties, the handling conditions, and the process properties. Because the hazardousness of airborne dust particles in various scenarios has been confirmed by numerous studies [1-4], there is a great interest to predict the dust emissions before they arise.
The prediction methods available so far are not easily applicable to various treatments in bulk industries. As the scenarios are numerous and the materials used are very diverse. It results in a large number of unknown parameters being required [5-7]. Further, the calculation methods are accompanied by high deviations (±30 %) and are based on user-dependent subjective input parameters [8]. In order to optimize the possibilities to predict the amount of arising dust during the handling of bulk materials, the initiative of using an experimental–numerical approach for calculation was launched [9]. The core concept here is to develop a numerical method for calculating arising dust emissions validated with the help of experimental investigations that are carried out with a designed reference bulk material. In bulk solids handling, the identification of the particle mechanism is crucial, especially when developing models for the prediction of dust emissions. Particle release mechanisms are complex because of their dependence on various parameters grouped in material properties, environmental aspects, and process conditions. By knowing the exact properties of a reference material, the understanding and description of the release mechanisms during the stress process can be made possible in detail.
The use of a reference material instead of the usual material to approach a complex issue is a procedure of simplification. This kind of procedure can include the use of materials, which are either well-characterized or represent a group of numerous materials or the replica and analysis of the process in a small scale. Then the technique of simplification is helpful in order to understand and comprehend these complex systems and processes. Thus, it is an instrument to gain a better knowledge and to outline difficulties and defects. In various applications, a reference material is considered for the first and further attempts when developing and improving simulation models [10-12]. Moreover, when mechanisms in devices are going to be simulated, the verifying experiments are first performed with the reference material [13-15]. A use of spherical particles is always preferred when dealing with numerical investigations, because the determination of appropriate contact parameters for the discrete element method (DEM) is well-described and straightforward to determine experimentally. In comparison to this, identifying and describing behaviors and movements of non-spherical particles is significantly more complex [16].
The simplification-approach here is to use a well described material for bulk stressing experiments. The results of experiments are then the basis for the validation of a numerical method. And the output of the numerical method is the amount of arising dust emissions on the basis of the input data like material properties and handling scenarios. For this purpose, the assumption that the bulk material consists of two main parts, coarse fraction and a fine fraction, is being pursued. Here, the fine fraction should adhere to the coarse fraction and represent the releasable fraction. This fact supports the ability to track the released material mass. All in all, this procedure of using a substitute material for a normal bulk material minimizes the discrepancy between simulation and reality. In the end, it is a method of simplification in order to develop a reliable calculation tool for arising dust emissions during bulk handling processes.
This article is about the selection process for the components of the reference material and its characterization. Here, the process is shown retrospectively and in full, giving detailed information about considered materials and investigating a reproducible manufacturing process. Next to a detailed description of the coarse and fine fractions, it includes an evaluation of their tendency to raise dust. The According simulation model is first described in [17]; however, the adjustments between experiments and simulations are further outlined in [9, 18, 19].
2 Materials and Methods
2.1 Materials
In numerous bulk material investigations, both on an experimental and numerical level, the particles of the bulk materials are assumed to be spheres. For this reason, the decision was made to use spherical model bodies as coarse material. The considered spheres are made of plastic, metal, and ceramic, having a size range of 1000–2000 µm. The according powder particle size is going to be smaller than 100 µm. In order to perform single-particle investigations, this size range is applicable to manage experiments. The connection between coarse and fine material is realized with a 3D-shaker mixer. If the size range between coarse particle and fine particle is too high, the process of bringing the fractions in contact will not be successful. The different properties of the fractions lead to different forces, e.g., gravity, inertia force, and centrifugal force, which can result to segregation [20] or crushing rather than in coating the coarse material with fine material. Therefore, the resulting list of criteria for the coarse material is found in Tab. 1.
| Material-related | Visual-related | |
|---|---|---|
| 1 | Cleanability | Surface with color contrast to powder |
| 2 | No effects of electrostatic forces | Homogeneous sphericity |
| 3 | No moisture absorbtion | |
| 4 | Price does not exceed the benefit of material |
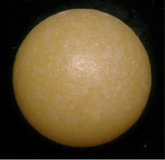
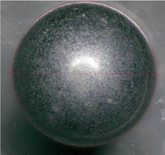
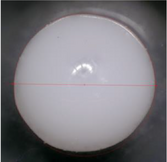
On these criteria, spheres made of plastic (KGM Kugelfabrik GmbH & Co. KG), metal (Sturm Präzision GmbH), and ceramic (Sigmund Lindner GmbH) were ordered and analyzed. Tab. 2 includes representative images taken with a reflected light microscope of a single sphere and shows main characteristics.
| Material | Plastic [POM] | Metal [AISI 420] | Ceramics |
|---|---|---|---|
 |
 |
 |
|
| Diameter d [µm] | 1500 | 1500 | 1800–2000 |
| Density ρ [kg m−3] | 1410 | 7700 | 6060 |
| Grade G (acc. to DIN 5401) | G300 | G28 | – |
For the selection of a suitable powder, which will represent the dust tending fine fraction, a list of criteria was drawn up as well. These characteristics were selected on the basis that simulations should be verified by carrying out investigations using the developed reference material. Further, the powder should not form a chemical bond with the spheres when mixing them. In Tab. 3, the material- and visual-related criteria established for the selection process are summarized.
| Material-related | Visual-related | |
|---|---|---|
| 1 | x50,3 < 100 µm | Homogeneous adhesion on spheres |
| 2 | Narrow particle size distribution | Low agglomeration on surface |
| 3 | Low hygroscopic tendency | |
| 4 | Non-hazardous and non-toxic in handling | |
| 5 | Significant values in dust release tests | |
| 6 | Low standard deviation in dust release tests |
- – that they are easily available in high quantities or were already available in the laboratory,
- – the substances have no toxic effect on humans, and thus production and experiments can be carried out without further precautions,
- – they have a mass median of less than 100 µm.
Tab. 4 presents the powders with their main properties, including information about their particle size distributions.
| Name | Main component | Manufacturer | Product designation | x10,3 [µm] | x50,3 [µm] | x90,3 [µm] | R3 |
|---|---|---|---|---|---|---|---|
| Esk15 | Calcium carbonate | KSL Staubtechnik GmbH | Eskal 15 | 13.54 | 19.50 | 27.03 | 0.692 |
| Esk60 | Calcium carbonate | KSL Staubtechnik GmbH | Eskal 60 | 48.19 | 69.22 | 97.60 | 0.714 |
| WeiSt | Wheat starch | Jäckering Gruppe | HAMSTARCH-A | 18.41 | 34.66 | 62.61 | 1.275 |
| ZuDe | Sugar derivative | KSL Staubtechnik GmbH | Eszet 45 | 39.34 | 59.72 | 84.46 | 0.756 |
| Ess30 | Native starch | KSL Staubtechnik GmbH | Esstar 30 | 29.32 | 42.79 | 61.41 | 0.750 |
| SiB20 | Silicon dioxide | Sigmund Lindner GmbH | SiLibeads 0–20 µm | 2.88 | 7.04 | 15.96 | 1.858 |
| SiB50 | Silicon dioxide | Sigmund Lindner GmbH | SiLibeads 0–50 µm | 23.84 | 35.65 | 51.76 | 0.783 |
| SiB70 | Silicon dioxide | Sigmund Lindner GmbH | SiLibeads 40–70 µm | 49.39 | 66.09 | 87.07 | 0.570 |
The range Rr refers to the median value in order to compare the results of each powder concerning its width of particle size distribution. Because the mass-related particle size distribution is determined, the quantity type r is here r = 3. If the value of R3 is less than 1, a narrow particle size distribution can be assumed.
In the end, the investigations will lead to a so named reference test bulk material (RTBM). Fig. 1 shows the desirable structure of the RTBM with its main components and their designations.

The coarse fraction is represented by spheres. The fine fraction will be represented by a powder. One single particle of the RTBM is than called a bulk material particle (cf., Fig. 1). It is composed of a coarse material particle (sphere) covered with fine material particles (powder). The RTBM represents a bulk material where the fraction, which can be emitted as dust, is only the powder.
2.2 Methods
In order to find out the most suitable substances, structured selection processes were carried out. First, the appropriate spheres were chosen. Its choice is based on their properties and their images taken under the reflected-light microscope (Keyence VHX 5000), whereas the powder selection process is additionally based on experimental studies. The particle size distributions of the powders were measured using the laser diffraction (HORIBA LA-950), and in order to examine the dust raising tendency of the possible mixtures, the single-drop apparatus Dust View I (PALAS® GmbH) was used.
A preparation of the powder is crucial in order to get representative powder samples for the measurements of the particle size distributions and the preparation of the RTBM-blends. The whole process, from taking representative powder sample to the production of RTBM, is demonstrated in Fig. 2. First, an amount of 500 g of powder is divided into two fractions of 250 g powder each using a ripple divider. One fraction of 250 g powder is discarded, and the other fraction is fed to the second step. Here, the sample amount of 250 g is divided into eight equal quantities using a rotational sample divider. Then, two fractions are combined so that in the end, four powder samples are obtained with an approximate quantity of 60 g. In each processing step, mass losses of powder must be expected. In the last step, the powder samples are placed into the drying kiln at a temperature of 105 °C for 24 h. After that, the powders are ready for measuring the particle sizes.

Before weighing the powder for preparation, it cools down in an air-conditioned room for at least 10 min. For each visual and experimental analysis, a total amount of 100 g of a blend (RTBM) varying the mass ratio of powder and coarse material particles was prepared.
The examination of the dust raising tendency of the various blends is realized using the single-drop apparatus Dust View I. In this setup, the material is stressed during free-fall and impact one-time. Fig. 3 shows a schematic image of the single-drop apparatus.

It represents the characteristic dustiness value of the outlined single-drop method. All three values (SF, Smax, S30 s) are the characteristic factors of the method [21].
With the digital reflected light microscope (Keyence VHX 5000), the visual-related criteria listed in Tab. 3 were analyzed using the images of a single bulk particle. The bulk particles were taken from mixtures of 100 g with a mass fraction of 10 % and 20 %. Furthermore, images like this were used to identify the appropriate mixing time.
3 Results
3.1 Sphere Selection
On the basis of the aforementioned criteria for the spheres, the metal spheres were chosen as most suitable material as coarse fraction. The ceramic spheres are produced in a size range (1800–2000 µm) and not in a single size like the metal spheres (1500 µm). According to the manufacturer, the sphericity of the metal spheres is at 99.9 %, and the surface roughness is less than 0.05 µm [22]. The images in Tab. 2 confirm that the sphericity of metal is more stable than that of the ceramic sphere. The main arguments against the plastic spheres are the high price (4.69 €/100 pieces, metal: 2.15 €/100 pieces, ceramic: 0.22 €/100 pieces) and the tendency to get difficulties in terms of electrostatic forces that are complex. For this reason, more reliable results in experiments and fewer deviations from simulations are to be expected when using metal spheres for investigations. In Tab. 5, the position of each sphere material in terms of the criteria is summarized.
| Criteria | Plastic | Metal | Ceramic | |
|---|---|---|---|---|
| 1 | Cleanability | − | + | + |
| 2 | No effects of electrostatic forces | − | + | + |
| 3 | Homogeneous sphericity | + | + | − |
| 4 | No moisture absorption | + | + | + |
| 5 | Surface with color contrast to powder | + | + | − |
| 6 | Price does not exceed the benefit of material | − | − | + |
| Summary | 3/6 | 5/6 | 4/6 |
3.2 Powder Selection
The selection of the most suitable powder includes the consideration of the material data, the analysis of the images of the powder layers on the sphere surface, and the evaluation of the dust tendency experiments with the single-drop apparatus.
By means of the producers’ material safety data sheets, the hazardousness and toxicity of the powders were analyzed. Both starch products, WeiSt and Ess30, are not classified as hazardous or toxic according to European Union legislation (REACH-European Commission 1907/2006). Avoiding an intensive dust formation during handling is crucial since otherwise hazardous dust-air mixtures may occur and lead to a dangerous situation if an ignition source is present. Esk15 and Esk60 are natural calcium carbonate and thus are not classified as hazardous or toxic according to the standards. However, intensive dust exposure due to handling can exceed workplace limits. The wearing of respirators is mandatory. SiB20, SiB50, and SiB70 are based on soda-lime glass; thus, they mainly consist of silicon dioxide. These powders are neither hazardous nor toxic. However, the dust formation must be avoided during handling as well and wearing a respiratory protection mask is also required if the limits for silicon dioxide powder are exceeded. ZuDe as native sugar derivatives is not hazardous nor toxic as well. When handling this powder and particles are set free as dust, respiratory protection is necessary. All in all, for the use of these eight powders, a respiratory protection is required. However, the substances are neither hazardous nor toxic, but an intensive dust formation in case of a present ignition source leads to a dangerous environment. Consequently, during the use of the powders, the exposure limits must be complied with.
The hygroscopic tendency of the powders is not a major issue, because all the powders have a low tendency for moisture absorption. Esk15 is a calcium carbonate powder, which is neither hygroscopic nor sensitive to moisture [23]. The powders SiB20, SiB50, and SiB70 are micro glass beads based on soda-lime glass. They consist mainly of silicon dioxide and sodium oxide, and these substances also have no hygroscopic characteristics [24]. ZuDe is a derivate of sugar, and it is described as non-hygroscopic. But compared to the powders mentioned so far, ZuDe is soluble in water [25]. The native starch Ess30 [26] is non-hygroscopic and not soluble in water; nevertheless, the product can absorb 20 % moisture as maximum [26]. Compared to this, Esk15 absorbs maximum 0.9 %, and Ess30 absorbs not more than 0.30 % moisture [23, 26]. The producer of the powder WeiSt does not attribute any special non-hygroscopic properties to its product. It absorbs a moisture content of maximum 13 % [27]. To sum up, only the starch-based products WeiSt and Ess30 do not meet the requirements concerning moisture absorption. Therefore, all powders are dried before their use, eliminating the influences of moisture.
Next, the powder layers on the surface of the spheres were analyzed. In order to compare the powder layers with each other, the images of single bulk particles were compared. The particles originate from mixtures of 100 g in total with a wp = 10 % applying the mixing time of five minutes. For each combination, various spheres were observed under the microscope; however, Fig. 4 illustrates eight representable single bulk particles.

The shown powder layers are diverse. While SiB20 tends to agglomerate strongly around the metal sphere, the powders SiB50 and SiB70 do not form a layer on the metal sphere even though the difference in particle size is small (cf., Tab. 4). Further, there is also no evident surface coverage when using Ess30. Homogeneous coverage with comparatively uniformly sized particles is only found on the vmetal spheres mixed with Esk15 and WeiSt. The use of Esk60 and ZuDe leads also to an adequate coverage of the metal surface. However, agglomerates form here that directly show a clear difference in size to the other particles.
The blend of metal spheres and powder should represent a bulk material that is then going to be used for dust release investigations. Therefore, it is necessary to identify a key figure for each combination for their tendency to raise dust in consequence of handling it. The dust tendency of each mixture was then determined with the free fall apparatus. Two test series were carried out with wP = 10 % and wP = 20 %. For each key figure determined, three passes were carried out. The resulting dustiness value SF for each combination is shown in Fig. 5.

The criteria for the selection process regarding the single-drop experiments are “significant values in dust release tests” and “low standard deviation in dust release tests” (cf., Tab. 3). Significant values mean that on the one hand, the reference material is suitable for dustiness experiments producing significant data, and on the other hand, the key figures are high enough to be measured in case of the necessity to reduce the powder fraction. Such desirable values are given by Esk15 and WeiSt. Here, the results for both powder mass fractions are almost twice as high as when using the other mixtures. The dustiness characteristic of Esk60 with wP = 20 % is at 71.20 and comparable high as Esk15 (68.59) and WeiSt (77.47). However, the overall results of Esk60 are less satisfactory, as the value at 10 % is significantly lower and has a high standard deviation (56.67 %) to the value using Esk15 (5.35 %) and WeiSt (14.50 %). Regardless the mass ratio, the blends using Esk15 deliver the data with the lowest standard deviation (wP = 20 %:8.47 %, with wP = 10 %:5.35 %). The mixtures with ZuDe provide in the experiments also low standard deviations in both cases (wP = 20 %:10.04 %, wP = 10 %:5.33 %), but they also have a comparatively low tendency to raise dust during handling. Furthermore, the value for ZuDe with wP = 10 % is higher than with wP = 20 % that is not theoretically expected. This indicates an obvious lack of reliability of the results using ZuDe as fine fraction in the reference material. According to the results of the single-drop experiments, using blends prepared with Esk15 provides the most reliable data.
Concluding, in Tab. 6, the test results for each powder were assessed for the criteria set. If the criterion was met, the corresponding field was marked with a plus (+); otherwise, a minus (−) was set.
| Criteria | Esk15 | Esk60 | WeiSt | ZuDe | Ess30 | SiB20 | SiB50 | SiB70 | |
|---|---|---|---|---|---|---|---|---|---|
| 1 | x50,3 < 100 µm | + | + | + | + | + | + | + | + |
| 2 | Narrow particle size distribution (R3), cf., Tab. 4 | + | + | − | + | − | − | + | + |
| 3 | Low hygroscopic tendency | + | + | − | + | − | + | + | + |
| 4 | Non-hazardous and non-toxic in handling | + | + | + | + | + | + | + | + |
| 5 | Significant values in dust release tests (cf., Fig. 6) | + | + | + | − | − | − | − | − |
| 6 | Low standard deviation in dust release tests (cf., Fig. 6) | + | − | − | + | − | − | − | − |
| 7 | Homogeneous adhesion on spheres (cf., Fig. 5) | + | − | + | − | − | − | − | − |
| 8 | Low agglomeration on surface (cf., Fig. 5) | + | + | + | − | − | − | + | + |
| Summary | 8/8 | 6/8 | 5/8 | 5/8 | 2/8 | 3/8 | 5/8 | 5/8 |
The evaluation of the results clearly shows that Esk15 is best suited for the application as fine fraction in the RTBM. As the only material, it fulfills all desired requirements. Because the next best material meets six out of eight requirements, no material competes with Esk15.
3.3 Mixing Time
The production process of the reference material blends based on the single step using the 3D-shaker mixer, bringing the fractions in contact. Here, only the duration of mixing can be varied. Consequently, the duration of mixing is the only factor influencing the structure of the powder layer on the surface of the metallic spheres. For the selection process of the powder, a mixing time of 5 min was applied according to the investigations of Parey [28]. In order to proof, if the mixing time of 5 min is appropriate, the results of two further mixing times were compared using images from the microscope. By means of the comparison of the powder layer using a blend of the metallic spheres and Esk15 with wp = 1 % powder, the appropriate time was identified. The shortest duration of mixing was 1 min, the longest was 10 min, and the third duration was 5 min. The results of Parey [28] were also successful using a mixing time of 5 min. In Fig. 6, for each duration, a single bulk particle is shown representatively. Each bulk particle was taken from a blend of 100 g in total.

The images reveal that a certain time of mixing is necessary to cover the sphere homogenous with a powder layer. After a mixing time of 1 min, the sphere surface is not completely covered. Further, the increase of the duration of mixing reveals the effect of the formation of agglomerated layers on the surface. Consequently, the higher the mixing time, the higher the rate of agglomeration. The duration of 5 min is a compromise of both effects.
3.4 Reference Test Bulk Material
In the end, three compositions based on the mass ratios of metallic spheres and calcium carbonate were chosen, whereby the share of powder in the mixtures does not exceed 5 %. Fig. 7 shows a bulk particle for each of the three various mixtures, which were named A, B, and C. RTBM A has a mass fraction of 5 % powder, RTBM B 2 %, and RTBM C 1 %.

In total, three suspension-samples of Esk15 were analyzed. Fig. 8 shows the results as cumulative distribution (a) as well as the distribution density (b) of the Esk15 in the samples and as raw material.

Both the mass median value (x50,3) and the mass modal value (xmod,3) decrease when the powder mass fraction in the mixture is reduced. This indicates that during the manufacturing process, a comminution of the powder particles takes place. When using wP = 5 % (RTBM A), then the effect is not visible according to these data, because the values of Esk15 in this blend are similar to the raw material. However, decreasing the powder mass fraction further to 1 % reveals the effect of crushing powder particles. This is due to a grinding process that takes place at the selected ratios between the coarse particles and the powder in the container. Further, a characterization of the blends is then available by the powder mass (mP) per sphere. Taking into account the mass losses of powder, which occur due to residues on the container when the material is removed, the resulting fine material quantity per coarse particle can be determined. The data are summed up in Tab. 7.
| RTBM | wP [%] | Median value x50,3(Esk15) [µm] | Mass modal xmod,3(Esk15) [µm] | Mass loss [%] | mP per sphere [mg] |
|---|---|---|---|---|---|
| A | 5 | 18.98 | 18.64 | 9.57 | 0.646 |
| B | 2 | 16.31 | 14.21 | 41.54 | 0.162 |
| C | 1 | 12.51 | 12.41 | 82.02 | 0.025 |
During the use of the reference material, the mass loss was determined in order to calculate the amount of powder per sphere. It turns out that the mass loss of powder increases when decreasing the powder amount of the blend. Accordingly, it is more difficult to detect released dust mass with the blend RTBM C because, in addition to the low proportion of powder, the mass losses also reduce the amount of powder per sphere by up to 95 %. To identify whether the total amount of a blend has an influence on the mass loss, blends with a total amount of 200 and 300 g were produced. Then, the mass losses were determined, when using these blend amounts as initial quantities instead of 100 g. In the end, the data were compared and summed up in Fig. 9.

The comparison among all three RTBM-blends reveals that the chance for mass losses increases with a lower powder fraction. However, the mass losses decrease when raising the sample amount. The result is that a higher quantity of fine material per sphere can be achieved with increasing the sample size of RTBM. When using the RTBM A, the quantity per sphere varies between 0.65 and 0.70 mg for the three various samples. In the case of RTBM B, the quantity per sphere is around 0.22 mg (0.16 mg with 100 g, 0.23 mg with 200 g, and 0.26 mg with 300 g), which corresponds to a deviation of 18.6 %. In contrast, the deviations at RTBM C regarding the powder amount per sphere are 50 % between the sample quantities. On the basis of these results, it is crucial to include the determination of mass loss when preparing the samples to calculate mP per sphere. The variation of the sample quantities is a component of the determination of dust release functions (cf., Chapter 1) because various experimental setups are going to be used. For example, the variation of the angle of repose of a heap can be realized with the change of mass. The mP per sphere is an input variable for carrying out the simulations according to [17] and to gain the amount of released dust after stressing the sample. Experiments and simulations can be compared more effective on the basis of these values.
3.5 Cleaning Process
The reference material is reproduceable. For that purpose, the spheres are made reusable after a cleaning process, and only the powder is removed and discarded. In the cleaning process are three major steps—dry sieving, washing, and drying. In Fig. 10, the steps and the main components are shown in a block diagram.

First, the RTMB is sieved using a mesh size of 800 µm, which guarantees that only powder is sieved out. In the next step, the spheres are added to a washing procedure. Here, the soiled spheres are rinsed with tap water first. Next, they are rinsed in a beaker with hot water and detergent. Then, the spheres are rinsed again with tap water to remove the wash water. Afterward, the spheres are washed with deionized water to avoid lime residues during the subsequent drying process. In addition, the use of ethanol solvent for rinsing should remove the last remaining deposits from the surface of the sphere. Finally, the spheres are placed in the drying oven and dried for at least 24 h at 105 °C.
4 Conclusion and Outlook
To sum up, the selection process of the reference material has been carried out successful under the considered criteria (cf., Tabs. 1 and 3), which have been established in advance. The RTBM, abbreviated to RTBM, represents a bulk material in its main components, the fine fraction and the coarse fraction. Then, the material can be used as sample for dust release investigations in order to determine the released powder mass in consequence of handling. Further, the discharged mass can be clearly traced back to one fraction. Therefore, the discrepancy between simulations and experiments can be kept small on the basis of the precisely known material data of both components. The use of spherical metal spheres simplifies the modeling in the simulations. This also reduces the differences between the material input data in the simulations and the real conditions in the experiments. In turn, these circumstances allow an increase in the traceability of the investigations. Concurrent with the validation of the simulations on the basis of the experiments, it is granted that is benefit of the simplification-technique. The uniform manufacturing process of the reference material as well as the cleaning process makes it possible to always use the same starting material for a numerous amount of experiments. In summary, this selected material provides an excellent starting point for investigations into improving the predictability of dust release during bulk material handling. Investigations on both levels, on bulk solid [18] as well as single particle [19, 30], can be carried out, and the release mechanisms can be examined.
Acknowledgments
The research project IGF 19411 N of the research association Forschungs-Gesellschaft Verfahrens-Technik e.V. (GVT) was supported by the Federal Ministry of Economic Affairs and Climate Action through German Federation of Industrial Research Associations (AiF) as part of a program for promoting industrial community research (IGF) on the basis of a decision by the German Bundestag.
Open access funding enabled and organized by Projekt DEAL.
Symbols used
-
- d
-
- [µm]
-
- I
-
- [–]
-
- I0
-
- [–]
-
- m
-
- [mg]
-
- Q
-
- [–]
-
- q
-
- [µm−1]
-
- R
-
- [–]
-
- S
-
- [–]
-
- t
-
- [min]
-
- w
-
- [%]
-
- xi
-
- [µm]
Greek Letters
-
- ρ
-
- [kg m−3]
Sub- and Superscripts
-
- 10
-
- 10 % value
-
- 30 s
-
- value at 30 s
-
- 50
-
- median value
-
- 90
-
- 90 % value
-
- F
-
- free fall
-
- max
-
- maximum value
-
- min
-
- minimum value
-
- mix
-
- mixing
-
- mod
-
- model value
-
- r
-
- quantity type
-
- P
-
- powder
Abbreviations
-
- AISI
-
- American Iron and Steel Institute
-
- DEM
-
- discrete element method
-
- Esk15
-
- Eskal 15
-
- Esk60
-
- Eskal 60
-
- Ess30
-
- Esstar 30
-
- POM
-
- polyoxymethylene
-
- RTBM
-
- reference test bulk material
-
- SiB20
-
- SiLibeads 0–20 µm
-
- SiB50
-
- SiLibeads 0–50 µm
-
- SiB70
-
- SiLibeads 40–70 µm
-
- WeiSt
-
- wheat starch
-
- ZuDe
-
- sugar derivative