Pore Diffusion in the Fischer–Tropsch Synthesis: Limitation or Advantage in Multi-Tubular Reactors?
Abstract
The Fischer–Tropsch synthesis (FTS) is a highly exothermic reaction often conducted in multi-tubular fixed-bed reactors. Pore diffusion limitations within the catalyst particles are typically viewed as detrimental due to reduced reaction rates. However, this study demonstrates that these limitations can provide significant benefits in terms of reactor stability and performance. Using a 2D numerical reactor model, we explore the influence of pore diffusion on temperature profiles, conversion, and thermal runaway behavior under realistic operating conditions. Results reveal that pore diffusion reduces the apparent activation energy, effectively mitigating thermal sensitivity and increasing the allowable level of reaction temperature. Consequently, higher CO conversions can be achieved safely compared to an idealized scenario without pore diffusion limitations. Hence, pore diffusion limitations, rather than being a disadvantage, act as a stabilizing factor in FTS reactors.
1 Introduction
For Fischer–Tropsch synthesis (FTS), multi-tubular reactors are commonly used to regulate reaction temperatures and ensure safe operation, minimizing the risk of thermal runaway. These reactors cool up to 10 000 tubes, each typically measuring 2–5 cm in diameter, by circulating boiling water around them.
The risk of thermal runaway necessitates the analysis of reactor behavior using computer simulations based on reliable mathematical models. These models should accurately predict temperature and concentration profiles across various design and operational parameters, such as tube diameter and cooling temperature. 2D models are commonly utilized to address axial and radial temperature gradients within the fixed-bed. This 2D approach is recommended for accurately predicting runaway, as opposed to 1D model, where heat transport resistances are simplified and lumped at the tube wall [1-5].
In a multi-tubular FTS reactor and other fixed-bed reactors, catalyst particles typically have diameters in the millimeter range to avoid excessive pressure drop. However, this design often results in pore diffusion limitations, which significantly reduce the effective reaction rate compared to the intrinsic rate. In FTS, this occurs because the catalyst pores are filled with liquid hydrocarbons (HCs), and the diffusion coefficients for CO and H2 in liquid HCs are relatively low (Dliq ≈ 0.01 Dgas) [5-11].
-
The apparent activation energy is approximately halved (at least for ηpore < 0.5), which reduces the thermal sensitivity of the reactor.
-
The permissible temperature difference between the maximum tube center temperature and the cooling temperature can increase by a factor of two to three, enhancing reactor stability.
-
The cooling temperature required to avoid runaway is generally higher with pore diffusion limitations, enabling operation at higher temperatures, at least, as discussed below for FTS, if the maximum temperature is not limited by other constraints such as selectivity, catalyst stability, etc.
In previous studies, we introduced a detailed 2D model for a cooled FTS fixed-bed reactor using a cobalt catalyst [6-10]. This model is now applied to investigate the specific impact of pore diffusion limitations on reactor behavior, particularly in terms of achievable syngas conversion and safety margins against thermal runaway.
-
What is the impact of pore diffusion limitations on the sensitivity and runaway behavior of a cooled fixed-bed FTS reactor?
-
Are pore diffusion limitations generally a disadvantage, or could they be advantageous for syngas conversion and HC production in multi-tubular FTS reactors?
-
What roles do tube diameter, intrinsic activity, and cobalt content play under these conditions?
Although this work focuses on FTS, the conclusions are broadly applicable to other heterogeneously catalyzed, exothermic reactions that are diffusion limited and conducted in cooled fixed-bed reactors.
This study only very briefly discusses the general aspects of FTS, intrinsic and effective kinetics on cobalt catalysts, and the characteristics of the 2D model used in this study. Detailed information, including rate equations and mass/heat transfer correlations, is available in previous works [6-10].
2 Methodology: Kinetics of FTS and Multi-Tubular FTS Reactor Model
2.1 Intrinsic and Effective Reaction Kinetics of FTS
The intrinsic rates for methane (rm,CO,CH4) and C2+-HCs (rm,CO,C2+), along with internal diffusion limitations, have been experimentally determined in prior studies for Pt promoted (0.03 wt% Pt for Co reduction) Co/γ-Al2O3 catalysts with a Co content of 10 wt% [12-16]. Both rates adhere to Langmuir–Hinshelwood kinetics, accounting for the influences of CO and H2 concentrations. Details on the kinetics both on cobalt and iron catalyst can be found in a recent review [17].
In Eq. (3), the activity coefficient CA reflects the CO content and intrinsic activity, with the baseline of one for 10 % CO. Increasing the CO content enhances CA. FTS catalysts typically contain up to 30 wt% CO (Ca ≈ 3), and this limiting value is assumed in this study, varying CA in a range of 0.5–3.
A value of cH₂O of 120 mol m−3, corresponding to a CO conversion of 40 % and a partial pressure of steam of about 5 bar (30 bar, syngas with 31 % CO and 69 % H2), reduces the reaction rate by 25 %.
The value of the almost constant factor Cϕ for a particle diameter of 3 mm is 300 kg0.5 s0.5 m−1.5.
ηpore is significantly affected by temperature. For the particle diameter dp of 3 mm assumed here, ηpore is below one above 180 °C, dropping to 0.2 for 240 °C and Ca = 3 [9, 10]. This leads to a higher molar H2-to-CO ratio in the particles relative to the bulk phase, typically two, enhancing undesired CH4 formation over C2+-HCs as the diffusion coefficient of H2 in liquid HCs is double that of CO. This effect intensifies above 240 °C, with CH4 selectivity surpassing 20 % versus 10 % in absence of diffusion limitations. Hence, in this work the maximum temperature was limited to 240 °C [5-16].
These (negative) effects on product selectivity observed at Thiele modulus values above about one (ηpore < 0.75) are also reported by Bukur et al. [18] and Iglesia et al. [19] for cobalt as catalyst. It is beyond the focus of our study to consider this negative selectivity effect of internal diffusion limitations. Instead, we focus only on the impact of internal diffusion limitations on the effective reaction rate, activation energy, and above all on reactor sensitivity regarding thermal runaway, as discussed below. These three parameters are practically not affected by selectivity issues. Hence, we have here simplifying assumed a constant methane selectivity of 20 %, although without pore diffusion limitations, this value may be lower (e.g., 10 %).
2.2 2D Model of Cooled Multi-Tubular Fixed-Bed FTS Reactor
-
The heat released during FTS radially dissipates in the pseudo-homogeneous phase, comprising both catalyst and gas within the reactor bed, to the tube wall. This process is governed by the radial thermal conductivity (λrad).
-
Near the inner tube wall, the heat transfer coefficient (αw,int) accounts for thermal resistance caused by the high porosity of the bed near the wall. This results is in a temperature discontinuity or “jump” at the wall.
-
Heat is transferred through the tube wall by conduction, which contributes minimally to the overall thermal resistance and subsequently to the cooling fluid (boiling water), as determined by the external heat transfer coefficient (αw,ex).
-
The adiabatic temperature increase due to the FTS reaction can reach up to 2000 K for complete CO conversion with pure CO and H2 as syngas. However, the permissible increase to avoid thermal runaway is typically limited to below 30 K, necessitating effective cooling. This study employs tubes with diameters of 1.5 and 3 cm. Although a 1.5 cm diameter is not practical for industrial reactors (due to the very high number of required tubes, ∼1/dt2), it is included here to investigate a border scenario with a rather high cooling intensity.
-
Changes in the molar flow rate and pressure drop are included in the model, as they influence gas velocity and residence time.
-
Radial dispersion of mass is considered, although its impact on reactor performance is minimal [10]. Axial dispersion of mass and heat is neglected, as it predominantly affects systems with steeper axial gradients over very short distances [9].
-
This study does not account for syngas recycling in order to concentrate only on the influence of pore diffusion limitations. The syngas consists only of H₂ and CO, with a fixed H₂-to-CO ratio of 2.2. This setup ensures identical H₂ and CO conversions and corresponds to a methane selectivity of 20 %.
-
The differential equations (DEs) for mass and heat balances are solved using the Presto Kinetics software, a reliable solver for DEs (CiT GmbH, Rastede, Germany).
Results from reactor modeling, including the effects of pore diffusion under typical conditions (dt,int = 3 cm, Tcool = 211 °C, Ca = 2), are presented in Tab. 1. Operational conditions and details of the chemical media are provided in Supporting Information Tab. S1.
| Final conversion of CO XCO at z = 12 m (=XH2) | 47.5 % |
| Maximum axial temperature Tmax (at r = 0) reached at z = 2.3 m | 235.7 °C |
| Conversion of CO reached at z = 2.1 m XCO, 2.1 m (=XH2, 2.1 m) | 10.2 % |
| Ignition temperature (runaway) Tcool, crit | 216 °C |
| Pore effectiveness factor ηpore (at Tmax, z = 2.3 m, r = 0) | 0.32 |
| Radial dispersion parameter/coefficient εbed Drad | 1.5 × 10⁻⁴ m2 s−1 [20-29] |
| Effective radial thermal conductivity λrad (at Tmax, z = 2.3 m) | 4.2 W m−1 K−1 [30, 31] |
| Internal heat transfer coefficient (bed to internal tube wall) αw,int (z = 2.3 m) | 999 W m−2 K−1 [32, 33] |
| External heat transfer coefficient (external wall to boiling water) αw,ex (z = 2.3 m) | 1508 W m−2 K−1 [33-36] |
| Radial heat flux (wall to boiling water) (at Tmax, z = 2.3 m) | 5564 W m−2 [33-36] |
| Pressure drop Δpbed | 1.16 bar [37] |
3 Simulation of FTS Reactor with and without Considering Pore Diffusion Limitations
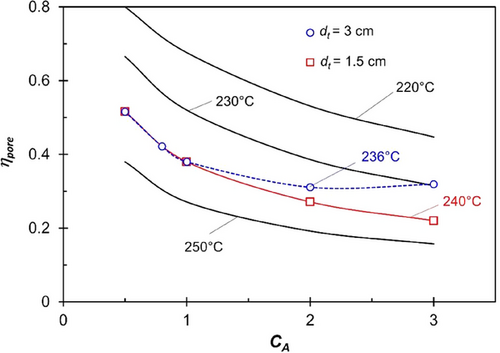
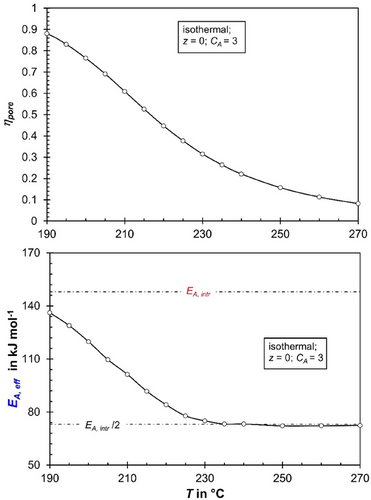
Fig. 1 illustrates the significant impact of reaction temperature and activity coefficient (Ca) on the pore effectiveness factor (ηpore) for temperatures ranging from 220 to 250 °C and values of Ca between 0.5 and 3 (corresponding to 5–30 wt% CO). The Thiele modulus increases substantially with temperature due to the almost exponential rise in CO conversion rate and is proportional to Ca0,5 (see Eqs. (3) and (7)). For realistic values of Ca greater than one (CO content = 10 wt%), and at temperatures above 230 °C, the intrinsic reaction rate exceeds the effective rate by a factor of two (ηpore = 0.5) to five (ηpore = 0.2).
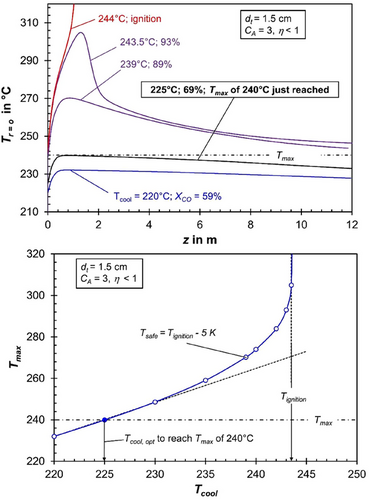
Figs. 2 and 3 illustrate axial temperature profiles and the corresponding CO conversion for different cooling temperatures, considering tube diameters of 3 and 1.5 cm, while accounting for realistic pore diffusion limitations (ηpore < 1) to emphasize the influence of pore diffusion.
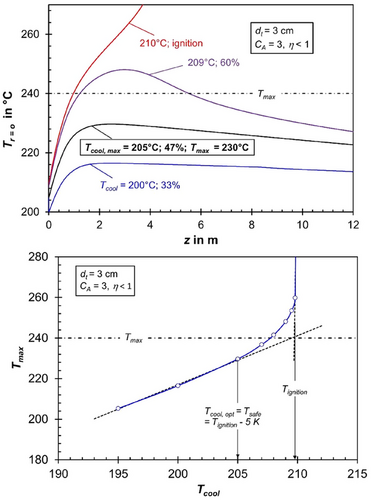
For a tube diameter of 3 cm, the allowable cooling temperature is limited to 205 °C to prevent thermal runaway, maintaining a safety margin of 5 K below the ignition temperature, as depicted in the lower part of Fig. 2. The maximum axial temperature at this cooling temperature reaches 230 °C at a tube length of approximately 3 m. This is still 10 K below the critical maximum of 240 °C, necessary to avoid excessive methane formation.
For the smaller tube diameter of 1.5 cm (Fig. 3), and thus a higher cooling intensity enabled by the increased tube area-to-volume ratio, ignition “delays” until the cooling temperature reaches 244 °C. Under these conditions, the allowable cooling temperature increases to 239 °C, corresponding to a maximum reaction temperature of 270 °C and a CO conversion approaching 90% (Fig. 3, bottom). However, to ensure that the reaction temperature remains within the permissible limit of 240 °C (to avoid a too high methane selectivity), the cooling temperature must be reduced to 225 °C. This adjustment limits the reaction temperature to exactly 240 °C in the front section of the tubes but lowers the CO conversion from about 90 % to 69 % (Fig. 3).
If we consider the hypothetical scenario where pore diffusion limitations are completely absent (ηpore = 1), for instance, if the pores were not be filled with liquid HCs, the situation changes significantly (Fig. 4). For a tube diameter (dt) of 3 cm and a high activity coefficient (CA = 3), ignition already occurs at a low cooling temperature of approximately 193 °C. Even for smaller tubes (dt = 1.5 cm) and a relatively low intrinsic activity (CA = 1), the maximum allowable cooling temperature (Tcool, max) reaches 221 °C. The corresponding axial temperature profiles and CO conversion rates for various cooling temperatures are provided in Supporting Information Figs. S2 and S3.
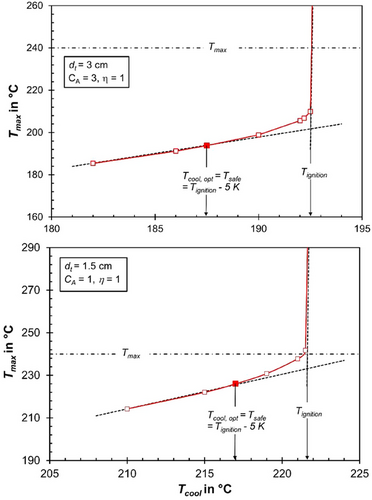
For the first and highly critical case (CA = 3, dt = 3 cm), the cooling temperature is limited to 188 °C (5 K below ignition) to prevent thermal runaway (Fig. 4, top). Under these conditions, the maximum axial temperature is just 195 °C, and the CO conversion remains very low at 14 % (Supporting Information Fig. S3). In contrast, for the realistic case where pore diffusion limitations are present (Tcool = 205 °C, Tmax = 230 °C), the CO conversion increases significantly to 47 % (Fig. 2). Thus, the unavoidable limitation due to pore diffusion proves to be a clear advantage in this scenario.
For the less critical case of a low activity combined with a low tube diameter (CA = 1, dt = 1.5 cm), the absence of pore diffusion limitations limits Tcool to 217 °C (Fig. 4, bottom). Even then, the maximum axial temperature is 226 °C, well below the permissible limit of 240 °C. The CO conversion under these conditions reaches 44 % (Supporting Information Fig. S2). However, this is still lower compared to the realistic scenario with pore diffusion limitations (Tcool = 230 °C, Tmax = 240 °C, XCO = 49 %, see Supporting Information Fig. S1).
Fig. 5 demonstrates that, in most cases, pore diffusion limitations are (on first sight unexpectingly) advantageous and can be even considered a fortunate circumstance regarding the achievable CO conversion. This holds here for FTS true across a wide range of catalytic activities and tube diameters. Only in cases with a small tube diameter of 1.5 cm combined with a low intrinsic activity (CA < 0.8) do pore diffusion limitations result in a disadvantage for CO conversion (Fig. 5, bottom). However, this effect arises solely due to the assumed limit of the maximum axial temperature (240 °C), which is imposed to prevent excessively high methane selectivity, as shown in Fig. 6.
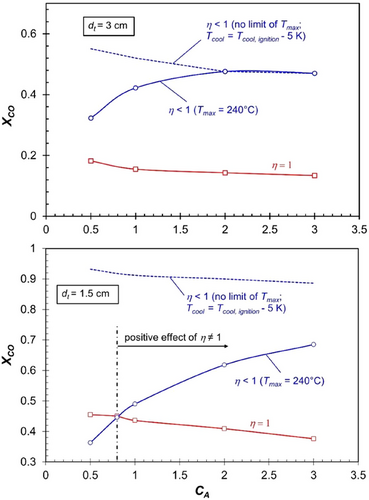
If the maximum allowable temperature is not restricted, pore diffusion limitations would never result in a lower CO conversion compared to scenarios without such limitations; see blue dashed lines in Fig. 5. The situation for CA = 0.8 (axial profiles of temperature, ηpore, and reaction rate), where the same CO conversion is reached in both cases (ηpore = 1 or < 1), is depicted in Supporting Information Fig. S4.
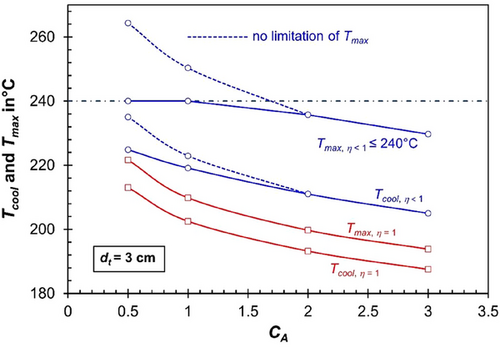
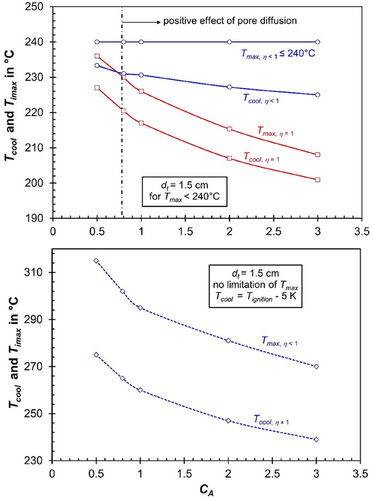
Fig. 6 (for dt = 3 cm) and 7 (dt = 1.5 cm) illustrate the maximum cooling temperature required to ensure safe reactor operation with respect to thermal runaway (Tcool = Tignition−5 K) and the corresponding maximum axial temperature (Tmax). The analysis is presented for both the realistic scenario of pore diffusion limitations (ηpore < 1, shown in blue lines and data points) and the hypothetical case without pore diffusion limitations (ηpore = 1, shown in red).
For cases where the maximum axial temperature that can be reached without risking thermal runaway exceeds 240 °C—such as for a tube diameter of 1.5 cm at any value of the activity coefficient (CA) under pore diffusion limitations (ηpore < 1)—cooling temperatures that correspond to reaching the 240 °C limit (to avoid excessive methane formation) are also shown (see Fig. 7, bottom).
For a tube size of 3 cm, which is already relatively small for technical multi-tubular FT reactors (typically up to 5 cm in diameter), the temperature level—and consequently the CO conversion (see Fig. 5, top)—achievable under the hypothetical scenario of ηpore = 1—is significantly lower compared to the realistic case of ηpore < 1. This remains true even when the maximum axial temperature is restricted to 240 °C, although higher temperatures would be possible without runaway for CA < 2.
For the very small tube size of 1.5 cm, the temperature level and hence the CO conversion, see Fig. 5, bottom, reached for the hypothetical case of ηpore = 1 gets more and more closer to the “real” case of ηpore < 1, but for realistic values of the activity coefficient CA of above 0.8, there is still a positive effect of pore diffusion limitations.
Fig. 8 illustrates the impact of temperature on the intrinsic (rCO, intr) and effective (rCO, eff) reaction rates under conditions at the reactor entrance (z = 0) with fresh syngas for an activity coefficient of CA = 3. The intrinsic reaction rate increases sharply with temperature, corresponding to an apparent activation energy of CO consumption of 148 kJ mol−1. This value results from the parallel formation of methane and C₂+-HCs, governed by respective Langmuir–Hinshelwood mechanisms (true activation energies and adsorption enthalpies, see [6]).
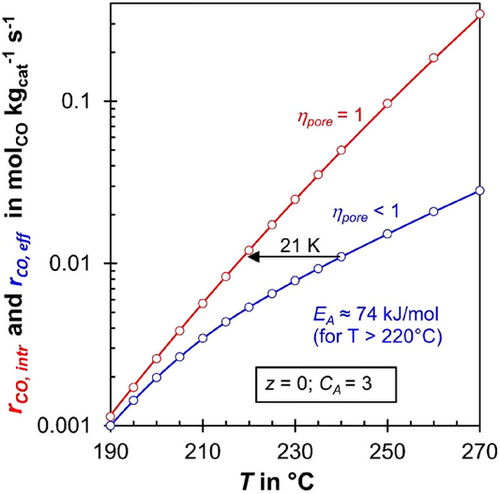
For temperatures exceeding 220 °C, the effective activation energy of the effective rate is halved (74 kJ mol−1), as expected, since the pore effectiveness factor (ηpore) drops below 0.5 under these conditions (see also Figs. 1 and 9). (For CA = 1, the temperature is about 240 °C to reach this low value of EA,eff, see Supporting Information Figs. S6 and S7.)
As highlighted by the arrow in Fig. 8, at a temperature of 240 °C, the effective reaction rate (rCO,eff) matches the intrinsic reaction rate (rCO, intr) for the hypothetical case of no pore diffusion limitations at 219 °C, a temperature 21 K lower. The higher the temperature, the larger this temperature difference becomes where rCO, intr equals rCO,eff, diminishing the “advantage” of pore diffusion limitations. Conversely, at lower temperatures, this difference decreases, reducing the positive impact of pore diffusion limitations.
Although this criterion is a useful guideline, it is slightly conservative, as it is based on the simplifying assumption that the conversion (here of CO) remains negligible at the axial position where the maximum reaction temperature occurs at the center of the fixed bed [5]. In addition, Barkelew only considered in a one-dimensional model approach the temperature difference between the mean reaction temperature and the cooling temperature, i.e., a radial temperature gradient in the bed was neglected. Nevertheless, Eq. (8) shows that the allowable overall radial temperature difference at the position of the axial temperature maximum is inversely proportional to the value of the activation energy (and increases slightly also by a higher temperature level).
Tab. 2 shows the values of derived from the reactor model for tube diameters of 1.5–3 cm and values of the activity coefficient of 1–3 (entries 1a–8a in Tab. 2). For comparison, the “optimal” temperature differences (ΔTmax, opt) for cooling temperatures set 5 K below the critical value are also listed (entries 1b–8b). The entries 1–4 represent the hypothetical case of the absence of pore diffusion limitations, whereas the entries 5–8 show the realistic values, including pore diffusion.
| No. | ηpore | CA | dt in cm | Tcool, ignition in °C | Tmax (r = 0) in °C | ΔTmax, ignition = Tmax − Tcool, ignition in °C |
|---|---|---|---|---|---|---|
| 1a | 1 | 3 | 3 | 192.5 | 209.9 | 17 |
| 2a | 1 | 207.5 | 227.2 | 20 | ||
| 3a | 3 | 1.5 | 205.7 | 225.0 | 21 | |
| 4a | 1 | 221.5 | 241.7 | 20 | ||
| 5a | <1 | 3 | 3 | 210.0 | 278.1 | 68 |
| 6a | 1 | 228.0 | 286.4 | 58 | ||
| 7a | 3 | 1.5 | 243.5 | 304.2 | 61 | |
| 8a | 1 | 264.6 | 331.7 | 67 |
| No. | ηpore | CA | dt in cm | Tcool,opt | Tmax (r = 0) in °C | ΔTmax, opt = Tmax − Tcool,opt in °C |
|---|---|---|---|---|---|---|
| 1b | 1 | 3 | 3 | 187.5 | 193.8 (XCO = 13 %) | 6 |
| 2b | 1 | 202.5 | 209.8 (XCO = 16 %) | 7 | ||
| 3b | 3 | 1.5 | 200.7 | 208.0 (XCO = 37 %) | 7 | |
| 4b | 1 | 217.0 | 225.9 (XCO = 44 %) | 9 | ||
| 5b | <1 | 3 | 3 | 205.0 | 229.6 (XCO = 47 %) | 25 |
| 6b | 1 | 223.0 | 250.5 (XCO = 52 %a)) | 28 | ||
| 7b | 3 | 1.5 | 238.5 | 268.6 (XCO = 88 %a)) | 30 | |
| 8b | 1 | 259.6 | 293.3 (XCO = 91 %a)) | 34 |
- Note: Tcool, ignition is the cooling temperature, where runaway occurs, see Figs. 2-4. Tcool,opt is set to be by 5 K below Tcool, ignition to keep a safe distance from runaway. For the case of a safe (“optimal”) cooling temperature (Tcool, opt), the conversion of CO is also listed. Runaway takes place for Tcool = Tcool, ignition + 0.1 K.
- a) Note that XCO is unrealistically high, as the maximum axial temperature is higher than the limit of 240 °C with regard to an unwanted high CH4 selectivity. Values of XCO for Tmax = 240 °C are shown in Fig. 5.
The data in Tab. 2 clearly show that ΔTmax, ignition, and ΔTmax, opt are approximately three times higher in the presence of pore diffusion limitations (ηpore ≠ 1) compared to cases with negligible influence, i.e., when the intrinsic reaction rate is always reached (ηpore = 1). This trend is consistent when applying the Barkelew approximation (Eq. (8)).
Fig. 10 (dashed lines) illustrates the hypothetical temperature (Tintr) that would be required to achieve the same intrinsic reaction rate (hence without pore diffusion limitations) as the effective reaction rate (rη) observed in the “real” case with pore diffusion limitations. This is shown at the position of the axial temperature maximum (r = 0). At this hypothetical temperature Tintr, the advantage provided by pore diffusion limitations would disappear, and the “real” CO conversion achieved in the reactor would be nearly identical to the case without limitations.
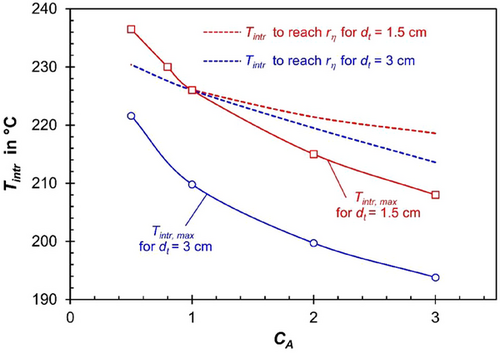
The “real” modeled values of Tintr,max, i.e., those reached at the “real” temperature maximum without pore diffusion limitations, are also shown, indicating that these values are in most cases much lower than Tintr required to reach rη. The equality or reversal occurs only for very small tubes (1.5 cm diameter) and at low activity coefficients (CA < 1), see Fig. 10.
It is important to note that the use of FT eggshell catalysts (with the same average cobalt content) is not a recommended option for cooled fixed-bed reactors, as already demonstrated in a previous publication [39]. The reduced influence of pore diffusion in eggshell catalysts significantly increases the reactor's temperature sensitivity, which, in turn, limits the maximum allowable tube diameter and consequently reduces the productivity per tube.
4 Conclusions
This study investigates the impact of pore diffusion limitations on the performance and stability of cooled multi-tubular reactors used in FTS. Although pore diffusion limitations are traditionally perceived as a drawback, this work demonstrates their significant advantages under typical operational conditions. The reduced temperature sensitivity due to the lower effective activation energy in the presence of pore diffusion limitations enhances reactor stability and allows for higher permissible temperature gradients. This makes the reactor less prone to thermal runaway and more robust against fluctuations in cooling conditions.
Using a 2D numerical model, the analysis reveals that pore diffusion limitations increase the allowable cooling temperature and maximum reaction temperature, improving syngas conversion without compromising safety margins. For realistic cases, the effective reaction rate is reduced to a level where the reactor operates more reliably, achieving higher productivity compared to scenarios without pore diffusion limitations. However, for very small tube diameters and low intrinsic activities, these limitations can occasionally lead to minor reductions in conversion due to constraints imposed by maximum allowable temperatures to limit methane selectivity.
The study also underscores the importance of properly accounting for pore diffusion effects in reactor design and operation. Hypothetical scenarios without pore diffusion limitations show significantly reduced operational stability, requiring stricter control over cooling conditions to avoid runaway.
In conclusion, pore diffusion limitations, often viewed as an unwanted chemical engineering challenge, can act as a stabilizing factor in cooled fixed-bed reactors for FTS. Only in the up to now rare case of microreactors, discussed for FTS in the last years for small scale and decentralized applications, pore diffusion limitations are a drawback: the channels are very small, only about 1 mm, and thus a very efficient cooling and almost isothermal conditions can be reached [40].
The conclusions derived in this study may also be instructive for other heterogeneously catalyzed exothermic reactions limited by pore diffusion if conducted in cooled fixed-bed reactors. But this should be analyzed by further research also for systems beyond FTS.
Supporting Information
Supporting information for this article can be found under DOI: https://doi.org/10.1002/ceat.70049.
Acknowledgments
Open access funding enabled and organized by Projekt DEAL.
Symbols used
-
- CA
-
- [–]
-
- ci
-
- [mol m−3]
-
- Cϕ
-
- [kg0.5 s0.5 m−1.5]
-
- dt
-
- [m]
-
- D
-
- [m2 s−1]
-
- Deff,CO,liq
-
- [m2 s−1]
-
- EA,intr
-
- [J mol−1]
-
- EA,eff
-
- [J mol−1]
-
- HCO
-
- [Pa m3 mol−1]
-
- mcat
-
- [kg]
-
-
- [mol s−1]
-
- r
-
- [m]
-
- rm,CO
-
- [molCO kgcat−1 s−1]
-
- rm,CO,H₂O
-
- [molCO kgcat−1 s−1]
-
- rm,CO,eff
-
- [molCO kgcat−1 s−1]
-
- rη
-
- [molCO kgcat−1 s−1]
-
- T
-
- [°C, K]
-
- XCO
-
- [–]
-
- z
-
- [m]
Greek letters
-
- ΔRHi
-
- [J molCO−1]
-
- ϕ
-
- [–]
-
- ηpore
-
- [–]
Abbreviations
-
- C2+
-
- Hydrocarbons with two and more carbon atoms
-
- (─CH2─)
-
- Methylene group of a normal paraffin
-
- FTS
-
- Fischer–Tropsch synthesis
-
- HC(s)
-
- Hydrocarbon(s)
-
- intr
-
- Related to intrinsic (chemical) reaction rate
-
- SI
-
- Supporting information


