Optimal Conditions Linked to the Reducing Agent on the Role of Morphology of Silver Nanoparticles
Abstract
This study optimizes silver nanoparticle synthesis using response surface methodology to predict particle size diameter. Factors including agitation frequency, flow, temperature, reducing agent concentration, and heating time were varied using citrate and borohydride separately. Particle size was measured via dynamic light scattering and morphology analyzed by transmission electron microscope. Regardless of the reducing agent, concentration most significantly influenced particle size. Interactions were also crucial. Sodium borohydride synthesis yielded small, narrowly distributed nanoparticles across various size ranges. The study demonstrates the production of nanometric particles suitable for diverse technological applications.
1 Introduction
Silver nanoparticles (AgNPs) have emerged as an arch product from the field of nanotechnology. The use of nanoparticles has been increased because of their improved chemical, optical, and mechanical properties [1-5]. Nowadays, the use of nanometallic particles, ranging from 1 to 100 nm, is an important area among different nanotechnology scientific fields [2-4]. Regarding their extremely small size, the metallic nanoparticles exhibit physicochemical properties substantially different from the macroscale materials, even when composed of the same material [5-7].
Nanoparticles have a high tendency to cluster and aggregate as they have different surface structures and interactions compared to submicron-sized particles. Therefore, it is important to develop techniques to properly control nanoparticles’ dispersion/aggregation phenomena and apply them to functional materials and products [8].
Several technological interest application investigations have focused on monodisperse colloids containing nanoparticles narrow in their size and shape [9]. Controlling the metal nanoparticles’ size, shape, and structure is technologically important because of the strong correlation between these parameters and material properties [10]. Recently, most of the investigations in nanotechnology were focused on the synthesis of ultrasmall fine particles (<10 nm). However, larger particles (>100 nm) are still required for some applications, such as to reduce AgNPs cytotoxicity for contact with some animal species [11]. For those reasons, controlling the sizes and shapes of metal nanoparticles (among them silver ones) is quite important and remains a challenge [9].
Solutions of AgNPs have distinctive colors arising from their tiny dimensions. At nanometric dimensions, the electron cloud can oscillate on the particle surface and absorb electromagnetic radiation at a particular energy. In this resonance (known as surface plasmon resonance or plasmon absorbance), solvent and surface functionalization are the key role contributors to the exact frequency and intensity of the band [10]. The silver nanoparticles display specific absorbance bands in their UV–Vis spectra. The charge density oscillations on silver nanoparticles are defined as localized surface plasmon resonance (LSPR) [3, 12-14], being very typical for silver nanoparticle colloids that occur as a sharp absorbance peak centered at approximately 400 nm [15]. The aggregation of colloidal silver particles causes a decrease in the intensity of the peak and results in a long tail at the higher wavelength side of the peak [16] and color alteration.
A variety of routes have been reported for the preparation of silver nanoparticles; notable examples include the reduction of an ionic salt in an appropriate medium using various reducing agents, such as sodium borohydride [17, 18], hydrazine hydrate, sodium citrate [19, 20], sulfite [21], other reducing agents [22], aerosol techniques [4], UV radiation [23], microwave irradiation [14], and electrochemical method [24]. Among many methods to synthesize silver nanoparticles, the chemical reduction has been extensively investigated because the synthesis can be carried out under simple and mild conditions and can be used to prepare nanoparticles on a large scale [3, 25, 26]. These methods, composed of metallic precursor, reducing agent, and stabilizer, commonly employ the reduction of silver nitrate using sodium borohydride (NaBH4) or sodium citrate (Na3Cit) as regular reducing agents. Silver nitrate is the most common source of silver ions [25, 27].
Chemical reduction methods of synthesis of silver nanoparticles normally lead to isotropic (it means spherical or pseudospherical) structures. Using Na3Cit, for example, the reduction of an aqueous solution of silver salts occurs at near-boiling temperature of the water. In this case, Na3Cit acts as both a reducing agent and stabilizer of the nanoparticles formed. In the case of the chemical reduction with NaBH4, the reaction occurs at near water freezing temperature (usually at ca. 2–5 °C) [28]. Sodium borohydride tends to produce small nanoparticles, but it is difficult to be applied in the synthesis of larger nanoparticles. On the other hand, large silver nanoparticles can easily be synthesized using citrate [29].
Particle size is influenced by solution temperature, concentrations of the metal salts and reducing agent and reaction time [14, 30]. Response surface methodology (RSM) is a mathematical and statistical technique that is useful for the modeling and analysis of problems in which a response of interest is influenced by several variables and the objective is to optimize this response [31]. There are many papers describing the procedures of synthesizing silver nanoparticles by chemical reduction, including, commonly, with citrate and borohydride reducing agents. However, there have been no reports about applying design of experiments (DOE) methods to the comparative synthesis of silver nanoparticles by chemical reduction with this respective reducing agent combined aimed to predict a nanometric particle size diameter.
Thus, the relevance of the present work is the prediction and control of the nanometric particle size range, which is necessary for an efficient silver nanoparticle application in different technological fields. Besides, this work demonstrated how to determine the operating conditions to minimize or maximize the size of the nanoparticles to attend to a specific application, for example.
2 Experimental Section
2.1 Materials
Silver nitrate (AgNO3, ≥99 %) and sodium citrate (Na3Cit, ≥98 %) were obtained from Cinética (São Paulo, SP, Brazil), and sodium borohydride (NaBH4, ≥98 %) was purchased from Sigma-Aldrich. All chemicals were used as received. Distilled water was used for all experiments.
2.2 Synthesis Procedure
Silver nitrate was used as a metal precursor, and AgNPs were prepared using the chemical reduction method. For Group A, silver nanoparticles were prepared using sodium citrate as a reducing agent. An aqueous solution containing 1 mmol of AgNO3 (125 mL) was placed in a three-neck round-bottom flask and vigorously stirred using Teflon-coated magnetic stirring bars. Then, portions of Na3Cit solution (30 mL) were added to the reaction mixture with a controlled temperature and flow rate. The synthesis parameters are shown in Tab. 1, and 27 experiments were carried out according to a fractional factorial design 25−1 (Supporting Information Tab. S1).
| Factors | Unit | Notation | Levels | ||||
|---|---|---|---|---|---|---|---|
| −α | −1 | 0 | +1 | +α | |||
| Group A: (Na3Cit) | |||||||
| Agitation frequency | [rpm] | x1 | 500 | 800 | 1100 | 1400 | 1700 |
| Flow (×10−5) | [kg s−1] | x2 | 6.2 | 13.2 | 19.6 | 25.6 | 31.7 |
| Temperature | [°C] | x3 | 40 | 50 | 70 | 80 | 100 |
| Reducing agent concentration | [mM] | x4 | 1 | 2 | 3 | 4 | 5 |
| Heating time after the synthesis | [s] | x5 | 0 | 10 | 20 | 30 | 40 |
| Group B: (NaBH4) | |||||||
| Agitation frequency | [rpm] | x1 | 500 | 800 | 1100 | 1400 | 1700 |
| Flow (×10−5) | [kg s−1] | x2 | 6.2 | 13.2 | 19.4 | 25.6 | 31.7 |
| Temperature | [°C] | x3 | 1 | 5 | 15 | 25 | 35 |
| Reducing agent concentration | [mM] | x4 | 1 | 2 | 3 | 4 | 5 |
By a similar procedure, Group B was prepared using sodium borohydride as a reducing agent as follows: AgNO3 solutions (20 mL) were added to the reaction mixture of NaBH4 (20 mL) with controlled temperature, flow, and stirring. Also, the synthesis parameters are shown in Tab. 1, and to this route, a total of 26 experiments were performed according to a central composite rotatable experimental design (Supporting Information Tab. S2). For Group B, the heating time was not evaluated once the temperature used in the experiments is low and close to room temperature. The particle diameter size was selected as the only response, or the dependent variable, for both Groups A and B.
To evaluate the effects and the interactions of the variables and find the optimum conditions that decrease the particle size, Pareto charts and the RSM were used. Analysis of variance (ANOVA), R2 (coefficient of regression) statistics, and residual graphs were used to check the adequacy of the developed model. The confidence level employed in this work was 95 % and p-values < 0.05 [32].
2.3 Samples Characterization
The particle size and size distribution of the synthesized silver nanoparticles in both Groups (A and B) were studied by the dynamic light scattering (DLS) using Zeta Sizer equipment (Nano-S-ZEN 1600, Malvern Instruments, UK) fitted measurement 20 runs per sample, with 1 s intervals between measurements, in a 10 mm path length glass cell (DTS 0012, disposable sizing cuvette) maintained at 25 °C.
The data were obtained with Software Dispersion Technology® version 4.2. The optical density maximum, LSPR and full width at half maximum properties were obtained from UV–Vis absorption spectra. The samples were measured at room temperature on a spectrophotometer (UV–Vis U-1900, Hitachi, Japan), in a 10 mm optical path quartz cuvette over a wavelength of 300–600 nm at a scan speed of 400 nm min−1.
The morphology of the samples was analyzed by TEM (Transmission Electron Microscopy, TEM JEOL JEM 1011) at the Central Laboratory of Electron Microscopy, at the Federal University of Santa Catarina (Florianópolis, SC, Brazil) operated at an accelerating voltage of 100 kV. TEM micrographs were recorded digitally. Samples for TEM were prepared by depositing a drop of AgNPs colloidal solution on a carbon-coated standard copper grid (300 meshes) and allowed to vacuum dry at room temperature.
3 Results and Discussion
3.1 Optimal Experimental Conditions: Group A (Na3Cit)
Silver nanoparticle size and shape manipulation is a complex process requiring a fundamental understanding of interactions between the reagents and other parameters affecting the particle formation procedure. In this work, an attempt was made to evaluate how the main factors are involved in nanoparticle synthesis and nucleation. Based on this, Fig. 1 shows the Pareto chart concerning the results of Group A, and Supporting Information Tab. S1 the experimental results of all tests.
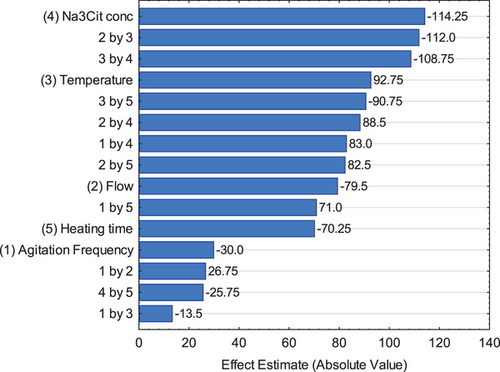
It is important to notice that statistical analyses of p-values split the possibilities into only two categories: The null hypothesis (no correlation) is significant or not. Rather than the p-value, the report of the level of evidence for the effect shows the range of possible modifications in particle size by the reaction parameters, indicating how large or small the effect might be to a confidence level and change in the dependent variable. Also, it is possible to observe positive, negative, or null effects in the response. This is an appropriate way to report the observed differences. The research question of which experimental condition is more effective in the control of the silver nanoparticles size could be evaluated by the results obtained, and by analyzing the order of the main effects, it is possible to observe that the agitation frequency has the slightest influence in response. This result could be confirmed by the magnitude of the effects summarized in Supporting Information Tab. S3.
Due to this behavior, a new experimental design was evaluated where the agitation frequency was not included in the data analysis [33]. In this way, a complete central composite rotatable design with four factors could be analyzed comprising the pure error (based on the replicate measurements) and lack of fit (based on the model performance), and results are summarized in Fig. 2 and Supporting Information Tab. S4 (ANOVA). It is important to note that the code numbers corresponding to the factors were maintained the same as used for the fractional factorial design; so, in this case, factors beginning in the number 2, once the agitation frequency (number 1) was not included.
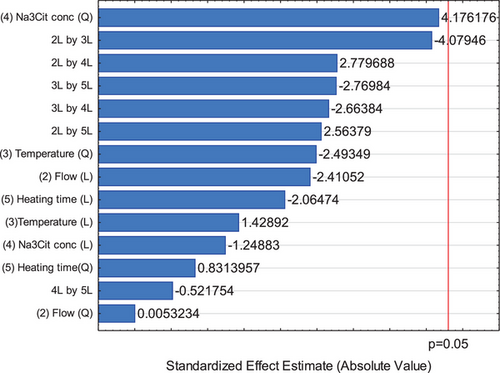
It could be observed that none factor or interactions were significant. However, as cited before, the magnitude of effects could be analyzed. In this sense, it is clear that the reducing agent concentration is the main effect that influences in the particle size. Moreover, with exception of the interaction between Na3Cit concentration and heating time, all others had more effect than main factors. This indicates that the parameters should be taken in account together for produce silver nanoparticles by Na3Cit.
Also, it is important to notice that in this analysis a significance value of 5 % was used. If this value is changed to 6 %, for example, Na3Cit concentration quadratic term and the interaction between this factor and the flow will be significative. This result could be observed by the p-value in the ANOVA (Supporting Information Tab. S4). The quadratic term of the Na3Cit concentration factor denotes that the region to operate the system for optimal levels of nanoparticles synthesis is not in the extremes of the experimental region but inside it, besides to prove that the model is not linear, and the central composite rotatable design was necessary to understand and optimize the process.
The p-value statistic has some limitations, and for small or medium samples (or with very strong effects), the absence of significance does not necessarily indicate that there is no effect [34]. Also, significance tests do not provide information about whether or not the result is replicable. Because of this, the evaluation of the mathematical model adjusted must be carried out to certify that it fits the description of the behavior of experimental data.
The model fit was compared with the experimental data using ANOVA (Supporting Information Tab. S4). The overall predictability of the model and its statistical significance were expressed by the coefficient of regression (R2) and Fisher test (F-value), respectively. R2 obtained suggested a good agreement between experimental and quadratic model-predicted values, i.e., the model describes the experimental data, indicating that 59.11 % of the deviation can be explained by the empirical model. However, it is still possible to affirm that there is interference of external factors, once the R2 was lower than 90 %. This variation about the results mean that the reduced R2 value could be explained by the methodology of determination of nanoparticle size, which is already a mean value in a particle size distribution. The adjusted R2 of 11.48 % reflects the percentage variation by only the independent variables that affect the response, demonstrating a high influence of interaction between factors in the response. Also, this parameter presented a low value once considers the number of independent variables in the model and penalizes the model for including irrelevant variables.
The lack of fit showed p-value of 0.137897, which denotes that the lack-of-fit test was not significant for the predicted model, implying that the experimental data were well fitted. This is a desired behavior once indicated that there are no contributions in the regressor–response relationship that are not accounted for by the model.
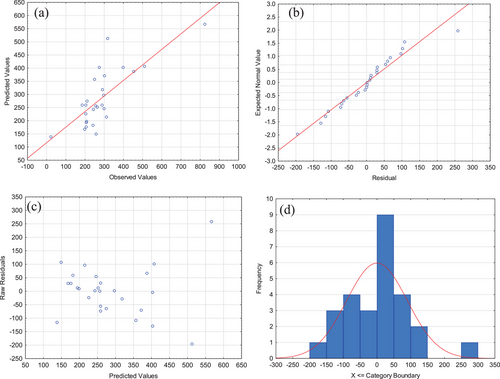
Fig. 3 shows the model adjustment for Group A. The results demonstrate that the model adjustment is in concordance with the experimental data (data are spread around the bisector—45° straight line), which state that the model can explain most of the experimental results obtained (Fig. 3a), and there is no obvious pattern of an experimental error, i.e., there is independency in the observations. Also, it can be seen the normality of the distribution and the proximity of the points in the normal perspective scheme on a line graph (Fig. 3b). Finally, Fig. 3c presents that the residual values appeared to be scattered randomly and naturally within the range, and Fig. 3d shows that residuals values presented a normal frequency distribution. Hence, according to all showed, the developed model is precise and has the satisfactory ability to predict the experimental data.
It is important to notice that results presented particle sizes >100 nm. Supporting Information Tab. S1 shows that only the treatment 24 (with upper value for temperature and all others at central point) produced silver nanoparticles. Thus, a desired point for a minimum response was obtained with agitation frequency of 1100 rpm, mass flow of 19.4 kg s−1, heating time after the synthesis of 20 s, reducing agent concentration of 3 mM and synthesis temperature of 100 °C.
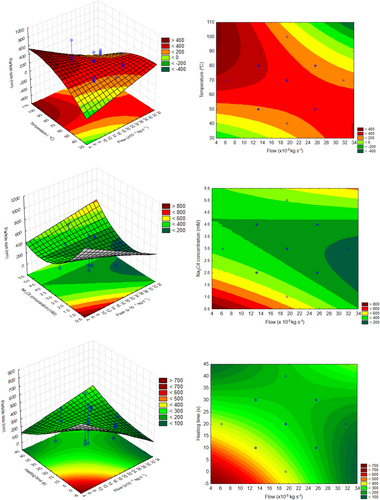
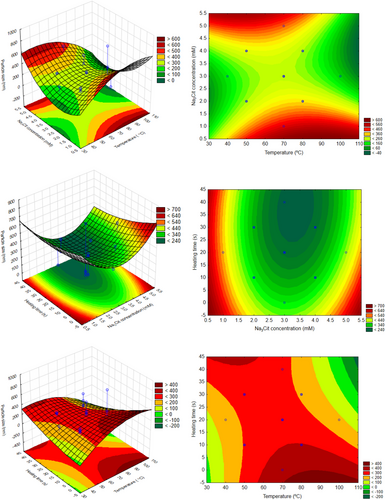
In this context, the experimental design with central composite was used aiming to determine the experimental conditions able to synthetize nanoparticle (<100 nm) and to predict different nanometric size ranges according to the conditions selected. Fig. 4 shows the surface responses, and it is possible to obtain combinations between two variables that produce silver nanoparticles. The interactions of the independent variables in the response are represented between two independent variables, the third of which was maintained at level 0 (central point value). It can be observed that the interaction between heating time and reducing agent concentration is the only one where the optimal value is obtained with a surface of minimum, all others being represented by a saddle. Also, when analyzing the influence of temperature with other factors, it is possible to visualize that higher values produce lower particle sizes. So, this is the region of interest for producing silver nanoparticles with sodium citrate as a reducing agent.
3.2 Optimal Experimental Conditions: Group B (NABH4)
Fig. 5 shows the respective Pareto chart of effects of Group B, and Supporting Information Tab. S5 presents the ANOVA results obtained in the Group B design to AgNPs synthesized using sodium borohydride as reducing agent.
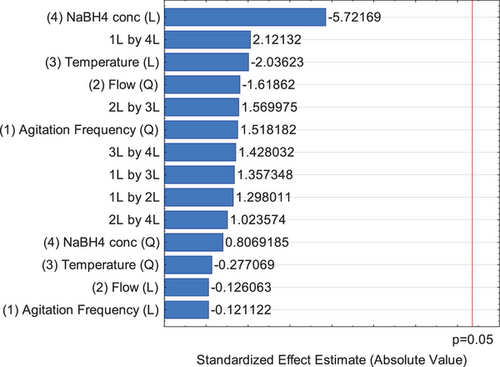
By Supporting Information Tab. S5 and Fig. 5, it is possible to observe that there is no significant influence of all of the factor's effect in this experiment design on the particle size, but as obtained before, the reducing agent concentration is the effect that most explain the results. The difference is that for NaBH4, this effect is negative and for Na3Cit is positive. So, using NaBH4 as reducing agent, it is recommended to use small concentrations to maximize the range of silver nanoparticles.
It is important to cite that if this analysis is carried out without the pure error and ignoring the lack of fit evaluation of the model, the NaBH4 concentration becomes a significant factor. This corroborates that this is an important factor in the production of silver nanoparticles with this reducing agent.
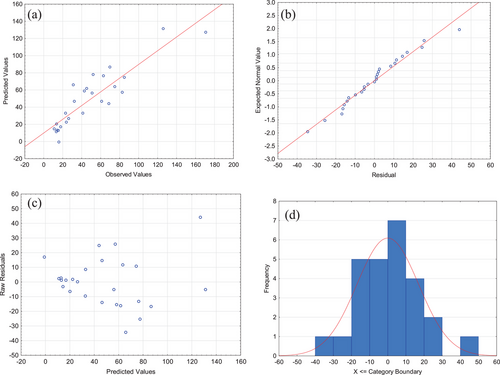
Fig. 6 shows the model adjustment for Group B, where results demonstrated the concordance with the experimental data (Fig. 6a), the normality of distribution (Fig. 6b), the residual values scattered randomly (Fig. 6c), and a normal frequency distribution for residues (Fig. 6d). So, as obtained for Na3Cit reducing agent, the developed model is precise and has the satisfactory ability to predict the experimental data for the tests with NaBH4.
The response surface graph and the contors to the data to AgNPs synthesized by NaBH4 (Group B) are shown in Fig. 7. Thus, it is possible to obtain several points with a nanometric response, and for those reason, it may be possible to state that sodium borohydride is more effective as a reducing agent to achieve different silver nanoparticles sizes. The obtained results could be interesting to select different particle size range for several nanotechnological applications. In other words, analyzing these results is possible to determine the operating conditions for produce nanoparticles near the minimum limit (e.g., 1 nm), or the maximum (100 nm). In this case, it is important to observe that the red color represents maximizing the size, and the green, minimizing.
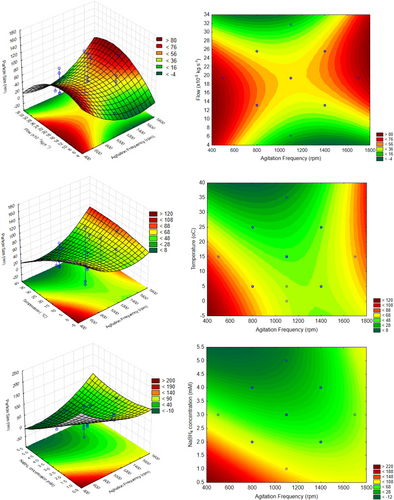
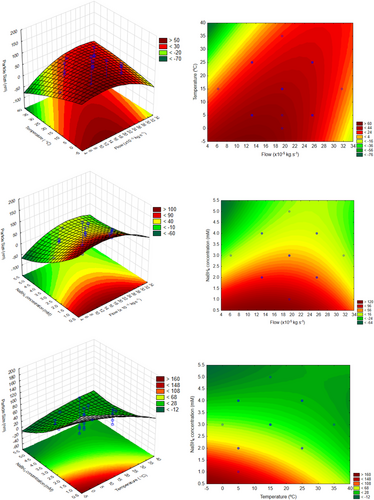
All these results demonstrated the interaction effects maintaining the other factors at the central point. Analyzing all together, it could be stated that for minimum values for particle size (near 1 nm, green region), it is recommended to carry out the reaction with medium agitation frequency and flow values, and high temperature and NaBH4 concentration. On the other hand, to produce silver nanoparticles around 100 nm (red region), low temperature and reducing agent are indicated, but the agitation frequency and flow remain at medium values. It is important to notice that according to Fig. 5, the interactions 1L by 4L (agitation frequency and reducing agent concentration) and 2L × 3L (flow and temperature) were the two with more influence. So, by the surface curves, it is possible to verify that low values from the medium (stated as optimum) for agitation frequency led to higher nanoparticles, and medium values for flow remain as optimum.
This could be corroborated by results presented in Fig. 8 where factor values are linked to desirability for minimum nanoparticle sizes (1 nm) or maximum (100 nm). For this figure, the desirability function was defined to maximize the nanoparticle size, but to interpreter the results aiming minimization, it is only necessary to invert the desirability curves.
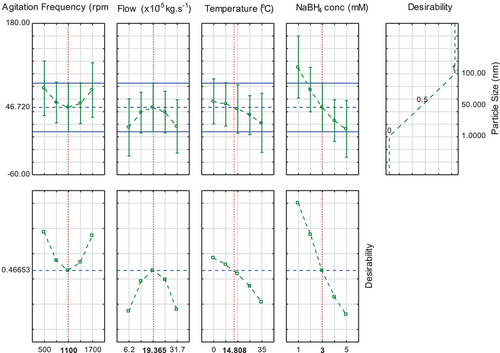
The results achieved demonstrate that different experimental factors can lead to different particle size range, proving the importance in the reaction factor selected in the nanoparticle synthesis and nucleation. The results indicate the importance in experimental design to predict and control the silver nanoparticle size.
3.3 Characterization of Silver Nanoparticles
Besides particle size as optimized response, the properties that can represent the final states of the various samples designed and produced by the experimental design were determined. Although many properties were measured, five properties for both synthesis groups were selected, as shown in Supporting Information Tab. S6, i.e., solution color, pH, optical density maximum, LSPR, and full width at half maximum to both synthesis groups.
It is known that in the case of silver nanoparticles, the UV–Vis absorption spectra are very sensitive to the particle size and their aggregation state as the silver nanoparticles strongly absorb in the visible region due to surface plasmon resonance [35]. UV–Vis spectra give considerable information about the growth and shape-size accord of nanoparticles. It is pertinent to mention that the Plasmon peak and the full-width of half-maximum (FWHM) depend on the extent of colloid aggregation.
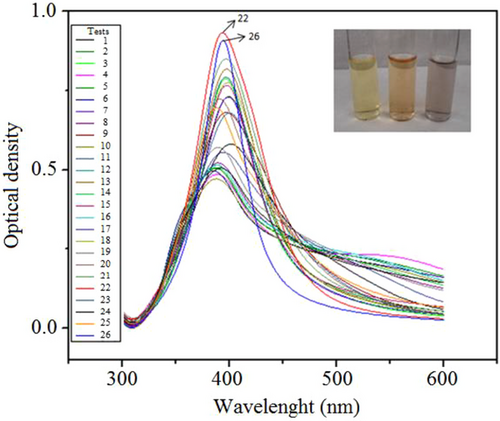
Colloidal aggregation resulting in larger particle size often leads to red shift in the spectrum. As we know, when the solution system is monodisperse (narrow size distribution), the peak shape is symmetric and the value of the FWHM is smaller. When the system is polydisperse, the peak shape is asymmetric, which suggests that the peak actually consists of two or more absorption peaks [36]. UV–Vis spectra were collected of AgNPs synthesized at Group A (Fig. 9) and Group B (Fig. 10) experimental conditions.
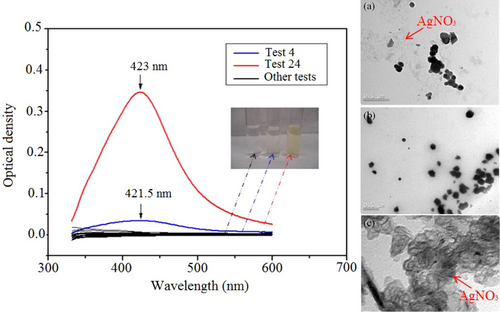
Many samples synthetized by sodium citrate (Group A) contained large particles (>100 nm), and no absorption peak was observed in UV–visible spectra of most AgNPs, corresponding to the colorless and yellow clear samples of the colloidal solutions (Fig. 9). It can be seen in the micrographs, where the crystals of the AgNO3 precursor had no reduction, probably because the reduction reaction to synthesize AgNPs by Na3Cit was incomplete under those experimental conditions.
The concentration of citrate ions could inhibit or promote nanoparticle growth, dictating the size, distribution, and concentration [36-38]. Only an experimental condition was effective to synthesize silver nanoparticles (Fig. 9c, insets), and it corresponds to the Test 24 of experimental design, which made possible the definition of the heating time after the synthesis of 20 s and the concentration of the citrate of sodium in 3 mM in agreement with the area obtained in the RSM. The pH values change from 6.62 ± 0.04 to 7.93 ± 0.06.
AgNPs synthesized by Group B show the plasmon peak shape changed visibly from asymmetric to symmetric between all samples of experimental design, and the peak became narrower to two tests (22 and 26 tests—Supporting Information Tab. S2) as shown in Fig. 10. These results correspond to the FWHM values (Supporting Information Tab. S6) and mean that the size distribution becomes narrower, because the colloid system changes from polydispersion index to monodispersing in agreement with both synthesis conditions. The color change can also be the size change process and could be directly visualized (Fig. 10, inset), in which aggregation begins as the yellow colloidal solution turns a darker yellow or orange, and eventually gray, after which the colloid breaks down and particles settle out.
UV–Vis absorption bands are confirmed by size distribution intensity histograms, depicted in Fig. 11. Size distribution histograms were collected by DLS for the selected synthesis routes (Group A—Tests 4 and 24; Group B—Tests 22 and 26) investigated.
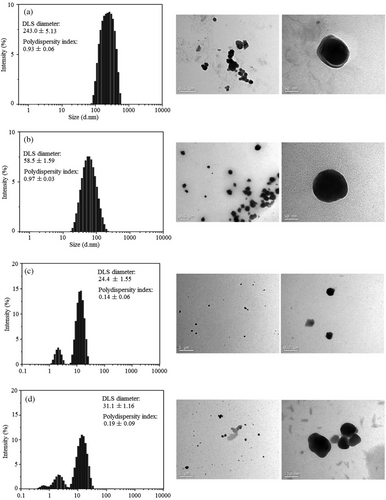
Ag nanoparticles synthesized using Na3Cit (Group A) (Fig. 11a,b) were spherical and broad particle distribution. They had a mean size of 243 ± 5.13 nm to Test 4 and 58.5 ± 0.97 nm to Test 24. Wojtysiak and Kudelski [28] reported that in the standard citrate method (reduction of silver salt with citrate at near boiling temperature), initial reduction of Ag+ to Ag0 occurs within about 2 min, and the initially formed particles are large and polydisperse.
AgNPs synthesized using NaBH4 (Group B) (Fig. 11c–d) were spherical too and had a narrow size distribution, but they had a dual size. The mean particle size is 24.4 ± 1.55 nm to Test 22 and 31.1 ± 1.16 nm to Test 24. When using NaBH4 as reducing agent, we observed that it reflects better in TEM images and a moderate increase in the nanoparticle sizes.
The nanoparticle size can be different depending on the following three different situations described by Chen and Wu [39]. (1) If the number of nuclei increased faster than that of total ions, smaller particles would be obtained. (2) If the increase of nucleus number was proportional to that of the total ion number, the particle size might remain unchanged. (3) When the number of nuclei remained constant or increased slower than the increase of ion concentration. Based on the above observation, our case appears to belong to the first situation when NaBH4 is used and to the third situation when Na3Cit is reducing agent.
According to Pillai and Kamat [37], the early stage influence of citrate ions in nanoparticle synthesis through complexation with Ag2+ intermediates leads to the slow transformation of the Agn+-citrate to AgNPs. They demonstrate that varying the citrate ion concentration influence's reaction rates, particle size, and plasmon absorbance band position. These observations agree well with the above UV–Vis spectroscopic results. It is known that nucleation and AgNPs growth occur simultaneously during synthesis process [35]. The increase of mean particle size can be followed by the red shift of the SPR band. Indeed, the decrease of mean particle size can be followed by the blue shift of the SPR band.
Therefore, all the characterization results are in accordance with the already obtained results from experimental planning. The impact of the operation conditions of each stabilizing agent employed are key parameters aiming to produce stable and monodisperse AgNPs.
4 Conclusions
The experimentation strategy used in this work enabled to study the silver nanoparticles production systematically. Surface response methodology was applied to study the influence of factors and to construct data-driven models useful for process optimization and to understand the magnitude of interactions between the factors studied. By the results presented in this work, the mean size and size distribution of AgNPs could be adjusted by changing the reaction conditions.
The optimum reaction conditions using sodium citrate as reducing agent found of the mass flow, heating time after the synthesis, synthesis temperature, agitation frequency (rpm) and citrate concentration were 13.2 × 10⁻⁵ kg s−1, 40 s, 100 °C, 1100 rpm, 3 mM, respectively. Using sodium borohydride as reducing agent the reaction conditions vary according to the desirability.
The results indicate that small and narrower sizes of silver nanoparticles were obtained using NaBH4, possibly due to the stronger reducing agent behavior. According to all results obtained, the chemical reduction process by NaBH4 selected in the study apparently is more viable, since using faster mass flow and lower synthesis temperature, we were able to produce smaller and narrower AgNPs (<35 nm).
Supporting Information
Supporting information for this article can be found under DOI: https://doi.org/10.1002/ceat.70035.
Acknowledgments
Financial support from the CAPES (Finance code 001), and CNPq and infrastructure support from the LCP and LCME laboratories, Federal University of Santa Catarina (UFSC) are gratefully acknowledged. The Article Processing Charge for the publication of this research was funded by the Coordenação de Aperfeiçoamento de Pessoal de Nível Superior - Brasil (CAPES) (ROR identifier: 00x0ma614).
The authors declare no conflict of interest.
Author Contributions
The manuscript was written through contributions of all authors. All authors have given approval to the final version of the manuscript. Estela M. F. de Sá: Conceptualization; data curation; methodology; formal analysis; writing—original draft. Angelo O. Silva: Data curation; formal analysis, writing—review and editing. Rita de Cássia S. C. Valle: Methodology; data curation; formal analysis; investigation; writing—review and editing. Cintia Marangoni: Methodology; data curation; formal analysis; investigation; writing—review and editing; Ariovaldo Bolzan: Supervision; conceptualization; funding acquisition; project administration; validation. Ricardo A. F. Machado: Supervision; conceptualization; funding acquisition; project administration; validation; visualization; writing—review and editing.
Open Research
Data Availability Statement
Data is available on request from the authors. The data that support the findings of this study are available from the corresponding author upon reasonable request.


