Forced Periodic Operation of Methanol Synthesis in an Isothermal Gradientless Reactor
Abstract
Methanol synthesis from synthesis gas with heterogeneous Cu/ZnO/Al2O3 catalysts in an isothermal gradientless reactor is described. In a theoretical study, the potential of forced periodic operation (FPO) for improving reactor performance in terms of methanol production rate and methanol yield is explored. The approach is based on a detailed kinetic model and combines nonlinear frequency response (NFR) analysis with rigorous numerical multi-objective optimization. Optimal steady-state operation is compared with optimal forced periodic operation for a given benchmark problem with and without inert nitrogen in the feed. Further, the significant influence of the saturation capacity of the solid phase on the dynamic behavior in response to step changes and periodic input modulations is studied.
1 Introduction
Methanol is produced in large amounts from synthesis gas using heterogeneous catalysts 1. In the context of numerous activities to exploit power and to store energy, there is currently increasing interest and demand for this alcohol 2, 3. Various types of fixed-bed reactors are industrially applied to synthesize methanol 4. Due to kinetic reasons, besides CO, also smaller amounts of CO2 are present in the feed stream. The essential overall reactions are the hydrogenations of both CO and CO2 and the reverse water-gas shift reaction. The reduction in the mole numbers and the thermodynamic properties of the components involved require operation at elevated pressure. Due to the strong exothermicity of the hydrogenation reactions, significant cooling is needed. The currently widely applied Cu/ZnO/Al2O3 catalysts are exploited at temperature between 220 and 270 °C and at pressures around 50 bar 2, 4.
Methanol synthesis reactors are currently designed to operate under steady-state conditions. In contrast, it is known that forced dynamic operation based on perturbing periodically certain input parameters possesses the potential for process improvements 5. In the last years, the nonlinear frequency response (NFR) method 6, 7 and advanced multi-objective optimization tools 8, 9 have been developed, which support evaluating the potential of advanced forced periodic operation compared to traditional steady-state operation. An important recent result is the fact that it is very attractive to perturb two inputs simultaneously and to exploit a phase shift between these perturbations as an additional degree of freedom 10.
The key ingredient required to apply these theoretical concepts is the availability of a validated and sufficiently accurate dynamic process model. Considering the heterogeneously catalyzed methanol synthesis, a process model must consist of two equally challenging submodels. At first, there is a model needed that describes the rates of the reactions on the surface of the catalyst in the parameter space relevant for the periodic regime considered. This model needs to be combined with a reactor model that describes the concentration and temperature fields in the reactor of interest.
In this paper, we rely on the results of an extensive earlier experimental study on the steady state as well as dynamic transient behavior using a commercial Cu/ZnO/Al2O3 catalyst 11. To generate well-defined results and to simplify the reactor model required to analyze the results, methanol synthesis was performed in a gradientless reactor of the Berty type 12, 13 under isothermal and isobaric conditions. In these experiments, CO was the main carbon source, complemented by minor amounts of CO2. The additional application of an inert gas in the feed (nitrogen) allowed measuring the degree of gas contraction. The large data set generated was of high quality and fulfilled the mass balances of all compounds involved very well 11. A more recently performed deeper analysis of the available data led to the formulation and successful parameterization of a kinetic model 14, 15, which describes the data and provides the basis for the present work.
In this paper, the potential of forced periodic operation of methanol synthesis is studied theoretically using the NFR method and multi-objective optimization. For simplicity, an isothermal isobaric continuous stirred-tank reactor (CSTR) is considered representing a Berty type of reactor. The present paper extends the results in 16-18. In 17, it was shown for a given benchmark problem that up to 33.51 % improvement of the methanol flow rate is possible in forced periodic operation compared to steady-state operation, if the focus is only on this objective.
It was shown in 17, 18 that methanol flow rate and methanol yield based on total carbon in the feed can be improved simultaneously if multi-objective optimization is applied. For multi-objective optimization, maximum improvement of the methanol flow rate was approximately 27 %, and maximum improvement of the yield was about 4 % 17 for a given operating point on the Pareto front. Results were obtained for simultaneous forcing of CO in the feed and the total volumetric feed flow rate, which was found most promising. According to 11, a mean value 15 % of nitrogen in the feed was considered. In the present paper, the optimization methodology introduced in 18 is extended. As a consequence, additional solution branches are found for the case with inert nitrogen. In addition, also industrially more relevant cases without inert nitrogen are considered.
2 Theoretical Methods
2.1 Kinetic Model
 ()
() ()
() ()
()The lumped kinetic model assumes a Langmuir-Hinshelwood mechanism comprising the adsorption of reactants, surface reaction, and desorption of products. Adsorption and desorption are assumed to be in quasistatic equilibrium, which seems reasonable in view of the time constants of the dynamic processes to be considered subsequently, which lie in the range of 10 s with inert nitrogen up to 10 min without inert nitrogen.
-
oxidized sites
 for CO hydrogenation,
 -
reduced sites * for CO2 hydrogenation,
-
and active sites
 for heterolytic water decomposition.
 ()
() ()
() ()
() ()
() ()
() ()
() ()
() ()
() ()
()The model describes with the parameters given in Tab. 1 the steady state and experimental data from 11 with good accuracy. A comparison with dynamic data will be discussed in Sect. 3.
|
Parameter |
Value |
Units |
Parameter |
Value |
Units |
|---|---|---|---|---|---|
|
Ak,CO |
0.00673 |
[mol s−1kgcat−1bar−3] |
KCO |
0.1497 |
[bar−1] |
|
BCO |
26.4549 |
– |
|
0 |
[bar−1] |
|
|
0.043 |
[mol s−1kgcat−1bar−3] |
|
0.0629 |
[bar−1] |
|
|
1.5308 |
– |
|
0 |
[bar−1] |
|
Ak,RWGS |
0.0117 |
[mol s−1kgcat−1bar−3] |
ΔG1 |
0.3357 × 10³ |
[J mol−1] |
|
BRWGS |
15.6154 |
– |
ΔG2 |
21.8414 × 10³ |
[J mol−1] |
|
|
1.1064 |
[bar−1/2] |
|
7.9174 × 10³ |
[s−1] |
|
|
0 |
[bar−1] |
|
0.188 × 10⁻⁴ |
[s−1] |
|
|
0 |
[bar−1] |
ϕmax |
0.9 |
– |
|
KO |
0 |
– |
|
|
|
2.2 Reactor Model
 ()
() ()
() ()
()Species to be considered are CH3OH, CO2, CO, H2, H2O, and N2 for the cases with inert nitrogen. Assuming further a constant total pressure p, the molar outflow  follows from the overall material balances (see 18 for a detailed discussion). Process parameters used in this contribution are given in Tab. 2.
|
Parameter |
Value |
Units |
|---|---|---|
|
p |
60 |
[bar] |
|
T |
473 |
[K] |
|
|
0.15 |
[–] |
|
F |
0.114 |
[mL s−1] |
|
VG |
10.3 |
[mL] |
|
mcat |
3.95 |
[g] |
|
qsat |
0.98 |
[mmol g−1] |
In these equations, the right-hand side reflects the rates of changes due to inflow, outflow, and chemical reaction. On the left-hand side,  and
and  represent the mole numbers of component i in the gas and the solid phase, respectively.
  is the mole fraction of component i in the gas phase, and
  is the total coverage of component i at the different active centers of the solid phase. As already mentioned in the previous section, adsorption equilibrium is assumed between the solid and the gas phase. Under these assumptions, the coverages
  follow from the adsorption isotherms depending on the gas phase composition. Hereby, qsat is the saturation adsorption capacity of the solid phase.
The evaluation of  in Eq. 13 requires careful consideration and is described in detail in 18. The contribution of
  on the left-hand side of the material balance (13) is often neglected and will be considered in some more detail in the remainder. Obviously, it does not play a role at steady state where the time derivative on the left-hand side is equal to zero. Therefore, it affects only the dynamics. The strength of this effect depends essentially on the saturation capacity qsat. This effect is illustrated in Fig. 1 for different values of qsat and compared to the dynamic experimental data from 11, where the carbon feed starts with a pure CO feed (yCO = 12.6 %, yH2 = 72.2 %, and yN2 = 16 %) to establish an initial steady state.
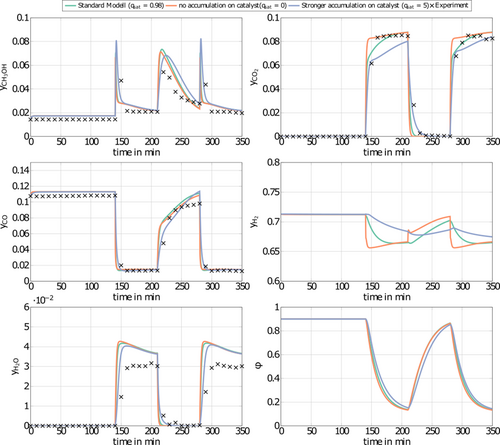
After 140 min it is switched to pure CO2 (yCO2 = 11.9 %, yH2 = 71.5 %, and yN2 = 16.6 %) again to pure CO at 210 min and back at 270 min. Constant conditions over the whole run are the temperature (T = 523 K), the pressure (50 bar), and the space velocity w.r.t the inlet flow (240 mL min−1). In this figure, ϕ is the fraction of reduced centers on the catalyst surface 14, 15. If  is neglected (i.e., qsat = 0 mol kgcat−1), the gas phase mole fractions change almost instantaneously in response to feed changes due to the small storage capacity of the gas phase. In contrast to this, for finite values of qsat a significant lag is observed. A value of qsat = 0.98 mol kgcat−1 was found to fit the experimental data best. For comparison also a storage value of qsat = 5 mol kgcat−1, reflecting a catalyst material with very high storage capacity and therefore a slower response, is given. The effect of the saturation capacity on forced periodic operation will be further discussed below in Sect. 3.
2.3 Nonlinear Frequeny Response (NFR) Method
There are many ways of operating a system periodically, e.g., it is possible to periodically modulate different inputs or input combinations, using various forcing parameters, i.e., forcing frequency, input amplitude(s), and phase differences between the inputs. This richness of possible forcing strategies also produces a challenge to find which forcing strategy is to be used in order to achieve the highest possible improvement (see, e.g., 5, 19-21). One of the answers to this challenge is to apply the NFR method, which offers a systematic approach to the search for the best scenario. The NFR method is an approximate, but reliable analytical tool for evaluating possible improvements, which should be used in early stages of process development before rigorous numerical simulation and before experimental investigation 16, 17, 22.
The NFR method is a theoretical and powerful tool, mathematically based on Volterra series, generalized Fourier transforms, and the concept of higher-order frequency response functions (FRFs) 6, 22, 23. In practice, the nonlinear model of the investigated system is replaced by a set of frequency response functions of different orders. The derivation procedure of these FRFs is standardized 24. Although these analytical derivations can be tedious and time-consuming, especially for complex systems, the numerical burden associated with the application of the NFR method is practically negligible in comparison to classical numerical approaches. The recent introduction of a software application for automatic derivation of the FRFs, the so-called computer-aided nonlinear frequency response (cNFR) method 25, substantially facilitates the derivation of the needed FRFs.
 ()
()Based on the NFR method, the change of the reactor performances caused by forced periodic operations can be evaluated from the non-periodic (the so-called DC) component of the frequency response of the reactor.
 ()
()In Eq. 17,  is the asymmetrical second-order (ASO) FRF,
  the asymmetrical fourth-order FRF, etc.
 ()
()Eq. 18 is the foundation of the NFR method for evaluating periodic operations with one modulated input. Therefore, for single input modulations of, e.g., input x, the DC component is proportional to the second-order asymmetrical frequency response function (ASO FRF)  relating the output of interest (y) and the modulated input (x), meaning that for single input forced periodically operated chemical reactors it is enough to derive and analyze only one FRF 16.
For simultaneous modulation of two inputs, the DC component is evaluated based on three FRFs, where two of them are correlating the output of interest to the two modulated inputs separately and one cross FRF which correlates the output to both modulated inputs. It should be pointed out that the cross effect of two inputs strongly depends on the phase shift of simultaneous modulation of those two inputs and that it is possible to achieve high improvement for simultaneous modulation of two inputs even for the cases when separate input modulations would not lead to improvement at all. The influence of the forcing parameters (frequency, amplitudes, and phase shift of the input modulations) on the possible improvement can also be determined by the NFR method 23.
 ()
() between them, the separate contributions of the two inputs to the DC component can be approximately evaluated from the corresponding asymmetrical second-order FRFs, in the same way as explained above:
 ()
() ()
() is the so-called cross ASO term, which correlates the output y with both modulated inputs (x and z). It is a function of both frequency and phase difference between the two modulated inputs, and is evaluated based on the cross asymmetrical second-order FRF (
 ), in the following way:
 ()
() ()
()and should be calculated for a chosen set of forcing parameters (forcing frequency, forcing amplitudes, and phase difference) 7, 24. In principle, it is possible to find a set of forcing parameters resulting the periodic operation with highest improvement 7, 23, 24.
The phase difference is a crucial parameter for a periodic operation with simultaneous modulations of two inputs, considering that by choosing the optimal phase difference the cross-effect can be maximized 7, 10, 23, 24.
Results for methanol synthesis specific for the gradientless isothermal, isobaric, lab-scale micro Berty reactor will be discussed in Sect. 3.
2.4 Optimization Methods
 ()
() ()
()The evaluation of the objective functions for the NFR method is given in the Appendix. For the computation of Pareto optimal steady- state and forced periodic solutions, a benchmark problem with given temperature, pressure, volume, average volumetric feed flow rate F, catalyst mass mcat and, for Sect. 3.1, average inert nitrogen concentration in the feed  according to Tab. 2 is considered. The reactor dimension and the catalyst mass correspond to the experimental study of 11, which is the starting point for a parallel ongoing new experimental study.
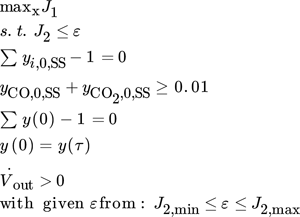 ()
()Here, the solution of the previous point is used as an initial guess for the current point. If the solver fails to converge, the calculation is redone by perturbing the initial values until convergence is achieved.

In contrast to 18, the underlying single objective optimization problems were solved using a simultaneous approach by discretizing the model in time using finite differences with 500 equidistant time steps per period.
 ()
() ()
() .
.
 ()
()For the industrially relevant operation without inert nitrogen this compensation was done by countercurrent periodic forcing of H2.
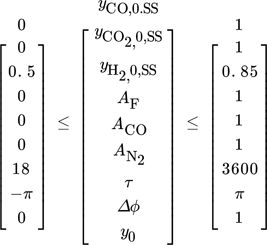 ()
()The single objective optimization problems were solved with Julia 28, applying the JuMP 29, a domain-specific modeling language for mathematical optimization. One of the major benefits of using JuMP is the capability of employing (forward mode) automatic differentiation (AD), which outperforms other (non-AD) algorithms in speed and accuracy 30. The applied nonlinear solver is Ipopt 3.13.4.
In summary, it is found that the improved optimization methodology applied in this paper is much more robust and efficient than the methodology applied earlier in 18.
3 Results and Discussion
3.1 Optimization with Inert Nitrogen
Using first the NFR method it was found in preliminary studies that single input modulation does not provide potential for significant improvement of reactor performance in terms of the objectives (methanol flow rate and yield) introduced in the previous section 16. The best potential for improvement was found for simultaneous modulation of the flow rate and the CO feed concentration 17. Improvements of up to 33.51 % of methanol production (single objective) were reported and further studied with multi-objective optimization. The results of the approximate NFR method were validated with numerical simulation of the full blown model described above for selected operating points in 17.
Further comparison between multi-objective optimization with the NFR and the full model is depicted in Fig. 2 for the conditions described in 17. In this figure, optimal steady-state operation is compared to optimal forced periodic operation as predicted by the two different approaches. Again, very good agreement between both approaches is found together with a significant potential for improvement of the methanol production rate in the left part of Fig. 2a. The periodic time required is about 18 s and the optimal phase shift between flow rate and CO inlet concentration is close to zero as shown in Fig. 2b. Consequently, there is periodic change between high CO feed flow rate, and afterwards the flow rate is reduced and CO is reacted away. In contrast to this, on the right side of the diagram (high yield region) not much improvement is found 17, 18.
In the remainder, results are extended step by step using numerical optimization of the full model. In a first step, a constraint on the volumetric outflow of the system is added. This is required since methanol synthesis is volume reducing and the feed flow rate at the input becomes zero at the minimum for large amplitudes of AF = 1 in Fig. 2b. Results are presented in Fig. 3a.
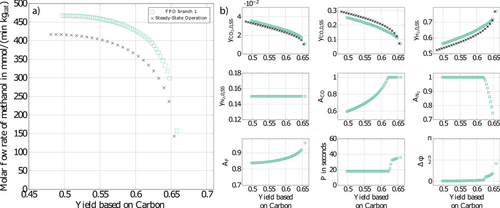
At steady state, outlet volumetric flow rate non-negative was always satisfied, so that the steady-state Pareto front marked by the black crosses does not change. The effect on the Pareto front of forced periodic operation is also relatively small compared to the previous Fig. 2. Again, big improvements in terms of the methanol flow rate are found in the left part of Fig. 3, and minor improvements in the right part. Due to the additional constraint, improvements are reduced a little with a maximum reduction of about 2 % on the left side of the figure compared to Fig. 2. Due to the additional constraint of a non-negative outlet volumetric flow rate, the corresponding optimal forcing amplitude AF is now restricted to values lower than 1 in Fig. 3b. The operating conditions in Fig. 3a essentially correspond to the base case which was considered in 18.
However, more recent calculations with the improved optimization methodology presented in this paper reveal that there exists an additional branch of the Pareto front which also predicts significant improvements compared to steady-state operation in the high yield part of the Pareto plot. This second branch is illustrated in Fig. 4a in red. The existence of the second branch of the Pareto front can be explained with the presence of multiple local minima of the present nonconvex optimization problem (see, e.g., 31). Depending on the initial guesses either the green or the red branch in Fig. 4a is found.
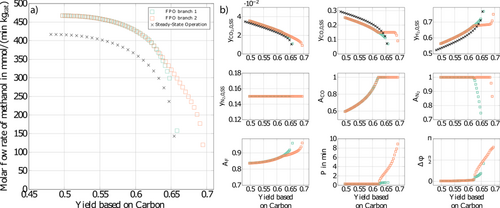
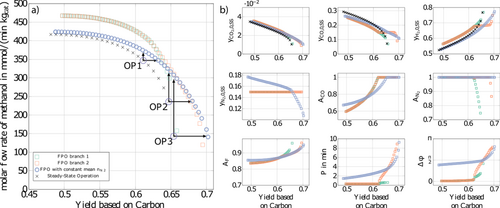
After careful inspection using a refined multi-start approach no further branches were found. In principle, deterministic global optimization could be applied to prove that no better solutions exist than the red branch 31. This, however, was not done due to the high computational effort. It is worth noting that the optimal forcing parameters along this second red branch are completely different from the previous green branch as shown in the diagram of Fig. 4b. In particular, the periodic time is now in the range of minutes with an increasing phase shift as we proceed to higher yields. Both branches merge at a yield of about 0.63.
 ()
()Results are illustrated as blue curves in Fig. 5 together with the branches from Fig. 4. It is shown that the potential for improvement in the right part of the diagram is even higher than the red curve, whereas the potential for improvement in the left part of the diagram is reduced. Periodic times are in the range of minutes, similar to the red branch. Phase shift in particular in the left part of the diagram is higher compared to the previous red and green curves. Improvements using forced periodic operation for chosen operating points can be found in Tab. 3.
|
OP |
|
YSS |
|
YFPO |
|---|---|---|---|---|
|
[mmol min−1kgcat−1] |
[%] |
[mmol min−1kgcat−1] |
[%] |
|
|
OP1 |
347 |
61.1 |
370 (+6 %) |
63.2 (+3.4 %) |
|
OP2 |
236 |
64.7 |
316 (+34 %) |
68.0 (+5.1 %) |
|
OP3 |
143 |
65.4 |
298 (+108 %) |
70.1 (+7.1 %) |
3.2 Optimization without Inert Nitrogen
As mentioned above, the operating conditions considered in the previous section were inspired by the lab-scale experiments of 11. In these experiments, the changing amounts of the inert nitrogen were used to quantify the contraction of the gas mixture due to the stoichiometry of the reactions. In industrial processes, however, depending on the source of the feed mixture, often only very little or no inert nitrogen is present 2, 4. Therefore, the focus in this section is on optimal steady-state operation compared to optimal forced periodic operation without inert nitrogen in the feed. Again, periodic forcing of the CO feed concentration and the total volumetric feed flow rate is applied. To satisfy the closure condition at any time point, now H2, instead of N2, is used for compensation.
Results are illustrated in Fig. 6. In general, methanol production rates are higher for both, steady-state and forced periodic operation, due to more reactants in the feed than for the case with inert nitrogen discussed in the previous section. Most improvement is found in the high yield part of Fig. 6a. There, the methanol yield can be improved through forced periodic operation for a given production rate, or the methanol flow rate for a given yield. The latter effect is particularly large in the high yield region. The methanol flow rate for the highest steady yield is almost doubled. Instead for low yields, in the left part of the diagram hardly any improvement is found. This situation is qualitatively similar to Fig. 5 with inert nitrogen and an additional constraint for the inert nitrogen feed flow rate. Again, the optimal periodic time is in the range of minutes and the optimal phase shift is in the range of π/2. Improvements using forced periodic operation for chosen operating points can be found in Tab. 4, which are in the some order of magnitude as the results with inert gas.
|
OP |
|
YSS |
|
YFPO |
|---|---|---|---|---|
|
[mmol min−1kgcat−1] |
[%] |
[mmol min−1kgcat−1] |
[%] |
|
|
OP1 |
453 |
64.2 |
482 (+6 %) |
66.3 (+3.2 %) |
|
OP2 |
352 |
66.6 |
445 (+26 %) |
69.9 (+5 %) |
|
OP3 |
238 |
67.3 |
430 (+80 %) |
≈71.2 (+5.8 %) |
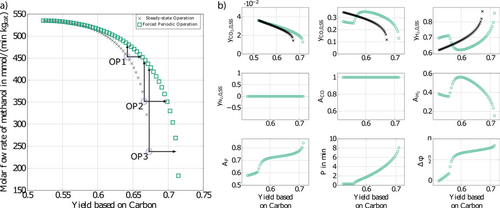
Further insight is provided by evaluating the corresponding average molar feed rates of the three different feed components in Fig. 7. Improvement of forced periodic operation is achieved, with increased feed amounts of CO and CO2 and a reduced amount of H2. This seems to be particularly attractive for power-to-methanol processes (see, e.g., 1, 3, 32, where H2 is generated via electrolysis with regenerative electrical energy and is therefore often more expensive. For the interpretation of the results it should be emphasized that both curves, i.e., the black for steady-state operation and the green for forced periodic operation, are optimal for the given objectives and constraints.

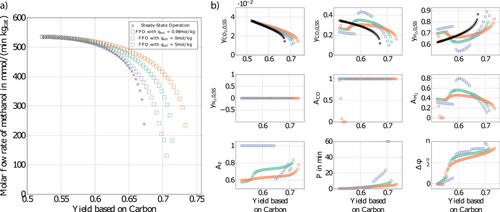
Finally, the effect of the saturation capacity of the catalyst qsat on forced periodic operation is discussed. Results are presented in Fig. 8. As qsat increases, the Pareto fronts of forced periodic operation tend towards the Pareto front of steady-state operation and improvements are getting smaller and smaller. This is consistent with the observations in Sect. 2.2, where it was shown that a finite saturation capacity of the solid phase introduces an additional lag. Such a lag will lead to a dampening of the forced periodic solution bringing it closer to steady-state operation. Knowledge regarding the adsorption saturation capacity of the catalyst qsat is therefore an important quantity for a reliable prediction of the potential for improvement through applying am optimized forced periodic operation. It appears to be essential to tune this catalyst property for an efficient periodic production of methanol.
4 Conclusion
Results of a theoretical study to exploit the potential of forced periodic operation for methanol synthesis are presented. Exploiting a validated kinetic model for a commercial Cu/Zn/Al2O3 catalyst, which captures essential dynamic features, it was demonstrated that for well-selected forcing parameters using optimized amplitudes, frequency, and phase shift significant improvements can be expected compared to conventionally applied steady-state operation.
The study was based on a powerful theoretical approach, combining nonlinear frequency response analysis with rigorous numerical multi-objective optimization of the full model. Results were presented for a gradientless isothermal CSTR operated under isobaric conditions with and without inert nitrogen in the feed. An increase of up to 108 % regarding the average molar flow rate of methanol and up to 7.2 % for the yield is predicted for the case with inert nitrogen. For the case without inert gas, improvements up to 80 % for the average molar flow rate and up to 5.8 % for the yield are possible. Future work will focus on the experimental validation of the findings and an extension to nonisothermal fixed-bed reactors as applied in industry.
Acknowledgements
Financial support by the German Research Foundation (DFG) is gratefully acknowledged through the priority program SPP 2080 under grant KI 417/6-2, NI 2222/1-2, SE 586/24-2.
The authors have declared no conflict of interest. Open access funding enabled and organized by Projekt DEAL.
Symbols used
-
- Ax [–]
-
amplitude of input of CO, N2 or volumetric flow rate
-
- F [m3s−1]
-
volumetric flow rate
-
- G [–]
-
frequency response function
-
- J [–]
-
objective function
-
- mcat [kg]
-
mass of catalyst
-
- n [mol]
-
molar amount
-
 [mol s−1]
 -
molar flow rate
-
- p [bar]
-
pressure
-
- qsat [mol kgcat−1]
-
adsorption capacity
-
- r [mol s−1kgcat−1]
-
rate of reaction
-
- VG [m3]
-
volume of gas phase in the reactor
-
- y [–]
-
mole fraction
Greek letters
-
- Θ [–]
-
relative number of free surface centers
-
- ϕ [–]
-
fraction of reduced surface centers
-
- Δϕ [–]
-
phase shift calculated by numerical optimization
-
 [–]
[–] -
phase shift calculated by NFR method
-
- τ [s]
-
period time
-
- ω [rad s−1]
-
frequency
Subscripts
-
- DC
-
non-periodic component of frequency response
-
- SS
-
steady state
-
- 0
-
feed stream
-
- i
-
component (i = 1 CH3OH, i = 2 CO2, i = 3 CO, i = 4 H2, i = 5 H2O, i = 6 N2)
-
- j
-
reaction (j = 1 CO hydrogenation, j = 2 CO2 hydrogenation, j = 3 RWGS)
-
- I,II,…
-
number of harmonics of the frequency response
-
- x,y,z
-
inputs of the frequency response function (y = ouput of interest, x = input 1, z = input 2)
Superscripts
-
- G
-
gas phase
-
- S
-
solid phase
-
- *
-
reduced surface center
-

-
oxidized surface center
-

-
heterolytic surface center
Abbreviations
-
- AD
-
automatic differentiation
-
- ASO
-
asymmetric second order
-
- CSTR
-
continuous stirred-tank reactor
-
- FPO
-
forced periodic operation
-
- FRF
-
frequency response function
-
- NFR
-
nonlinear frequency response
-
- SS
-
steady state
Appendix
Objective Functions for NFR Method
Based on the NFR method, the change of objective functions which are defined in this paper (the outlet molar flow rate of methanol and yield of methanol based on total carbon) can be evaluated based on ASO FRFs and DC components of output of interest 16, 17.
 , for simultaneous co-sinusoidal modulations of inputs x and z can be approximately calculated using the DC ASO FRFs throughout following expression:
 ()
() and
and  are the ASO FRFs frequency response functions which correlate the dimensionless outlet molar flow rate of methanol, separately, to modulated inputs x and z, respectively 16, while
  is the cross ASO term which correlates the outlet molar flow-rate of methanol to both modulated inputs x and z
17.
 ()
()is the steady-state value of the outlet molar flow-rate of methanol. More details could be found in references 16 and 17.
-
normalized methanol production per unit mass of catalyst:
 ()
() -
yield of methanol based of total carbon
 ()
()


