Preparative Protein Crystallization
Abstract
Preparative protein crystallization can possibly replace one or more chromatographic steps in downstream processing. The development of such crystallization processes is demanding: first, promising principal crystallization conditions must be identified; second, details about the process must be defined; and third, the crystals have to be separated from the mother liquor without putting harm of their crystalline integrity. State-of-the-art about these three steps is developing fast by (i) employing new screening methods which are based on fundamental understanding of the interaction of the protein molecules, (ii) application of existing concepts of technical bulk crystallization of small molecules to preparative protein crystallization, and (iii) making available specific gentle separation machinery.
1 Introduction
In bulk protein crystallization, the supersaturation needed for nucleation and subsequent crystal growth is usually created by adding a crystallizing agent to the protein solution, which reduces the solubility of the protein and, thereby, causes crystallization. Conventional crystallizing agents applied for protein crystallization are salts, water-soluble polymers, and organic solvents 1.
For a long time, determining the B22 value of a solution represented the state-of-the-art when evaluating conditions suitable for crystallization. In general, following the B22 rational – being a fundamental thermodynamic approach to evaluate buffer conditions in terms of protein stability and phase behavior – scientists and engineers analyze attractive or repulsive interactions between molecules in solution. George and Wilson 2 initially postulated a so-called crystallization slot, a small range of slightly negative B22 values, where the probability of crystal growth of various proteins is high.
Techniques for determining the B22 value are, among others, membrane osmometry, sedimentation equilibrium measurements, self-interaction chromatography (SIC), and static light scattering (SLS). The major drawback of these and other techniques, however, clearly lies in the use of highly diluted solutions to predict high concentration behavior. This dilemma was demonstrated by the work of Rakel et al. 3-5. Based on these findings, a more structured procedure is proposed using phase diagrams bridging a large range of pH, salt or protein concentrations as a basis for investigations into solution parameters 6. This experimental basis allows the analysis of effects arising from additives 7, 8, molecular descriptions 9-11, or the evaluation of new experimental strategies 12-14. Especially the upcoming techniques to determine diffusion coefficients 14 and rheological behavior 15 in high-concentrated solution promise to replace the traditional approach of trying to predict high-concentrated protein solution behavior from data gathered at dilute concentrations towards techniques being directly applied in the respective solutions. A novel concept for finding adequate crystallization conditions is thus currently arising.
For controlling the properties of the produced protein crystals it is necessary to control the crystallization conditions. In salting-out, drowning-out, and anti-solvent crystallization the process conditions can be controlled by the dosage protocol of the crystallization agents and by the mixing conditions. Usually, the protein solution and the solution of the crystallizing agent cannot be mixed instantaneously, which results in spatial distribution of supersaturation. This implies the risk of precipitation as amorphous solids instead of building well-defined protein crystals. Such amorphous solids are difficult to separate from the liquid and may lead to a loss in biological activity due to structural degradation 16.
Another drawback of the above crystallization techniques is the ecological burden due to the massive use of crystallization agents in large-scale crystallization. Eventually, an additional recovery step may be required to remove the crystallizing agent from the crystals after the crystallization process 17. To overcome these obstacles, an advanced process for bulk protein crystallization based on solvent removal by evaporation at low pressure was introduced by Groß and Kind 18. The results of this study are given below.
Another important issue of controlling crystallization conditions is about nucleation. Here, seeding is very helpful. A fundamental study about seeding of crystallizing protein solutions was carried out by Barros Groß and Kind 19. The entire methodology for developing a process from microscale phase screening to bulk evaporative crystallization is concisely described in Barros Groß and Kind 20. Again, the results are given below.
The separation of crystalline proteins is challenging because of the specific reaction of the crystals to mechanical stress. Compared to organic or inorganic crystals, protein crystals are fragile and tend to break more easily under the strain imposed by ordinary separation processes like filtration or centrifugation 21. As a result, not only the crystalline performance is influenced, but also the separation efficiency is deteriorating. Due to breakage events, the fines content is increasing and the perfusion of the particle network worsening. In addition, this also leads to poor efficiency of washing and an increased amount of impurities, which remain in the final product and reduce the product quality.
Therefore, an appropriate process for the separation of crystalline proteins is necessary. For this purpose, the response to mechanical stress of crystalline proteins has to be investigated and the separation steps have to be evaluated regarding their efficiency and the bioavailability of the remaining product.
In case of ordinary separation processes like filtration and centrifugation processes, the liquor is separated from the solids due to an external driving force. This force also allows for the product to be washed in a following step. When using excessive pressure difference as driving force during the filtration process, the mechanical stress on the particle network is high. This may lead to crystal breakage. Therefore, the influence of pressure difference during filtration on crystal breakage of protein crystals and consequently the loss of filtration efficiency was evaluated. The results of this study are given below.
2 Finding the Right Crystallization Conditions
When trying to find the right or at least any crystallization conditions, one is faced with several approaches. Among these are experience-based selection of suitable systems, brute force screening using premixed excipients, determination of the thermodynamic sound B22 value, or the establishment of phase systems spanning a wide range of solution conditions. For the latter, a pipetting platform is used to compose 96-well plates with predetermined solution conditions, which are then analyzed with respect to their phase behavior over a certain time using a climate cabinet equipped with a camera to oversee the changes in fluid phase for each well 6, resulting in so-called phase diagrams depicted in Fig. 1. In these plots, the phase behavior as function of fluid phase conditions is given, providing coordinates of suitable systems.
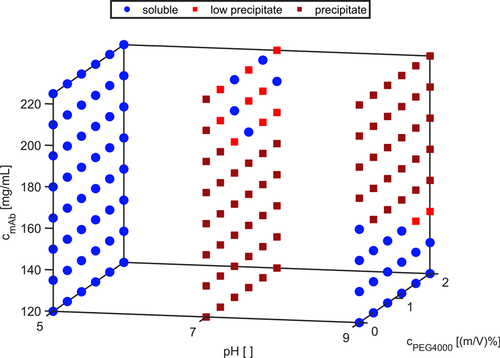
Protein phase behavior is determined by protein-protein, protein-solvent, and protein-solute interactions. In turn, these interactions are governed by protein properties (e.g., charge or structure) that are influenced by solution conditions 22, 23. Phase diagrams, as depicted in Fig. 1, allow for image-based identification of protein phase behavior as a function of three solution conditions. For example, pH value, antibody concentration, and PEG4000 concentration can be varied to create 96 unique formulations. Information obtained from protein phase diagrams can be used to investigate the effect of the varied solution conditions, but also to evaluate the underlying protein properties that result in the observed phase behavior over time.
An example of protein property change and the corresponding effect on long-term stability can be illustrated by varying the PEGylation degree of lysozyme as well as the covalently bound PEG molecular weight 24. A better understanding of how protein properties relate to long-term stability may result in short-term predictive parameters. A suitable set of such potential descriptive parameters is given in Fig. 2 representing information on protein state and fluid phase.
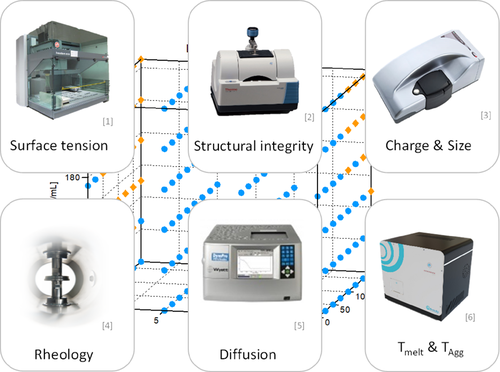
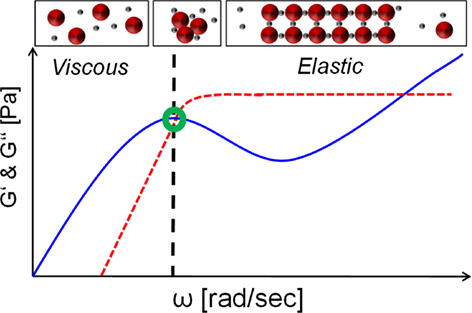
The overall challenge lies in finding correlations or trends to rather rapidly predict the phase behavior of given systems. A promising, but not widely spread approach lies in the use of rheological measurements. Schermeyer et al. 12 could demonstrate that the extent and ratio of G' and G'' describing the ability to store and dissipate energy can serve as an indicator for solution organization/stability (see Fig. 3). One of the most promising approaches lies in the combinations of several analytical parameters as depicted in Fig. 2. This has been described in a recent study on phase behavior by Schermeyer et al. 15 and Baumann et al. 25. In future, analytical screening approaches will be seen making possible the rapid determination of suitable crystallization windows.
3 Finding the Right Crystallization Process
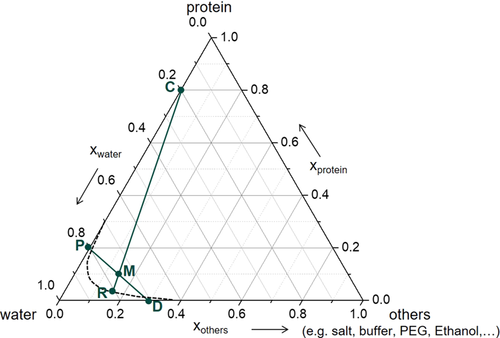
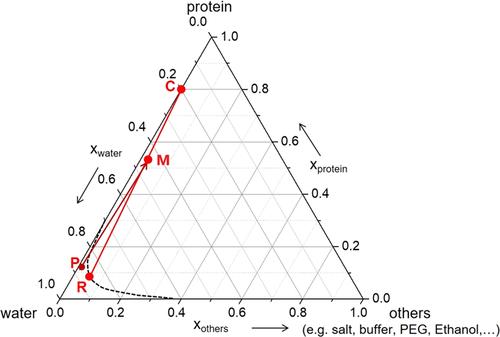
In protein crystallization, the solution composition can be simplified to consist of three components only, namely, the protein, the solvent (water), and all other components (buffer, crystallization agent etc.). Crystallization processes of such 3-component systems can suitably be depicted in a triangular diagram; see Fig. 4. The protein solution P is mixed with the crystallization agent D (included in “others”). The resulting mixture M decomposes into residual mother liquor R on the equilibrium curve and into protein crystals C. Here, the crystals are depicted as containing 20 wt % of water.
In addition to the above-mentioned and established crystallization processes using crystallizatin agents for reducing the solubility of the protein, Groß and Kind 18 proposed an evaporation crystallization process at low pressure. By means of the given pressure, the boiling temperature of the solution is controlled, i.e., at p ≈ 25 mbar, a concentrated aqueous lysozyme solution boils at T ≈ 24 °C. This process requires no additional crystallizing agent to reduce the solubility and provides, besides this environmental advantage, a slow and controlled approach to the desired supersaturation level. The process is depicted in Fig. 5. Water is evaporated from the protein solution P. The resulting mixture M decomposes into residual mother liquor R on the equilibrium curve and into protein crystals C. Again, the crystals are depicted as containing 20 wt % of water.
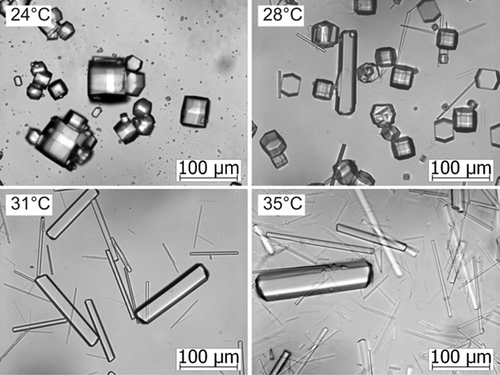
It can be stated that when crystallizing lysozyme in a 3-L crystallizer at low pressure and, thus, at moderate boiling temperatures (< 35 °C), the biological activity of the enzyme remains unchanged during the process. The influence of boiling temperature as one of the important process parameters (i.e., evaporation rate, use of seed crystals) on product quality is depicted in Fig. 6. Depending on the temperature, two different polymorphs are produced.
In particular in batch and semi-batch crystallization processes, nucleation control is of utmost importance for quality control and reproducibility. The supersaturation at which nucleation occurs is indicated in Fig. 7 for several evaporative crystallization experiments at different evaporation rates.
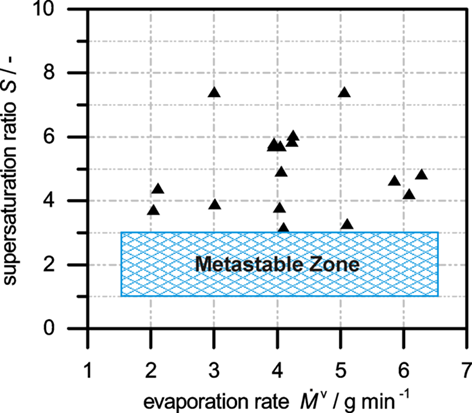
It is obvious that without seeding the supersaturation at which nucleation occurs varies strongly between the individual experiments despite identical experimental conditions. As a consequence, the supersaturation evolution during the unseeded experiments and the residual supersaturation at the end of the evaporation phase vary from experiment to experiment, resulting in differences in the additional time needed to equilibrate the suspension, and leading to strong variations of the product crystal size distributions. In contrast, seeding causes controllable and reproducible secondary nucleation, which depends on the seed quantity and the evaporation rate. Further, the seed quantity and the evaporation rate are suitable process parameters to guide the supersaturation evolution in seeded evaporative crystallization.
The reproducibility of the crystal size distribution of the product suspension can be dramatically increased by seeding compared to the unseeded experiments, while the well-defined shape of the crystals is of similar optical quality; see Figs. 8 and 9.
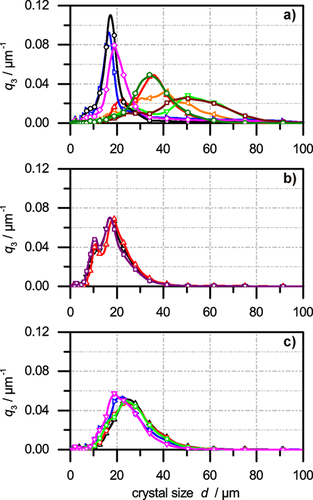
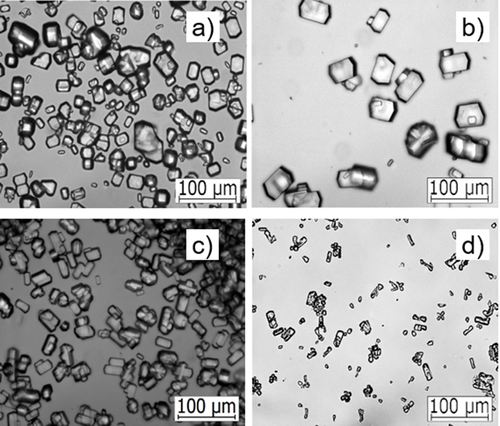
The crystal size distribution of the seeded experiments can be controlled by variation in seed mass and evaporation rate. Hence, seeding is a promising tool for bulk protein crystallization to improve controllability, reproducibility, and quality of the process and of the product. Thus, the presented results pave the way for the application of seeding in future protein crystallization processes.
4 Finding the Right Separation Technology
Besides finding the right solution composition, the appropriate crystallization conditions, and the right crystallization process for producing crystals with the desired properties in terms of polymorphic form, particle size distribution, purity etc., the solid-liquid separation is another challenging task to be solved for product recovery. Even if the crystallization process leads to perfectly shaped crystals, the subsequent solid-liquid separation step can result in broken crystals which do not meet the required product quality. Furthermore, crystal breakage reduces the particle size and leads to a non-negligible amount of small particles. Hence, crystal breakage during the solid-liquid separation leads to a decrease of separation efficiency.
The fragments reduce the pore size of the particle network which causes an insufficient dewatering process, and which results in a higher energy input needed for thermal drying. The higher residual moisture content is the reason for larger quantities of remaining impurities in the filter cake. Especially pharmaceutical products such as therapeutic proteins and monoclonal antibodies have high demands on purity and product quality. Therefore, increased impurity levels are unacceptable. Hence, it is crucial to understand the influence of the solid-liquid separation on the breakage behavior properly.
 (1)
(1)To dewater a particle network with small particles and hence small pores, a higher pressure difference for the emptying of the pores is needed. Vacuum filtration with a maximum pressure difference of 0.8 bar is not sufficient for cakes with small pore size distributions. On the other side, particles can be damaged by pressure filtration. The same effect can be observed by using centrifugation or a combination of both methods. Every particle system has its specific requirements regarding solid-liquid separation. Especially protein crystals are sensitive to mechanical stress. Hence, it is crucial to characterize the effects of the different separation methods on the final product.
Particle systems may have compressible or incompressible material behavior. The properties of an incompressible particle network do not change due to mechanical stress. In contrast, the porosity of a compressible network decreases with increasing pressure load, resulting in a time- and pressure-dependent increase in filtration resistance. This results in height-dependent differences of the properties of the filter cake due to the increasing solids pressure. Hence, the pore structure becomes inhomogeneous.
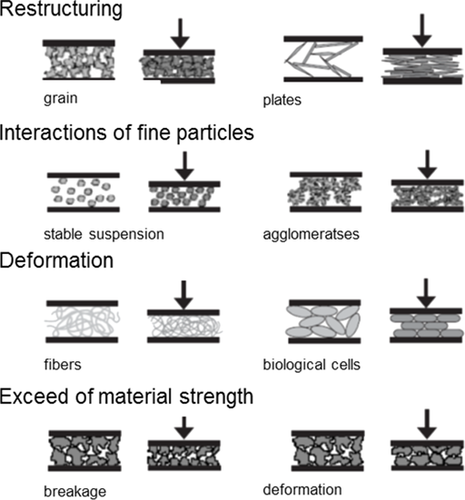
As can be seen from Fig. 10, compressible material behavior arises through various mechanisms. The most common cause of compressible material behavior is the restructuring of the particles within the filter cake. This effect is worsened by Van der Waals and electrostatic forces between fine particles. Another reason of compressible behavior is the elasticity of the particles itself which results in a deformation of the whole particle network. Lastly, particle breakage due to the exceedance of material strength is another cause of compressible material behavior.
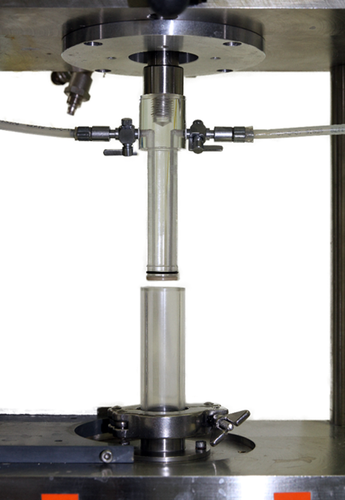
In the following, a fundamental investigation is reported on how different shapes of lysozyme crystals react to mechanical stress during pressure filtration. For this, a compression permeability cell (Fig. 11) was used to simulate increasing pressure on the particle network 27. This setup simulates the conditions of a typical filter press commonly used in industrial applications.
 (2)
(2) (3)
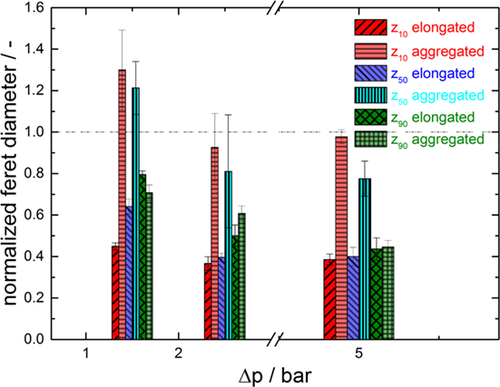
(3)If there is no change in the particle size distribution, the stressed particles have the same size as the original particles and the normalized Feret diameter equals 1. A reduction of size can be identified by values < 1, whereas an increase manifests in values > 1.
The considered particle system is lysozyme, which was crystallized in different shapes. The experiments were executed with elongated rod-like and aggregated crystals. The suspensions were filtered and stressed at different pressures. The resulting filter cake resistances of aggregated lysozyme crystals at different pressing times and pressures are given in Fig. 12.
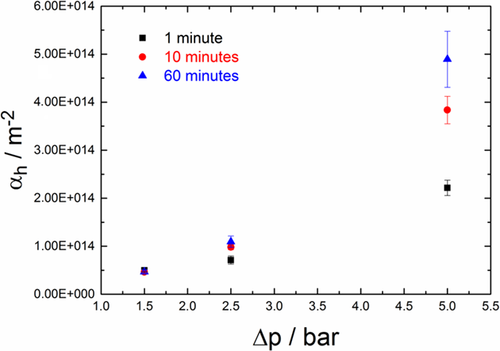
In general, the filter cake resistance increases with higher pressure. This can be explained by a reduction in porosity. Hence, the capillary pressure increases according to Eq. 1. Therefore, the particle network provides a higher flow resistance. The reduction in porosity can be explained either by restructuring of the particle network, or by an increasing fines content due to crystal breakage. The higher the pressing time is, the larger the observed effect gets 28.
The assumption of crystal breakage can be confirmed by looking at the normalized Feret diameter in Fig. 13. Also the differences between the particle shapes can be observed. In the case of the stressed elongated crystals, all size fractions are reduced regardless of the applied pressure. This is due to particle breakage in all size classes. For the aggregated crystal a different behavior can be observed. At low pressure differences the amount of large crystals decreases, whereas the content of the fines increases. This leads to the assumption that only large aggregates break whereas the fine ones remain undamaged. In contrast, higher pressure loads on the aggregated particles result in a constant fines content whereas larger particles are broken.
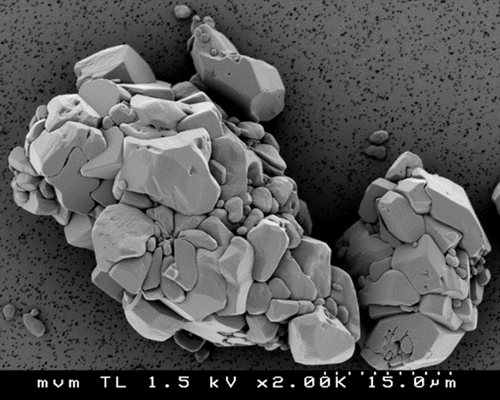
Additionally, scanning electron microscopy (SEM) images were conducted to further confirm the occurance of crystal breakage. Fig. 14 illustrates a damaged crystal after pressing.
The investigation on the reaction of protein crystals to mechanical stress demonstrates the importance of a deep understanding of the solid-liquid separation of crystalline materials 30.
5 Conclusions
The development of crystallization processes of protein molecules is demanding and consists mainly of three steps: in a first step, principal crystallization conditions with respect to solution composition must be identified. This is usually done by creating protein phase diagrams bridging a large range of pH, salt or protein concentrations. In a second step, the crystallization process path must be identified. While salting-out or drowning-out crystallizations are wide-spread, advanced techniques like the evaporative crystallization at low pressure have been proposed to enhance product and process quality. As a last step, the crystals have to be separated efficiently and economically from the mother liquor without putting harm of their crystalline integrity.
Acknowledgements
Financial support of this work is provided by the DFG (Deutsche Forschungsgemeinschaft) in the framework of the Priority Program DiSPBiotech (SPP 1934). The help of Michael Barros Groß, Lisa Löbnitz, Benjamin Radel, Marie-Therese Schermeyer, and Marieke Klijn for preparing this manuscript is gratefully acknowledged.
The authors have declared no conflict of interest.
Symbols used
-
- A [m2]
-
filtration area
-
- B22 [mol mL g−2]
-
second osmotic virial coefficient
-
- d [µm]
-
particle diameter
-
- dc [µm]
-
pore diameter
-
- hc [mm]
-
cake height
-
- Δp [bar]
-
pressure difference
-
- p [bar]
-
pressure
-
- pc [bar]
-
capillary pressure difference
-
- Rm [m−1]
-
medium resistance
-
- T [°C]
-
temperature
-
- Tagg [°C]
-
aggregation temperature
-
- Tmelt [°C]
-
melting temperature
-
 [m3h−1]
 -
filtrate flow
-
- x [–]
-
mass fraction
-
- z [–]
-
normalized Feret diameter
Greek letters
-
- αh [m−2]
-
filter cake resistance
-
- β [°]
-
contact angle
-
- ηf [mPa s]
-
fluid viscosity
-
- σ [mN m−1]
-
surface tension


