Fixed-Bed Heat Storage – Mathematical Modeling Approaches
Abstract
While renewable heat makes up only 13 % of overall German heat consumption, the share of renewable electricity produced from wind, solar, water, and geothermal power already reached 36 % of overall electricity consumption in 2017. One measure to support the integration of renewable heat in the German energy system is the use of heat storage systems. Although water-based heat storage systems for temperatures up to 100 °C are state of the art, systems for temperatures up to several hundred degrees Celsius are still under investigation or in the demonstration phase. Therefore, this work focuses on the development of a simulation model for analyzing and engineering fixed-bed thermal storage systems that are filled with an inert bulk material such as stone fragments.
1 Introduction
The transition in the German energy system from fossil to renewable energy carriers has reached a remarkable state in 2018. The share of electricity production from wind, solar, water, and geothermal energy has increased continuously over the last years and makes up 36 % of overall German electricity consumption. In contrast, the share of heat from renewables only makes up 13 % of overall German heat consumption and actually decreased slightly by 0.3 % from 2016 to 2017 1.
To increase the share of renewable heat in the energy system, heat storage systems play a key role 2. Heat storage helps overcome the time delay between heat demand and heat supply in industry and households 3. An example is combined heat and power (CHP) supply in industrial processes by gas engines. Due to their load flexibility, these engines are predestined to adapt their load, i.e., their electricity production, to the prices at the electricity exchange (EEX). The engines increase their load during periods of high electricity prices and, therefore, save money for the production site. When electricity prices are low, the engines reduce their load and the plant owner buys electricity from the EEX. To ensure that heat consumers at the plant site do not suffer a heat deficit while the gas engines reduce their load, heat can be stored when the engines operate at high load.
Among the multitude of heat storage systems available on the market or in the focus of research and development 4-7, fixed-bed systems filled with stone fragments are an especially promising option. This type of heat storage system can store heat up to several hundred degrees Celsius at comparatively low investment costs 8.
However, due to the exceptionally dynamic operation conditions of such heat storage systems, their design and proper adaption to specific applications is often a sophisticated task for engineers.
Therefore, this work aims at presenting a time-dependent, 2D (rotationally symmetrical) simulation model able to design fixed-bed heat storage systems filled with inert bulk materials. To emphasize the feasibility of the model, the dynamic behavior of a fixed-bed heat storage is exemplarily analyzed.
2 Heat Storage Concept
The simulation model was set up for an exemplary tubular reactor filled with a fixed bed of stone fragments (Fig. 1). The reactor is insulated by mineral wool and connected to the periphery by flanges. Dimensions and characteristics of the fixed-bed heat storage are presented in Table 1.
|
Parameter |
Value |
|---|---|
|
Length of reactor interior lR [m] |
2.40 |
|
Inner diameter of reactor interior dR [m] |
0.45 |
|
Diameter of bulk material dBM [m] |
0.005 |
|
Porosity of bulk material ΦBM [–] |
0.38 |
|
Thickness of insulation dI [m] |
0.05 |
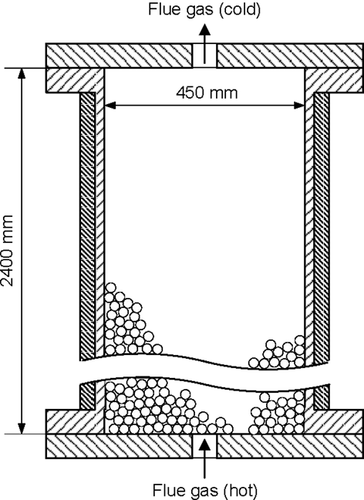
Hot flue gas from a CHP unit serves as a heat carrier that transfers its heat to the bulk of stone fragments of the heat storage. The flue gas flowing through the bulk is characterized by the temperature, pressure, volume flow rate, and composition shown in Tab. 2.
|
Parameter |
Value |
|---|---|
|
Pressure [bar] |
1.0 |
|
Temperature [°C] |
393 |
|
Volume flow rate [m3 h−1 (STP)] |
298.96 |
|
Carbon dioxide [vol %] |
8.50 |
|
Nitrogen [vol %] |
72.28 |
|
Oxygen [vol %] |
10.37 |
|
Water steam [vol %] |
8.85 |
To analyze the dynamic behavior of the heat storage, exemplarily the store-in and the holding phases were considered. The store-in phase lasts 1 h. During this phase, heat is transferred from the flue gas entering the heat storage with a temperature of 669 K to the cooler bulk with a starting temperature of 298 K. The holding phase comprises a time period of 24 h directly after the store-in phase, during which no further heat is supplied to the storage.
3 Modeling and Simulation
The simulation model was conducted with the software COMSOL Multiphysics. Key aspects of the model, i.e., differential equations, heat transfer equations, material properties, and basic settings in COMSOL Multiphysics, are described in the following.
3.1 Differential Equations
-
A gaseous phase representing the fluid (hot flue gas) flowing through the heat storage. All symbols related to the fluid are indexed with F.
-
A solid phase representing the bulk material (stone fragments) inside the heat storage. All symbols related to the bulk material are indexed with BM.
-
A solid phase representing the outer steel wall and flanges of the heat storage. All symbols related to the wall are indexed with W.
Each of the three phases is described by a specific energy balance in the form of a partial differential equation (PDE) 9. The connections between these three energy balances are the heat transfer terms.
The insulation is not described by a separate differential equation. Its temperature is set equal to ambient temperature. However, properties of the insulation, such as its thermal conductivity and thickness, contribute to the thermal transfer coefficient characterizing the heat transfer through the insulation between steel wall and surroundings.
3.1.1 Differential Equation of the Gaseous Phase (Fluid)
 (1)
(1)The spatial coordinate in the direction of fluid flow is indexed with z. The radial spatial coordinate, i.e., that with an angle of 90° to the flow direction, is indexed with y. The fluid flow is modeled as a bulk flow. Hence, heat conduction in flow direction, such as radial convective heat and mass transport, are neglected, as recommended in 10.
3.1.2 Differential Equation of the Solid Phase (Bulk Material)
 (2)
(2)3.1.3 Differential Equation of the Solid Phase (Wall and Flanges)
 (3)
(3)The geometry of the heat storage is meshed by the software COMSOL Multiphysics. For solving the set of PDEs, COMSOL uses the backward differentiation formula (BDF) method with variable time stepping.
3.2 Heat Transfer Equations
The PDEs of Eqs. 1–3 reveal the dependence of fluid, bulk material, and wall temperatures on four heat transfer terms: the heat transfer between fluid and bulk material ( ), the heat transfer between fluid and reactor wall (
 ), the heat transition between reactor wall and surroundings (
 ), and the heat transfer between flanges and surroundings (
 ). These four heat transfer terms are schematically shown in Fig. 2. Their calculation is described in the following.

3.2.1 Heat Transfer between Fluid and Bulk Material
 (4)
(4)3.2.2 Heat Transfer between Fluid and Reactor Wall
 (5)
(5)3.2.3 Heat Transfer between Reactor Wall and Surroundings
 (6)
(6)3.2.4 Heat Transfer between Flange and Surroundings
3.2.5 Dimensionless Numbers of Heat Transfer
The dimensionless numbers of heat transfer, i.e., the Nusselt number Nu, the Reynolds number Re, and the Prandtl number Pr, are calculated by Eqs. 8–11, respectively.
 (8)
(8) (9)
(9) (10)
(10) (11)
(11)With regard to the calculation of the Reynolds and Prandtl numbers, ηF is defined as the dynamic viscosity of the fluid.
3.3 Variables of State
 (12)
(12)3.4 Material Properties
To find a reasonable agreement of calculation time and model precision, the material properties used in the simulation model rely on different degrees of detail. While several properties are set to constant values, the effective radial thermal conductivity is calculated in more detail in dependence on the properties of the fluid and bulk material.
3.4.1 Effective Radial Thermal Conductivity of Fluid and Bulk Material
 (13)
(13) (14)
(14) (15)
(15) (16)
(16) (17)
(17) (18)
(18) (19)
(19) of the fluid and the inner reactor radius rR. For the calculation of the gas volume flow, the volume flow at standard temperature and pressure (Tab. 2) as well as the respective variables of state have to be taken into account.
 (20)
(20) (21)
(21)3.4.2 Material Properties of the Fluid
The viscosity ηF, the thermal conductivity λF, and the specific heat capacity cp,F of the fluid are calculated independently of temperature and pressure. They rely on the molar composition of the fluid and the respective values of each gas component at a temperature of 300 °C. The density is calculated according to the ideal gas law.
3.4.3 Material Properties of Reactor Wall, Catalyst, and Insulation
The material properties of reactor wall, catalyst, and insulation are taken into account as constant values (Tab. 3). The reactor wall was assumed to be made from steel 1.4571, the bulk material from chamotte, and the insulation from mineral wool.
|
Parameter |
Value |
Source |
|---|---|---|
|
Density of reactor wall ρW [kg m−3] |
7980.0 |
27, Dea 8 |
|
Specific heat capacity of reactor wall cp,W [J kg−1K−1] |
530.0 |
27, Dea 12 |
|
Thermal conductivity of reactor wall λW [W m−1K−1] |
18.0 |
27, Dea 11 |
|
Density of bulk material ρBM [kg m−3] |
2150.0 |
27, Deb 6 |
|
Specific heat capacity of bulk material cp,BM [J kg−1K−1] |
956.0 |
27, Deb 5 |
|
Thermal conductivity of bulk material λBM [W m−1K−1] |
1.05 |
27, Deb 3 |
|
Thermal conductivity of insulation λI [W m−1K−1] |
0.05 |
27, Dec 2 |
3.5 Basic Settings in COMSOL Multiphysics
-
Heat transfer in fluids: This physics module represents the energy balance of the fluid (hot flue gas) flowing through the heat storage. The variable of this module is the fluid temperature TF, the initial value of which is set to ambient temperature. Additionally, in this module a temperature of 666 K is defined at the edge where the fluid enters the reactor. Furthermore, an outflow such as a heat flux and a heat source were added to this module. The heat flux is defined by the product of the heat transfer coefficient αF-W and the temperature difference between TF and TW. The heat source is defined by the product of the heat transfer coefficient αF-BM, the specific surface area of the stone fragments [m2m−3], and the temperature difference between TF and TBM.
-
Heat transfer in solids: This physics module represents the energy balance of the bulk material (stone fragments) inside the heat storage. The variable of the module is the temperature of the bulk material TBM, the initial value of which as well equals ambient temperature. Besides, a heat source was added to this physics module. It describes the heat transfer from the fluid to the bulk and is defined in the same way as the heat source in physics module 1, however, with a negative sign.
-
Heat transfer in solids: This physics module represents the energy balance of the outer steel wall and flanges of the heat storage. The variable of this module is the wall temperature TW. Again, the initial value of this temperature is the ambient temperature. In contrast to the other physics modules, here three different heat fluxes are defined. One heat flux describes the heat transfer between wall and fluid. The respective equation corresponds to that for the heat flux mentioned in physics module 1, however, with a negative sign. The second heat flux represents the heat transfer from the flanges to the surroundings. It is calculated as the product of the heat transfer coefficient αFL-S and the temperature difference between TW and ambient temperature. The third heat flux characterizes the heat transfer from the wall through the insulation to the surroundings. The respective equation is the same as for the heat transfer from the flanges to the surroundings, except that it uses the heat transition coefficient kW-S instead of the heat transfer coefficient αFL-S.
-
Transport of diluted species: This physics module represents the mass transport of the fluid (hot flue gas) flowing through the heat storage. The variables of this module are the gas concentrations of carbon dioxide, nitrogen, oxygen, and water steam. Their initial values are set to zero. Additionally, an inflow and an outflow were added to this physics module. The inflow was marked at the edge where the fluid enters the heat storage. At this edge the concentrations were defined in accordance with the mole fraction and variables of state listed in Tab. 2.
4 Results and Discussion
In the following, the simulation results of the heat storage system are discussed. As defined in Sect. 2, Sects. 4.1 and 4.2 focus on the store-in and heat-up phases, respectively, in which flue gas with a temperature of 669 K starts flowing through the bulk of stone fragments with a starting temperature of 298 K. In Sect. 4.3, the holding phase is discussed. The holding phase comprises a time period of 24 h, i.e., 86 400 s, during which no further heat is supplied to the storage. It takes place directly after the store-in phase and accordingly starts with the temperature reached by the store-in phase.
4.1 Bulk Temperature Development of the Store-in Phase
The development of the bulk temperature over space, i.e., along the spatial coordinate z, is shown in Fig. 3. As the temperature changes with time, the figure contains seven curves representing simulated times of 1, 600, 1200, 1800, 2400, 3000, and 3600 s. The 1-s curve (solid line) shows a horizontal shape characterized by the starting temperature of the bulk (298 K), which means that the bulk still has taken up no heat from the hot flue gas. After 600 s, the temperature of parts of the bulk (0.3 m) has already increased to the flue gas inlet temperature of 669 K. This phenomenon continues with proceeding time. After 1800 s, half of the bulk, i.e., 1.2 m, has reached the flue gas temperature of 669 K, and after 3600 s, almost all of the bulk has reached this temperature.
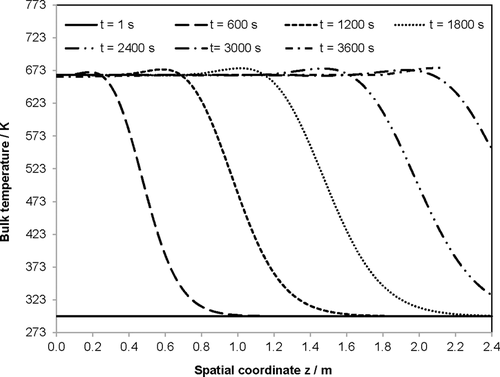
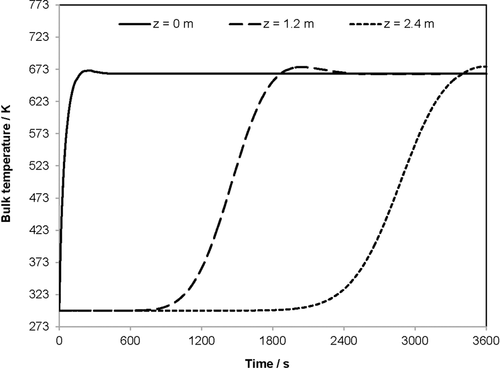
Fig. 4 shows the bulk temperature over a period of 3600 s for three locations in the heat storage system. As locations, the inlet (z = 0 m), the middle (z = 1.2 m), and the outlet (z = 2.4 m) of the heat storage were chosen. Fig. 4 confirms the conclusions from Fig. 3: the temperatures at these three locations in the bulk increase over time. Thereby, the bulk temperature at the inlet increases earlier than the middle and outlet temperatures. While the inlet temperature of the bulk after approximately 200 s already has reached the flue gas inlet temperature of 669 K, the middle of the reactor reaches this temperature after 1800 s. The outlet of the reactor shows this temperature after 3600 s.
4.2 Flue Gas Temperature Development of the Store-in Phase
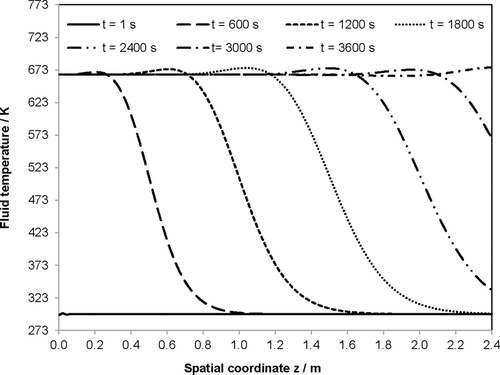
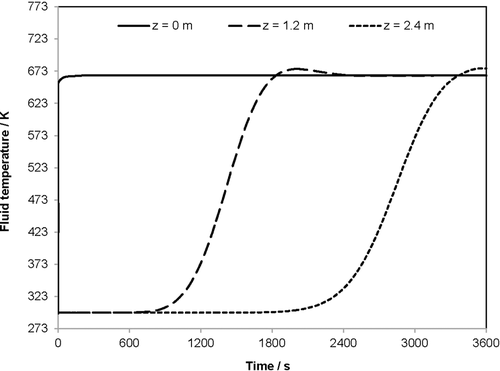
Figs. 5 and 6 show the development of the flue gas temperature in the heat storage reactor. In Fig. 5, the flue gas temperature is plotted over the spatial coordinate z for seven different times. Fig. 6 plots the flue gas temperature over a time period of 3600 s for three different reactor locations. The diagrams show almost identical curve shapes, as seen for the bulk temperature. Bulk and flue gas temperature only have a marginal shift, which cannot be distinguished in these diagrams. Fig. 5 shows that the flue gas temperature decreases as the spatial coordinate z increases. For example, the flue gas flows 0.3 m through the bulk without temperature loss after 600 s. After 2400 s, the flue gas flows about 1.8 m through the bulk without any temperature loss.
4.3 Bulk Temperature Development of the Holding Phase
Fig. 7 characterizes the holding phase directly after the store-in phase for a period of 24 h (86 400 s). The three curves show the bulk temperature over time at three different locations in the heat storage unit, i.e., z = 0, 1.2, and 2.4 m. The figure emphasizes the trend that the bulk temperature decreases most significantly at the reactor inlet with z = 0 m and least significantly in the middle with z = 1.2 m. After 86 400 s, the bulk temperature at the inlet is only 338 K. At the reactor outlet, the bulk temperature decreases to 421 K, and in the middle, the temperature decreases only to 506 K.
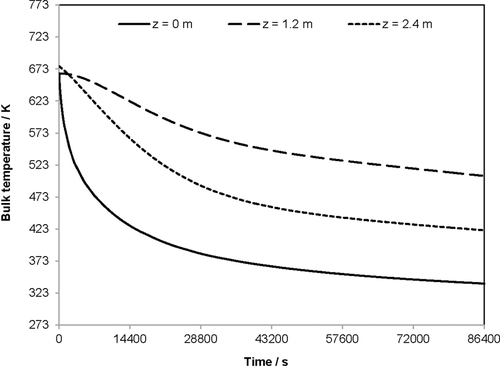
The slower cooling velocity at the outlet in comparison to the inlet is directly linked to the radial temperatures reached after the store-in phase: at the reactor outlet, only in the middle with y = 0 m, the flue gas temperature of approximately 669 K is reached. Therefore, due to the smaller driving temperature difference between fluid and wall, the heat transfer to the reactor wall is smaller than that at the reactor inlet, where this temperature difference is larger.
4.4 Experimental Validation
To prove the reliability of the simulation model, an experimental validation was conducted. Therefore, the simulation model was adapted to the specific characteristics of a laboratory test facility (geometric dimensions of reactor and bulk material, variables of state, etc.). The laboratory test facility comprises a van, an electrical air preheater, and a cylindrical steel vessel filled with a bulk of basalt stones. Instead of flue gas from a CHP unit, preheated air served as a heat carrier flowing through the bulk and, thereby, heating up the basalt stones.
The basalt stones have an average diameter between 3 and 5 mm and their total mass in the vessel amounts to 16.9 kg. An inner vessel diameter of 266 mm and a bulk density of 1448 kg m−3 lead to an overall bed height of the bulk material of 210 mm. The vessel is insulated with mineral wool and equipped with two thermocouples located in the middle of the vessel at bed heights of 70 and 170 mm, respectively. The air is characterized by an inlet temperature of 423.15 K, atmospheric pressure, and a volume flow rate of 0.01806 m3s−1 (STP).
Even without a fitting of model parameters to experimental results, measurements and simulation reveal accordance below measurement accuracy. While the experiments for the thermocouple at a bed height of 70 mm result in a temperature of 390 K after a heating time of 300 s, the simulation led to a temperature of 391 K. After 600 s the experiments showed a temperature of 421 K and the simulation a temperature of 424 K. The thermocouple located at a bed height of 170 mm measured 314 K after 300 s, 383 K after 600 s, and 423 K after 1020 s. The simulation calculated values of 315, 384, and 423 K, respectively.
5 Conclusion
A time-dependent, 2D (rotationally symmetrical) simulation model was designed for the analysis of fixed-bed heat storage systems filled with an inert bed of a bulk material such as stone fragments. On the basis of this model, a first analysis of an exemplary cylindrical heat storage with length of 2.4 m and an inner diameter of 0.45 m was conducted. The heat storage was filled with stone fragments, and flue gas from a CHP unit serving as a heat carrier with a temperature of 669 K was directed through the bed of fragments.
-
The simulation model is able to qualitatively predict the dynamic behavior of the heat storage system with regard to the heat transfer phenomena in axial and radial directions. Fluid flow phenomena such as turbulence and streamlines are neglected, but indirectly included in the heat transfer calculations (Nusselt number, etc.).
-
The simulation of the store-in/heating phase, in which the hot flue gas is directed through the bulk of stone fragments, shows the typical development of bed and flue gas temperatures over the reactor length. Specifically, the bulk heats up and the flue gas cools down with time.
-
The bulk temperature increases to the flue gas inlet temperature with time. Thereby, a hot zone characterized by the flue gas inlet temperature moves through the bulk.
-
After approximately 1 h, the overall bulk has adapted to the flue gas inlet temperature and the store-in process is finished. At this point, the flue gas does not cool down any more by flowing through the heat storage.
-
With regard to the holding phase, the typical effect of a slower cooling towards ambient temperature in the middle of the reactor in comparison to the inlet and outlet was proven.
-
Regardless of correct results of the heat storage model from a qualitative point of view, quantitative results need to be proven and validated by additional experimental data in future.
Acknowledgements
Open access funding enabled and organized by Projekt DEAL.
The authors have declared no conflict of interest.
Symbols used
-
- B [–]
-
deformation parameter
-
- cp,BM [J kg−1K−1]
-
specific heat capacity of the bulk material
-
- cp,F [J kg−1K−1]
-
specific heat capacity of the fluid
-
- cp,W [J kg−1K−1]
-
specific heat capacity of the reactor wall
-
- dBM [m]
-
diameter of the bulk material fragments
-
- dI [m]
-
thickness of the insulation
-
- dR [m]
-
inner diameter of the reactor
-
- kBM [–]
-
correlated thermal conductivity of the bulk material fragments
-
- kPH [–]
-
correlated thermal conductivity of the pseudo-homogeneous reactor interior
-
- Kr [–]
-
parameter
-
- Kr,∞ [–]
-
parameter
-
- kUC [–]
-
correlated thermal conductivity of the unified cell core
-
- kW-S [W m−2K−1]
-
heat transition coefficient between reactor wall and surroundings
-
- lR [m]
-
reactor length
-
- N [–]
-
parameter
-
- Nu [–]
-
Nusselt number
-
- ΔpF [Pa]
-
pressure drop of the fluid
-
- Pe0 [–]
-
molecular Peclet number
-
- Pr [–]
-
Prandtl number
-
 [J s−1]
 -
heat flow between fluid and bulk material
-
 [J s−1]
 -
heat flow between flanges and surroundings
-
 [J s−1]
 -
heat flow between fluid and reactor wall
-
 [J s−1]
 -
heat flow between reactor wall and surroundings
-
- rR [m]
-
inner radius of the reactor
-
- Re [–]
-
Reynolds number
-
- t [s]
-
time
-
- TBM [K]
-
temperature of bulk material
-
- TF [K]
-
temperature of the fluid
-
- TFL [K]
-
temperature of the flanges
-
- TW [K]
-
temperature of the reactor wall
-
- VBM [m3]
-
volume of the bulk material (including free space filled with fluid)
-
- VF [m3]
-
volume of the fluid
-
 [m3s−1]
 -
volume flow rate of the fluid
-
- VW [m3]
-
volume of the reactor wall
-
- w0 [m s−1]
-
average plug flow velocity of the fluid
-
- wz [m s−1]
-
fluid velocity in direction z
-
- y [m]
-
y-coordinate (perpendicular to fluid flow direction)
-
- z [m]
-
z-coordinate (in fluid flow direction)
Greek letters
-
- αF-BM [W m−2K−1]
-
heat transfer coefficient between fluid and bulk material
-
- αFL-S [W m−2K−1]
-
heat transfer coefficient between flange and surroundings
-
- αF-W [W m−2K−1]
-
heat transfer coefficient between fluid and reactor wall
-
- αNC [W m−2K−1]
-
heat transfer coefficient of natural convection
-
- ηF [Pa s]
-
dynamic viscosity fluid
-
- λ [–]
-
friction number
-
- λBM [W m−1K−1]
-
thermal conductivity bulk material
-
- λF [W m−1K−1]
-
thermal conductivity fluid
-
- λI [W m−1K−1]
-
thermal conductivity insulation
-
- λPH [W m−1K−1]
-
thermal conductivity pseudo-homogeneous reactor interior
-
- Λr [W m−1K−1]
-
effective radial thermal conductivity
-
- λW [W m−1K−1]
-
thermal conductivity reactor wall
-
- ρBM [kg m−3]
-
density bulk material (chamotte)
-
- ρF [kg m−3]
-
density fluid
-
- ρW [kg m−3]
-
density reactor wall
-
- Φ [–]
-
porosity of the bulk material
Abbreviations
-
- BDF
-
backward differentiation formula
-
- BM
-
bulk material
-
- CHP
-
combined heat and power
-
- EEX
-
electricity exchange
-
- F
-
fluid
-
- FL
-
flange
-
- I
-
insulation
-
- PDE
-
partial differential equation
-
- PH
-
pseudo-homogeneous
-
- S
-
surroundings
-
- UC
-
unified cell core
-
- W
-
wall


