CO2 Conversion to Higher Hydrocarbons on Iron-Based Catalysts: Promoter Impact and Kinetic Studies
Abstract
Promoted iron catalysts were tested for their Fischer–Tropsch (FT) activity to convert CO2/H2, CO/H2 and their mixtures to higher hydrocarbons (220 °C–300 °C, 20 bar, H2/(CO2+CO) = 3). The results show that iron-sintered catalysts are able to convert CO2 at moderate conditions to higher hydrocarbons (HCs) with a still low methane selectivity. Kinetic studies showed that CO2 is not directly converted to higher HCs but at first reduced by H2 to CO followed by FTS of CO. For a pure CO2/H2 mixture and a CO2 conversion of 10% (220 °C), the FeCuZnK catalyst has the highest C2+ selectivity (57 wtC%), the lowest methane selectivity (10 wtC%), and 32% of CO2 are converted to the intermediate CO. At 300 °C and a higher CO2 conversion of 47%, the C2+ selectivity is even 73 wtC% (methane 19 wtC%, methanol 4 wtC%, and 4 wtC% CO).
1 Introduction
A major challenge to mitigate the effects of climate change is the sustainable production of liquid fuels from renewable resources to decrease anthropogenic CO2 emissions. One option is the use of CO2 from various sources (power plants, chemical industry, and possibly separated from air) and subsequent conversion with renewable hydrogen to higher hydrocarbons (HCs). The preferred objective of this process is the production of liquid products such as diesel oil for trucks and jet fuel, which are currently difficult or impossible to substitute by the use of electrical energy or electrically powered transport.
For the activation and conversion of CO2 into higher HCs, conventional power-to-liquid (PtL) plants may be used. However, such CO2-based PtL systems (today only realized in small scale units [1]) mediated by Fischer–Tropsch synthesis (FTS) will according to today´s knowledge include a two-stage system with the conversion of CO2 and H2 into CO (and H2O) by the reverse-water-gas-shift reaction (RWGS) and the subsequent FTS of the produced syngas (CO + 2 H2 → ─CH2─ + H2O; CH2 represents a methylene group in a paraffinic HC). In consequence, higher HCs are currently only synthesized on a commercial scale (South Africa, Qatar) by FTS, that is, based on CO and syngas produced from coal or natural gas [2, 3].
The hydrogenation of CO2 to HCs (formally CO2 + 3 H2 → CH2 + 2 H2O) at moderate FTS temperatures of about 220 °C is today limited to a conversion of only up to 15%. The main reason is the endothermic, thermodynamically limited RWGS reaction, which is favored by high temperatures. Since FTS may substantially convert CO formed by RWGS, higher conversions of CO2 are in principle possible. A suitable catalyst should therefore show both, a high activity for RWGS and a similar or even higher activity for FTS. Furthermore, the catalyst should have a low selectivity to methane.
Note for clarity: In this work and throughout most of the literature, the term FTS is only related to the reaction of CO and H2 to HCs, whereas the “indirect” synthesis starting from CO2 is named as CO2 hydrogenation (to HCs), as it is—as also shown in this work—basically related to CO formation by RWGS followed by subsequent FTS.
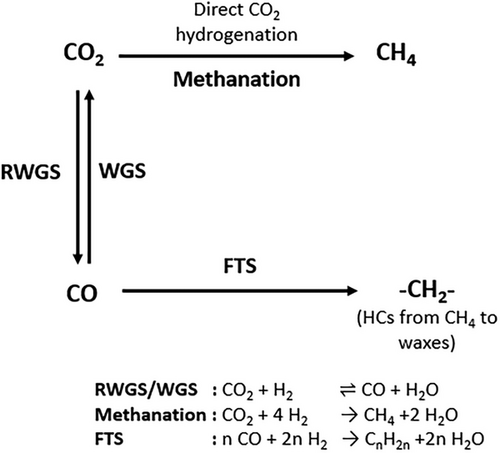
Many studies show that one potential way to directly convert CO2 with H2 to higher HCs is the use of iron-based catalysts [4-6]. They contain different active sites (iron oxides and iron carbides) which perform the two main catalytic reactions (RWGS and FTS) simultaneously as shown in Fig. 1. The FTS takes place on iron carbides, according to Ref. [7], and leads to the formation of a variety of HCs following the Anderson–Schulz–Flory distribution (ASF), which is (with the exception of methane formation) governed by the chain growth probability α. Direct methanation of CO2 may occur as a side reaction.
In this work, the single and combined effects of the promoters Cu, Zn, and K on a sintered iron catalyst on CO2 hydrogenation were investigated. At first, a pure iron catalyst was used. Afterward a single promoter (Cu or Zn), promoter pair (Cu/Zn) or even three promoters (Cu, Zn, and K) were incorporated. The studies with each catalyst include the measurements of activity, selectivity and stability and were carried out with different H2/CO2/CO mixtures (including pure CO and pure CO2 as carbon source) and also at a varying CO2 conversion, thereby even at a high temperature of 300 °C.
2 Materials and Methods
2.1 Catalyst Preparation
The catalysts are based on sintered iron catalysts and were synthesized according to Ref. [8]. About 50 g of the metal oxides (ZnO, Fe2O3, and CuO) were mixed and ball-milled (Pulverisette 5) with 60 ZrO2 balls (10 mm) in a ZrO2 container with cyclohexane as solvent. The milling procedure were 30 min (6 × 5 min milling with 20 min break in between) at 400 rpm. After drying, a mixture of water and potassium carbonate (K2CO3) were added, then dried again at 110 °C in an oven. The powders were sintered in a muffle furnace at 1100 °C (10 °C min−1) for 90 minutes, crushed and sieved to particles below 180 µm. The catalyst names reflect the quantity of promoters, for example, 100Fe15Cu5Zn5K, where numbers indicate the weight proportion of each element relative to iron.
2.2 Catalyst Characterization
The composition of the unreduced catalysts was determined by inductively coupled plasma optical emission spectroscopy (ICP-OES, Optima 7300 DV, PerkinElmer). About 0.1 g of catalyst were added to 8 mL of aqua regia (HCl/HNO3 = 3 (m/m)) in a Teflon container and decomposed in a high-pressure microwave-assisted oven (Multiwave 3000, Anton Paar). The samples were diluted with 50 mL of deionized water and 2% HNO3 prior to ICP-OES measurement.
The surface area was determined by N2 adsorption at –196 °C (Micromeritics Gemini V) and evaluated by the BET method in a pressure range of p/p0 = 0.05–0.3. In advance, the catalyst (approx. 0.5 g) was degassed at 100 °C for 16 h to remove any adsorbed surface species. The results of the catalyst characterization can be found in the Supporting Information (SI).
2.3 Catalytic Testing: Evaluation of Activity and Selectivity of the Catalyst
The catalytic testing of the CO/CO2 conversion and selectivity to different products (mainly HCs) was measured in a lab-scale tubular reactor setup, consisting of a stainless steel fixed-bed reactor (14 mm inner diameter) surrounded by an aluminum block to ensure isothermal conditions in the catalyst bed. The heating is realized by an electrical heating jacket. Gas flows (N2, CO, CO2, H2, and 1% cyclopropane in N2) were controlled by mass flow controllers and cyclopropane served as an internal standard for online gas chromatography. The total pressure of the system was controlled by a back-pressure regulator. A process flow diagram can be found in the SI. For the experiments, about 7.5 g of catalyst were diluted with about 32 g of silica sand (particle size 210–300 µm). The catalysts were reduced by heating to 360 °C at 2 °C/min with a holding period of 120 min at 360 °C (20% H2 in N2, = 20 nL/h). Afterward the gas was switched to pure H2 with a flow of 20 nL/h at 360 °C for 120 min to complete the reduction process. At the end of the reduction, the catalysts were cooled under N2 atmosphere to room temperature. Thereafter, the reactor was pressurized to 20 bar under H2/CO = 2 (V/V) atmosphere and then heated to the reaction temperature (220 °C). Since iron catalysts undergo a structural change and form iron carbides under FTS conditions, they were treated for 72 h prior to the kinetic measurements.
The in- and outlet concentrations of CO, CO2, and H2 were measured by a gas analyzer (Emerson X-Stream XE) equipped with infrared detectors (IR) and a thermal conductivity detector (TCD) for hydrogen. The values of the gaseous products (C1–C6) were analyzed using online GC samples (Perkin Elmer Clarus 690 equipped with a Rtx-100-DHA capillary column and a flame ionization detector (FID)). The liquid and (at 20 °C) solid products (waxes) were collected by cooling traps (25 °C, 0 °C, –79 °C) and analyzed using two offline GCs (Bruker 450-GC and Agilent Technologies 7890B). These were equipped with an Ultra 2 column (liquid products) and an VF-5ht UltiMetal column (waxes). FID`s were used in both cases. Cyclooctane was used as an internal standard in the liquid sample. The wax products were extracted directly from the cold trap and weighed afterward. The performance of the catalyst was evaluated under steady state conditions (24 h on stream) and the total mass balance (wtC%) was maintained within 100 ± 5% to ensure reliability throughout the experiments.
2.3.1 Calculations
It should be noted that the selectivities are based on the carbon content of the product by weight. Consequently, the selectivities are therefore given in wtC%. The calculation of the chain growth probability α is explained in detail in the SI.
For a constant COx conversion (here mostly 10%), τmod is also a good measure of the reaction rate; that is, a high value reflects a low rate and vice versa.
2.3.2 Kinetic Model (Used for the FeCuZnK Catalyst)
The inhibition parameters an,H₂O, bn,CO₂ and cn,CO (n = 1,2) were determined by adjusting the calculated values of the reaction rates to the experimental results. In an iterative procedure, the sum of square errors in the differences between the CO₂ conversion and CO selectivities (experimental and model) was minimized. The values of the inhibition parameters and the activation energy can be found in the SI.
3 Results
3.1 Performance of Catalysts at Varying Carbon Dioxide/Carbon Monoxide Ratio (CO2/CO)
The individual and combined effects of Cu, Zn, and K on iron-based sintered catalysts with pure H2/CO2 and mixtures of H2/CO2/CO at a constant molar H₂/COx ratio of three at a fixed temperature of 220 °C were investigated. The experiments were carried out at around XCOx = 10% (Equation 3), so the modified residence time was adjusted. The objective was to determine the extent to which the catalysts still convert CO₂ at an increasing CO concentration, as the ability of the catalysts to achieve a high CO2 conversion in the presence of both CO₂ and CO at elevated CO concentrations is a crucial factor in determining their active and selectivity performance. Different CO2/CO ratios were tested, and the results for a molar ratio of H2/CO₂/CO of 3/0.75/0.25 and pure H2/CO2 are presented in Fig. 2; the outcome for other H2/CO₂/CO ratios can be found in the SI.
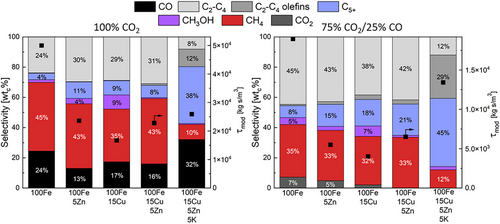
In case of the pure iron catalyst (100Fe), the selectivities change by the addition of CO, as clearly indicated by the comparison shown in Fig. 2: The formation of C2–C4 paraffins increases, 45 wtC% with CO2 and CO compared to only 24 wtC% with pure CO2. The addition of CO to the reactant gas leads to a net CO2 production by the water-gas-shift (WGS) reaction (7 wtC%) in contrast to 24 wtC% CO selectivity with pure H2/CO2, which indicates a preferential adsorption of CO over CO₂ on the catalyst surface. Furthermore, the pure iron catalyst shows overall the highest methane selectivity regardless of the CO2/CO ratio with 45 wtc % for pure H2/CO2 and 35 wtC % by the addition of CO.
In case of only zinc as promoter (100Fe5Zn), there is a small but notable increase in the selectivity to long-chain products in case of CO present in the syngas, 15 wtC% C5+ and 43 wtC% C2-C4 compared to 11 wtC% and 30 wtC% without CO, while CO2 (5 wtC%) is still produced by WGS. The incorporation of copper only (100Fe15Cu) continues to follow the trend toward a higher production of long-chain products and less (net) production of CO2. However, the highest production of methanol 9 wtC% (H2/CO2) and 7 wtC% (addition of CO) of all catalysts are noteworthy. The methanol formation can be explained by the catalytic effects of Cu [7, 8].
For the 100Fe15Cu5Zn catalyst, there is not anymore, a net production of CO₂ when CO is added, but also no consumption of CO2. This indicates that the added CO₂ is then almost an inert component and is neither consumed by RWGS nor generated by WGS. In addition, by combining Cu and Zn, the methanol formation gets suppressed to a negligible value of only 1 wtC%. This is an interesting and unexpected effect because the conventional catalyst for methanol synthesis (Cu/ZnO/Al2O3) is made up of these elements used here as promoters. It can therefore be proposed that iron or zinc inhibits the formation of methanol within this particular configuration.
A comparison of the selectivities of the 100Fe15Cu5Zn5K catalyst in H2/CO2 atmosphere with the case of CO addition (Fig. 2) reveals a clear distinction and advantage of this catalytic system compared to pure Fe and the other catalysts. The addition of potassium has a significant positive impact on the HC selectivities. This catalyst exhibits the highest selectivity to C2–C4 olefins (12 wtC% and 29 wtC%) and long-chain hydrocarbons C5+ (38 wtC% and 45 wtC%) and the lowest selectivity to methane (10 wtC% and 12 wtC%). These values are comparable to similar unsupported catalysts in literature [10, 11]. This shift in selectivities is also observable in the chain growth probability. The 100Fe15Cu5Zn5K catalyst has the highest α values at 0.6 (αC3–C8) and 0.92 (αC12–C25) for pure H2/CO2. The chain growth probabilities for the other catalysts are listed in the SI. Furthermore, no net formation of CO₂ takes place by the addition of CO, and, in contrast to the 100Fe15Cu5Zn catalyst, CO₂ and CO are both consumed. According to Dry et al., the electronic properties of potassium, when interacting with iron-based catalysts, result in enhanced CO₂ adsorption and reduced H₂ adsorption [12, 13]. This obviously leads here to an increased formation of CO (Fig. 2 left), which subsequently reacts to long-chain hydrocarbons and olefins under conditions of reduced H₂ concentration on the catalyst surface. Investigation by others with slightly different catalysts (FeK, FeCuK, FeZnK with higher K-content) resulted in a higher Olefin/Paraffin ratios (C2–C4) in the range of 3 to 7, in comparison to the O/P ratio in this work of 1.5. In contrast, lower C5+ selectivities and higher CH4 selectivities were observed, consequently resulting in lower α values as in the present study [11, 14]. According to Choi et al. and Chen et al., a further increase in the K-content above 5 wt% significantly enhances the olefin production but also leads to shorter chains. The reason for this is the excess K on the catalyst surface, which enhances Fe-C bonds and carbon deposition therefore leading to a reduced catalyst stability [15, 16].
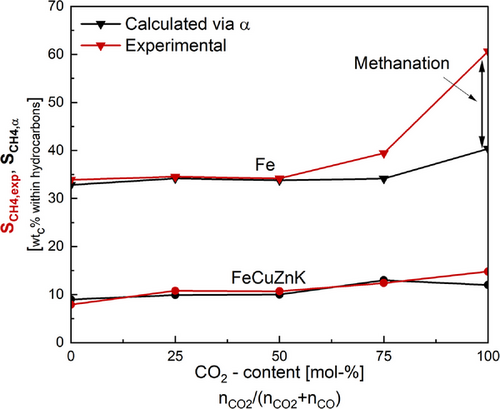
A comparison of the methane selectivity (determined experimentally and calculated using α) shows significant deviations at higher CO₂ contents for all catalysts except FeCuZnK. This indicates that direct CO₂ hydrogenation/methanation occurs to a certain extent for the catalysts without potassium. The comparison of the methane selectivities as a function of the CO₂ content is shown as an example for FeCuZnK and Fe in Fig. 3. The data for the other catalysts can be found in the SI.
Regarding the activity of the catalysts, promotion with potassium slightly decreases the activity compared to 100Fe15Cu5Zn (0.53 mmolCO₂ s−1kgCat−1 and 0.44 mmolCO₂ s−1kgCat−1 for 100Fe15Cu5Zn5K). Fig. 4 illustrates the experimental reaction rates (symbols: CO in red; CO₂ in black) and the model-based calculation of the rates as a function of the molar CO₂ content nCO₂/(nCO₂ + nCO) of the 100Fe15Cu5Zn5K catalyst. Up to a molar CO₂ content of about 70 mol-% within the COx-feed, the negative reaction rate for CO2 indicates a (net) CO2 production whereas from this concentration on CO2 is consumed (at 65 mol-% according to the model). This (favorable) trend is not observed in any of the other catalysts. All data of the respective reaction rates of the remaining catalysts can be found in the SI.
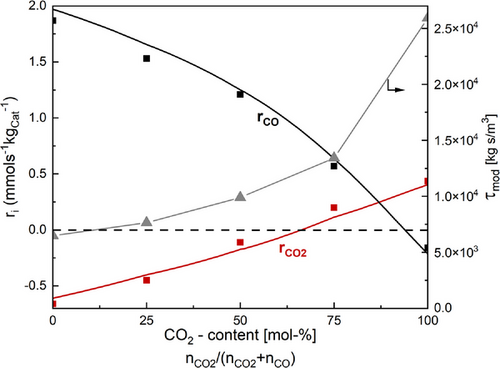
Consequently, the 100Fe15Cu5Zn5K catalyst is the most efficient one for the conversion of CO₂ even in the presence of CO. This is a crucial attribute, as the recycling of the unreacted gas is essential for achieving an enhanced CO₂ conversion on an industrial scale.
3.2 Performance of the Catalysts at a Varying CO2 Conversion for Syngas Free of CO
The ability of the catalysts to achieve a high CO₂ conversion is an important aspect with regard to a technical synthesis of HCs based on CO2 only or a CO2 rich syngas, and is significantly influenced and determined by both the RWGS and FTS activity. However, the presence of significant quantities of water/steam in the system also represents a considerable inhibitory factor, as steam is formed to a high extent at a high degree of conversion of COx. Therefore, the catalysts were exposed to a constant flow rate of H2 and CO2 (i.e., a constant τmod), while the temperature was varied in four steps (220°–250 °C–280 °C–300 °C), with the exception of FeCuZnK, as then even lower temperatures were also tested in order to decrease the conversion of CO2. Each catalyst was then re-exposed to 220 °C to rule out deactivation due to elevated temperatures. The CO2 conversion profile as a function of temperature for syngas free of CO is illustrated in Fig. 5. Additionally, the CO2 equilibrium conversion only achievable by RWGS (thin gray line) and the model-based calculation for 100Fe15Cu5Zn5K (black line) are shown.
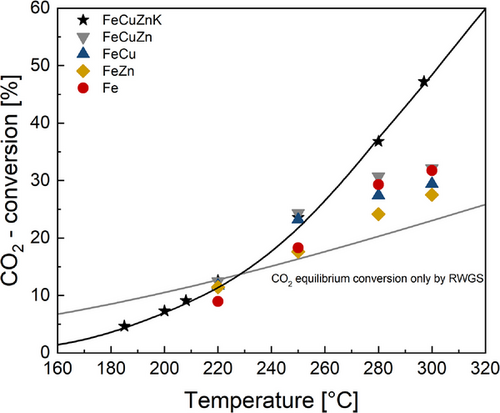
At a low temperature (here 220 °C), the measured values remain in agreement with the equilibrium curve. However, as the temperature increases, the actual values of the CO₂ conversion deviate more and more from the theoretical values, clearly indicating that considerably higher CO₂ conversions are achieved by the subsequent FTS reaction converting CO formed by RWGS.
The 100Fe15Cu5Zn5K catalyst shows the highest CO₂ conversion under the specified reaction conditions. It is the only catalyst with an increase in CO2 conversion with increasing temperature reaching a remarkable CO2 conversion of 47% at 300 °C. All other catalysts show a maximum conversion of 30% or even lower at these temperatures. Similar unsupported catalysts reported in the literature achieved conversions of approximately 40% at 300 °C [17, 18].
At elevated temperatures (above 280 °C) all catalysts, except of the one containing potassium, show no significant increase in CO2 conversion (Fig. 5). This is probably attributable to a specific form of inhibition or deactivation resulting from the increasing concentrations of H₂O at high CO2 conversions. The impact of water on iron catalysts and their structure has been previously investigated, for example, by Claeys et al. [19]. This study demonstrates that significant quantities of water/steam can result in the oxidation of Hägg carbide (χ-Fe5C2) to magnetite (Fe3O4). Since iron carbides are mostly identified as the active phase for FTS in literature, a reduction in FTS activity was also observed with a decline in the carbide phase. The experiments show that the potassium promoted catalyst exhibits a higher tolerance to inhibition by water.
Fig. 6 compares the values of the equilibrium constant (Keq,RWGS) of the RWGS at each temperature and the corresponding experimental (100Fe15Cu5Zn5K, 100Fe) values (Keq,Cat) of this ratio as a function of temperature. The values of the other catalysts can be found in the SI. At high temperatures (> 280 °C) experimental data fits well with the theoretical data for FeCuZnK. The pure iron catalyst demonstrates a slightly stronger deviation here. Hence, the equilibrium of the RWGS is then always reached. Decreasing the temperature leads to lower values of the experimental ratio compared to the equilibrium value theoretically predicted
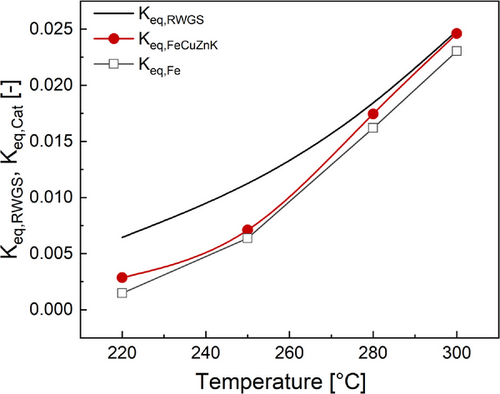
This difference between the “real” theoretical and the experimental “equilibrium” (basically reflecting the deviation from equilibrium) indicates, as expected, that the RWGS reaction is closer to equilibrium at high but not at lower temperatures. The RWGS reaction is therefore at low temperatures kinetically too slow compared to the FTS, but at high temperatures (here >280 °C), the preequilibrium of the RWGS is almost reached for the catalysts.
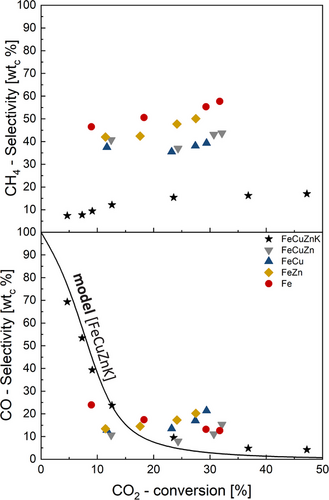
This can also be seen in Fig. 7 (bottom graph): The CO selectivity and thus CO concentration for the 100Fe15Cu5Zn5K catalyst continue to decrease at higher CO2 conversions. At 300 °C and a CO₂ conversion of 47%, the CO selectivity is only 4 wtC%. The CO selectivities of the other catalysts remain almost constant or even increase slightly throughout an increasing CO₂ conversion. For example, the CO selectivity of the 100Fe15Cu catalyst increases from 13% (XCO₂ = 12%) to 21% (XCO₂ = 29%). Only the pure iron catalyst shows similar results to the potassium-promoted catalyst; that is, the CO selectivity decreases with increasing CO2 conversion. Similar results for SCO as a function of XCO₂ can be found in Refs. [20, 21].
This could also be an indicator for the oxidation of these catalysts or their carbide phases to iron oxides by the high concentrations of water. Iron oxides exhibit a higher RWGS activity in comparison to iron carbides [22]. An increase in the iron oxide phase is accompanied by a reduction in the iron carbide phase, which suggests that a greater proportion of CO remains in the system and is unable to participate in the conversion process.
There is also a notable difference in the methane selectivity for the potassium-promoted catalyst compared to the other catalysts. The FeCuZnK catalyst shows—for example—a significant lower CH4 selectivity (19 wtC% at 300 °C). Wang et al. showed similar CH4 selectivities and proposed that a promotion with K up to 5 wt% significantly enhances the CO2 conversion and lowers the CH4 selectivity due to an increased electron density around the Fe species [5]. The fact that the CH4 selectivity remains constant during an increase in CO2 conversion, despite a significant decrease in CO selectivity, indicates that the CH4 formation is not closely linked to CO formation, as Wang et al. also showed [20]. Since methane is an unwanted side product of the FTS, the 100Fe15Cu5Zn5K catalyst is the optimal choice for use at both low and high FT temperatures.
Furthermore, at 300 °C the potassium promoted catalyst still shows high selectivities toward C2–C4 products (around 47 wtc% → 20 wtc% olefins) and also for C5+ hydrocarbons (approx. 26 wtc%) and only minimal methanol selectivities (approx. 4 wtc%). It has been reported that higher olefin selectivities of up to 50 wt% can be achieved at elevated temperatures [18, 23]. This is presumably due to the significantly higher potassium content (10-20 wt%). However, the selectivity to methane is generally higher and the proportion of long chain products is lower, probably due to the effect mentioned in Section 3.1.
The 100Fe15Cu5Zn5K catalyst has been identified as the optimal catalyst for the synthesis of liquid hydrocarbons, as it still achieves an α of 0.58 even at elevated temperatures and high carbon dioxide conversions.
4 Conclusion
In this study, iron-based catalysts were synthesized, characterized, and investigated for their activity and selectivity in the process of low temperature CO₂ conversion to HCs. The properties of the different promoters (Cu, Zn, and K) were determined by varying three factors: the CO₂/CO reactant ratio, the temperature (220 °C–300 °C) and the CO₂ conversion.
All studies have identified that 100Fe15Cu5Zn5K exhibits the lowest methane selectivity and the highest selectivities to the desired long-chain hydrocarbons (C5+) and olefins. The CO₂ conversion variation also indicates that potassium presumably inhibits the oxidation of iron carbides to iron oxides, thereby enabling higher CO₂ conversions. Further studies on the catalyst properties and the influence of H₂O on the iron phases (iron oxides, iron carbides) using, for example, in situ XRD analysis during the reaction are therefore essential to maximize the CO₂ conversion.
In addition, a kinetic model was created using the FeCuZnK catalyst with an LHHW approach. This model serves as a foundation for subsequent kinetic adjustments with regard to the catalyst composition, the reactant ratio, as well as pressure and temperature variations. Nevertheless, in experiments with pure H2/CO2 (XCO₂ variation) and studies with varying CO2/CO rations, the model demonstrated a high degree of correlation with the experimental data for CO2 conversion, CO selectivity and the respective reaction rates.
Supporting Information
Supporting information for this article can be found under DOI: https://doi.org/10.1002/ceat.12010.
This section includes additional references to primary literature relevant for this research [24-26].
Acknowledgments
Open access funding enabled and organized by Projekt DEAL.
Symbols used
-
- aH20
-
- [–]
-
- bCO2
-
- [–]
-
- cCO
-
- [–]
-
- c
-
- [mol m−3]
-
- EA
-
- [kJ mol−1]
-
- Keq
-
- [–]
-
- k0
-
- [m3 s−1 kgcat−1]
-
- k
-
- [m3 s−1 kgcat−1]
-
-
- [mol h−1]
-
- mCat
-
- [kg]
-
- r
-
- [mmol s−1 kgCat−1]
-
- S
-
- [wtc%]
-
- T
-
- [°C]
-
- p
-
- [bar]
-
- X
-
- [%]
-
- x
-
- [–]
-
- Z
-
- [–]
Greek letters
-
- α
-
- [–]
-
- τmod
-
- [kg s m−3]
-
- ξ
-
- [–]
Abbreviations
-
- FTS
-
- Fischer–Tropsch synthesis
-
- GC
-
- Gas chromatography
-
- HCs
-
- Hydrocarbons
-
- IR
-
- Infrared
-
- PTL
-
- Power-to-liquid
-
- RWGS
-
- Reverse-water-gas shift
-
- STP
-
- Standard temperature and pressure
-
- TCD
-
- Thermal conductivity detector
-
- TOS
-
- Time on stream
-
- WGS
-
- Water-gas shift


