Hemodynamics of low-pressure cardiac tamponade: An illustrative case report
Disclosure: The views expressed in this publication are those of the author(s) and do not reflect the official policy or position of William Beaumont Army Medical Center, Department of the Army, Defense Health Agency, or the US Government.
Abstract
A 55-year-old male with acute pericarditis presented with low-pressure cardiac tamponade (LPCT) unresponsive to volume infusion. Subsequent pericardiocentesis resulted in hemodynamic improvement and unmasking of pericardial constriction. This case provides illustrative hemodynamic tracings of LPCT. Additionally, the presence of concurrent pericardial constriction that may indicate a plausible underlying mechanism for the blunted responsiveness to fluid expansion in LPCT. The underlying physiologic processes and the associated hemodynamic tracings are discussed.
1 INTRODUCTION
Low-pressure cardiac tamponade (LPCT) is a known, albeit less frequent, clinical entity in the spectrum of pericardial diseases that may present both diagnostic and therapeutic dilemma. Commonly without the typical features of classical cardiac tamponade (CCT), including jugular vein distension and an abnormal pulsus paradoxus (PP), reaching the diagnosis before clinical deterioration may be difficult. Additionally, the limited response to intravenous fluid resuscitation in LPCT may increase patient morbidity and mortality when therapeutic pericardiocentesis is delayed. The hemodynamic properties of LPCT and its physiologic responses to therapeutic interventions have been previously described in case series and case reports.1-6 In this paper, we review the physiology of LPCT in comparison to CCT, present dynamic invasive hemodynamic tracings to highlight the physiology of LPCT and demonstrate concurrent constrictive mechanisms that may influence the clinical impact pericardial effusions in LPCT.
2 CASE REPORT
A 55-year-old male with metastatic pulmonary adenocarcinoma presented with dyspnea and was found to have a large pericardial effusion. He was previously treated for acute pericarditis with high-dose NSAID therapy and colchicine. One week before presentation, he developed recurrent chest discomfort with shortness of breath and vomiting. He was tachycardic (heart rate of 113 beats/min) and his blood pressure was 93/71 mmHg. He had jugular venous distension (JVD) of 12 cm H2O and a positive Kussmaul sign, without peripheral edema or rales. The PP was borderline at 10 mmHg.
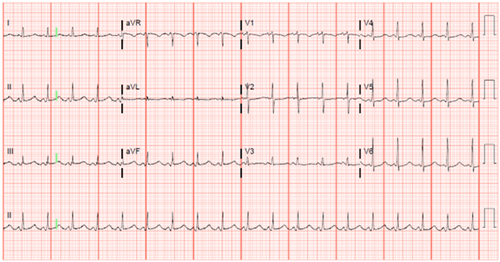
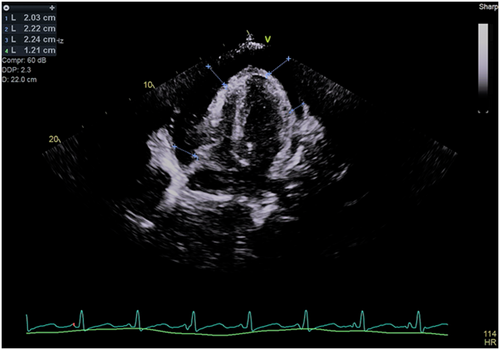
His 12-lead electrocardiogram showed sinus tachycardia without electrical alternans (Figure 1). A transthoracic echocardiogram (TTE) revealed a large pericardial effusion measuring 2.3 cm (Figure 2). There was late diastolic collapse of the right ventricle. His inferior vena cava was not dilated. Mitral and tricuspid inflow velocities were not measured. Despite 2-unit blood transfusion for a hemoglobin of 6.6 g/dL, he remained tachycardic and hypotensive. He underwent an invasive hemodynamic study to assess for LPCT.
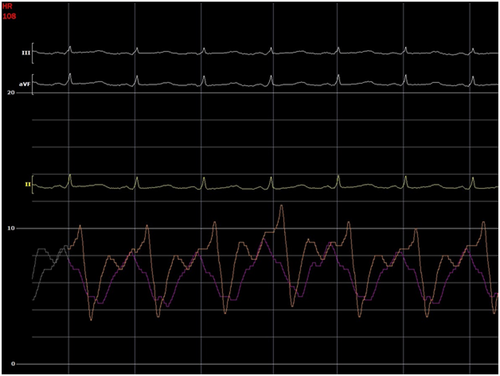
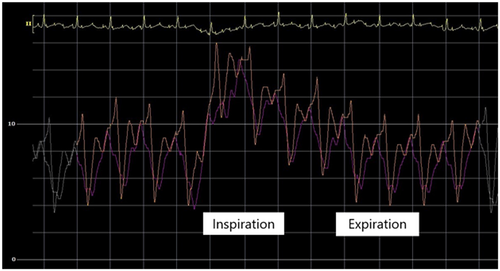
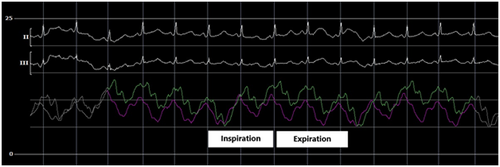
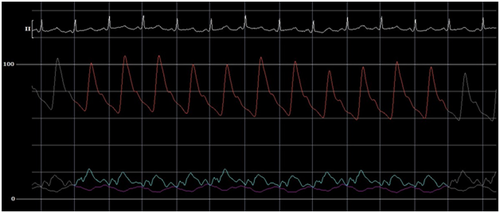
The initial intrapericardial pressure (IPP) was 7–8 mmHg, approximating the RA pressure of 8 mmHg (Figure 3), yielding an RA transmural pressure of less than 1 mmHg. There was no y descent demonstrated on the RA pressure tracing (Figure 3). The presence of an invasive Kussmaul sign correlated with physical exam findings (Figure 4). The pulmonary artery wedge (PAW) pressure was 10 mmHg, with a resultant left atrial (LA) transmyocardial filling pressure gradient of 2 mmHg. There was generalized equalization of diastolic pressures around 8–10 mmHg. The PAW pressure was noted to exceed IPP during inspiration (Figure 5). The invasively measured PP was 10 mmHg, consistent with physical examination (Figure 6). The thermodilution-derived cardiac index (CI) was 2.0 L/min/m2, with an indexed stroke volume (SV) of 19.4 mL/m2.
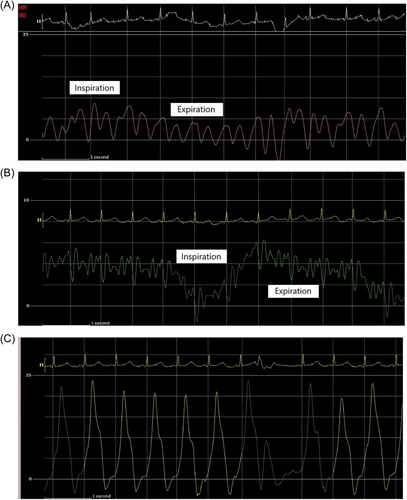
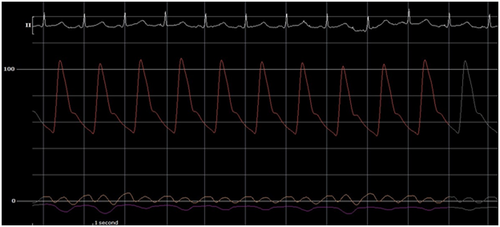
A total of 510 mL of serosanguinous fluid was aspirated, completely resolving the pericardial effusion by TTE. Thereafter, the IPP was subatmospheric at −7 mmHg, with an RA pressure of 1 mmHg and a PAW pressure of 4 mmHg. This yielded an LA transmyocardial filling pressure gradient of 10 mmHg and a RA transmyocardial filling pressure gradient of 8 mmHg (Figure 7). The CI and indexed SV improved to 3.3 L/min/m2 and 38.8 mL/m2, respectively. Postpericardiocentesis tracings showed prominent x and y descents in the RA waveform, a “square-root” sign in the right ventricular (RV) waveform, respirophasic discordance in the RA and PAW waveforms, and a persistent Kussmaul sign (Figure 8). The invasively measured PP was 7 mmHg (Figure 9). He had immediate resolution of his dyspnea and there was no recurrent pericardial effusion upon discharge on hospital Day 3.

3 DISCUSSION
3.1 Defining LPCT
In the absence of consensus on clinical criteria, a catheterization-based definition of LPCT has been previously proposed, with an IPP of <7 mmHg and a postpericardiocentesis RA pressure of <4 mmHg. LPCT was identified in 9.6% of patients presenting with cardiac tamponade, with 76% demonstrating improvement in CI following pericardiocentesis.1 CCT from a compressive pericardial effusion generally results upon measurable PP and JVD on physical examination. Invasive hemodynamic study may reveal progressive hemodynamic effects, such as increased right-sided pressures and reduced CI preceding hemodynamic collapse. Despite being less frequent and clinically occult, LPCT can cause similar hemodynamic derangements.2-6 LPCT has been described to have normal jugular venous pressures and an absence of PP.4 However, despite being infrequent, JVD and an abnormal PP were still seen in 20.6% and 6.9% of LPCT patients, respectively.1 Invasive hemodynamics have demonstrated diastolic pressure equalization at low filling pressures, followed by improvement or normalization of CI after pericardiocentesis.
Our case shares many similarities with the hemodynamic values obtained from prior studies. The initial intracardiac pressures were not elevated, despite having evidence of cardiac tamponade and an IPP of 7 mmHg. The absence of an abnormal PP, defined as greater than 10 mmHg, is consistent with previous case reports, where it was only seen in 7% of LPCT patients, compared to 50% of patients with CCT. The postpericardiocentesis RA and LA pressures fell to 1 and 3 mmHg, respectively, which approximate values seen in an LPCT cohort (1.21 ± 1.4 mmHg and 10.22 ± 5.68 mmHg) rather than a CCT cohort (9.11 ± 4.65 mmHg and 15.19 ± 5.68 mmHg).1 Also consistent with previous reports, our patient did not respond to volume infusions.7 The significance of our patient's pericardial effusion was demonstrated by a 59% increase in his CI following pericardiocentesis.
3.2 Illustrative hemodynamics of LPCT
In normal physiology, as the intrathoracic pressure decreases during inspiration, this effect is transmitted in different degrees to the cardiac chambers compared to the pulmonary veins. During inspiration, the pressure gradient between the pulmonary veins and the left heart decreases. As intrathoracic pressure decreases, the pulmonary veins become more distensible with higher capacitance and thus decrease forward flow. Left ventricular SV decreases with the first heart beat after the onset of inspiration, suggesting that respiratory influence on left ventricular SV is primarily a left sided phenomenon.8 Systemic arterial systolic, diastolic, and pulse pressures are lowest during inspiration, possibly due to (1) transmission of the respiratory variation in intrathoracic pressure to the arterial system and (2) respirophasic changes in left ventricular SV.9 If a significant pericardial effusion is present, intraventricular dependence increases left ventricular end diastolic pressure, which further decreases the gradient leading from the pulmonary veins to the left ventricle and lowers CI. This causes a fall in systemic pressure during inspiration and manifests as an abnormal PP.10, 11
In LPCT, low intracardiac filling pressures can mask the exaggerated PP. Our patient's invasive hemodynamics provide a reasonable explanation for this finding. Upon the initiation of inspiration, the PAW pressure initially falls to near or just below the IPP (Figure 5). However, after one cardiac cycle, the PAW pressure again exceeds the IPP. The initial inspiratory fall in PAW pressure can be explained by the transient increase of pulmonary vein capacitance. However, the subsequent rise in PAW pressure can be explained by the series effect of an increase in left ventricular filling as a result of increased inspiratory right heart filling and output.6, 12, 13 The absence of high intracardiac and intrapericardial pressures in LPCT may allow some degree of intracardiac distensibility, augmenting LV filling and output and thus reducing the exaggeration of the PP.
However, there is a limit to how much increased intracardiac filling the intrapericardial fluid is able to accommodate. Even with volume expansion in tamponade patients with hypovolemia, the benefits may be limited and not an alternative to pericardiocentesis.6, 7 Fluid challenge in LPCT increased intracardiac filling pressures but did not yield a significant improvement in SV.6 The subsequent rise in PP seen after fluid challenge supports there being a window where right heart output can sustain left heart filling before a critical pericardial constraint occurs and interventricular dependence prevents further augmentation.
After complete removal of the pericardial fluid, the presence of a subatmospheric IPP was noted (Figures 7 and 9). The persistence of this negative value, despite transducer leveling with the patient's mid-thoracic cavity and atmospheric zero confirmation, was likely the result of limitations of catheter-based pressure measurements in a potential space.14 However, subatmopheric values are consistent with prior findings in LPCT patients (mean IPP −3.45 ± 1.84 mmHg).1
3.3 Cardiac tamponade in isolation versus concomitant pericardial constriction
Effusive-constrictive pericarditis has been described in patients presenting with CCT and persistently elevated right-sided pressures after pericardiocentesis.15 However, there has not been a mechanistic association between LPCT and pericardial constriction. One possible explanation for the lack of improvement with volume expansion in LPCT could be related to underlying pericardial constriction. Here, the invasive hemodynamics after pericardiocentesis suggest the possibility of constriction, most likely related to the presence of pericardial inflammation from acute pericarditis. Postpericardiocentesis, there was evidence of a persistent Kussmaul sign, right- and left-sided respirophasic discordance when measured from the RA and PAW positions, respectively, prominent x and y descents on the RA pressure tracing, and the “square-root” sign in the RV pressure tracing (Figure 8). Additionally, the presence of a PAW pressure-RV end diastolic pressure (RVEDP) difference of less than 5 mmHg (3 mmHg), a PA systolic pressure of less than 55 mmHg (24 mmHg), and an inspiratory decrease in RA pressure of less than 5 mmHg are supportive. However, the RVEDP:RV systolic pressure ratio was not greater than 1/3. LV measurements were not available to evaluate for LV rapid filling wave amplitude or calculate the systolic area index. Notably, the low right-sided pressures would not be typical of constrictive pericarditis. Low right-sided pressures may be explained by hypovolemia, though this is likely to have been at least partly ameliorated with preprocedure blood transfusion. However, dehydration was only present in a minority of LPCT patients, suggesting an alternate physiologic process.1 The hemodynamic findings are highly suggestive of a concurrent overlap of dual mechanisms of pericardial constraint, from compressive pericardial effusion and constrictive pericarditis, each with separate underlying mechanisms that effectively exerts its own unique constrictive influence in impairing ventricular filling and limiting responsiveness to volume expansion (Table 1).
| Baseline | Postpericardiocentesis | |
|---|---|---|
| Intrapericardial pressure (mean, mmHg) | 7 | −7 |
| Right atrial pressure (mean, mmHg) | 8 | 1 |
| Right atrial transmural pressure (mean, mmHg) | <1 | 8 |
| Right ventricular pressure (s/d, mmHg) | 21/7/10 | 21/−3/1 |
| Pulmonary artery pressure (s/d/m, mmHg) | 20/9/13 | 16/4/9 |
| Pulmonary artery wedge pressure (mean, mmHg) | 10 | 4 |
| Left atrial transmural pressure (mean, mmHg) | 2 | 10 |
| Arterial pressure (s/d/m, mmHg) | 103/62/76 | 106/51/70 |
| Hemodynamic pulsus paradoxus (mmHg) | 10 | 7 |
| Heart rate (beats/min) | 108 | 86 |
| Cardiac index (L/min-m2) | 2.0 | 3.3 |
| Stroke volume index (mL/beat-m2) | 19.4 | 38.8 |
| Systemic vascular resistance (dynes-s/cm5) | 1714.3 | 1035.0 |
| Pulmonary artery oxygen saturation (%) | 49.6 | 67.7 |
4 CONCLUSION
This patient's case and hemodynamic tracings contribute to mechanistic understanding of LPCT physiology. The features of pericardial constriction after pericardiocentesis may provide a plausible explanation as to why LPCT may not respond to volume expansion. The presence of pericardial constraint from a pericardial effusion and pericardial inflammation suggests that LPCT exists on a spectrum of pericardial pathologies with shared physiologic processes with CCT and constrictive pericarditis.
CONFLICT OF INTEREST STATEMENT
The authors declare no conflict of interest.
Open Research
DATA AVAILABILITY STATEMENT
The data that supports the findings of this study are in the article.


