SARM suppresses glioma progression in GL261 glioma cells and regulates microglial polarization
Abstract
Microglia is the major cellular component of glioma mass that promotes glioma growth, invasion, and chemoresistance by releasing inflammatory factors. Sterile alpha and HEAT/Armadillo motif (SARM), a member of the Toll-interleukin-1 receptor (TIR) domain-containing adaptor family, is primarily expressed in the central nervous system. However, the role of SARM in glioma is still undefined. In the present work, we examined the function of SARM in microglial polarization and glioma progression. Our results showed that forced the expression of SARM in GL261 glioma cells inhibited tumor growth, and reduced interleukin (IL)-6 secretion in conditioned media. Silencing of SARM in microglia cells inhibited IL-4-induced M2 polarization, enhanced lipopolysaccharide -induced M1 microglial polarization. Furthermore, overexpression of SARM increased the migration of microglia cells upon TGFβ stimulation. These data suggested that SARM is involved in neuro-inflammation and microglia activation. In summary, this study provides novel insight into the mechanisms of microglial polarization.
1 INTRODUCTION
Glioblastoma (GBM) is the most common primary tumor in central nervous system (CNS) (Furnari et al., 2007). Stromal cells, vascular cells, and infiltrating and resident immune cells surround the GBM and constitute the glioma microenvironment. Substantial evidence has revealed that glioma microenvironment influences glioma development, including initiation, growth, and metastasis (Charles et al., 2012). Among the tumor-infiltrating non-neoplastic components in the glioma mass, microglia/macrophages (TAMs) are the most abundant immune cell population (Hambardzumyan et al., 2016). The changes of glioma microenvironment can induce TAMs polarization into alternatively activated M2 type macrophages (anti-inflammatory) compared with classically activated M1 type macrophages (pro-inflammatory) (Koh et al., 2018). M1-activated microglia secrete pro-inflammatory, including tumor necrosis factor-α (TNF-α), interleukin (IL)-1β, and IL-6 (Li & Graeber, 2012). IL-4 and IL-10 activate M2 phenotype microglia, which is defined by express arginase-1 (ARG-1), macrophage galactose-type C-type lectin 2 (MGL2), and CD206 (Gabrusiewicz et al., 2011). Understanding the molecular mechanisms of polarization of TAMs is critical to design therapeutic strategies for glioma treatment.
Under the pathological condition, microglia migrates to the lesion site of brain to release inflammatory molecules and present disease-associated antigen, thereby contributing to CNS disease pathobiology (Napoli & Neumann, 2009; Wlodarczyk et al., 2014). These responses are regulated by Toll-like receptors (TLRs) (Dzaye et al., 2016). Sterile alpha and HEAT/Armadillo motif (SARM), a most conserved member of the Toll/Il-1 Receptor (TIR) adaptor family, is evolutionarily conserved from arthropods to mammals (O'Neill et al., 2003). Unlike the other TIR proteins, SARM typically inhibits TLR signaling rather than participate in transducing signals downstream of TLRs. SARM has been shown to be involved in neuronal apoptosis but does not affect the amount of viral RNA following La Crosse virus (LACV) (Mukherjee et al., 2013). In addition to its role in regulating innate immunity, SARM plays pivotal role in activating different forms of cell death following cellular stress. For example, SARM can recruit JNK kinase 3 to the mitochondrial compartment to trigger cell death (Kim et al., 2007). SARM induces apoptosis in CD8 + T cells upon immune challenge (Panneerselvam et al., 2013). A previous study showed that SARM is expressed mainly in the CNS, particularly in neurons (Szretter et al., 2009). Axon degeneration is a key pathological feature in Parkinson's disease, and wallerian degeneration (WD) is a specific form of axon degeneration. Osterloh et al. performed a forward genetic screen in Drosophila and found that deficiency in SARM leads to inhibition of axon degeneration in Drosophila (Osterloh et al., 2012). These protective effects of SARM deficiency also observed in mice, indicating that the role of SARM in WD is conserved from insects to mammals (Osterloh et al., 2012). However, the role of SARM in glioma is not currently clear.
The aim of this study is to elucidate the function of SARM in glioma. Our results showed that overexpression of SARM suppressed glioma cell growth and in inhibited TNF-α-induced NF-κB activation. We also investigated the effect of SARM in microglial polarization.
2 MATERIALS AND METHODS
2.1 Cell culture
The glioma cell lines GL261, U251, and U87MG, and microglia cell line BV-2 were purchased from the Cell Bank of Type Culture Collection of Chinese Academy of Sciences and maintained in Dulbecco's modified Eagle's medium (DMEM) medium supplemented with 10% fetal bovine serum (Gibco; Thermo Fisher Scientific, Inc.) and 1% penicillin-streptomycin at 37°C and 5% CO2. Normal human astrocytes (NHA) were purchased from JENNIO Biological Technology and cultured as per supplied instructions.
2.2 Plasmid constructs and lentiviral stable cell line establishment
Lentiviruses expressing SARM (LV-SARM), empty vector (LV), shRNA sequences targeting SARM (pGLVU6-Puro-shSARM), and scramble control (pGLVU6-Puro-shSARM) were designed and purchased from GenePharma. Lentivirus production and transduction were performed as previously described (Biechele et al., 2009). The infected cells were selected with puromycin (3 µg/ml). Total RNA and proteins were extracted from cells to verify the efficiency of overexpression or knockdown.
2.3 GL261 glioma subcutaneous (s.c.) tumor model in nude mice
Male BALB/c nude mice (6–8 weeks old) were purchased from animal experiment center of Guangxi Medical University. Mice were housed under controlled laboratory conditions of temperature (23 ± 2°C), humidity (50 ± 5%), and light (light/dark 12/12 h). All facilities were approved by the Animal Care and Ethics Committee of Guangxi Medical University. To generate glioma tumor, stable SARM knockdown cells or scrambled shRNA-transfected cells were suspended in 200 µl DMEM medium, and then injected subcutaneously into the right feet of mice. Tumor size in each mouse was evaluated using the formula: V (mm3) = 1/6 π × length (mm) × width2 (mm2). Mice were euthanized 16 days after implantation. Tumors were excised, weighed, and photographed.
2.4 Quantitative reverse-transcription polymerase chain reaction (RT‑qPCR)
Total RNA was extracted from cells using TRIzol regent (Beijing Beyotime Co., Ltd.) according to the manufacturer's instructions. The cDNA was synthesized with PrimeScrip™ RT Master Mix cDNA synthesis system. TB GreenTM Premix EX Taq™ II was used for quantification. The expression of the gene of interest was normalized to the RNA level of GAPDH. The primers used in this study were listed in Table 1.
| Gene primers | Primer sequence |
|---|---|
| GAPDH-F | TCCTGGTATGACAACGAAT |
| GAPDH-R | GGTCTCTCTCTTCCTCTTG |
| IL-6-F | TTCCATCCAGTTGCCTTCTT |
| IL-6-R | CAGAATTGCCATTGCACAAC |
| IL-1β-F | TCCAGGATGAGGACATGAGCAC |
| IL-1β-R | GAACGTCACACACCAGCAGGTTA |
| TNF-α-F | CATCTTCTCAAAATTCGAGTGACA |
| TNF-α-R | TGGGAGTAGACAAGGTACAACCC |
| COX-2-F | CAGGCTGAACTTCGAAACA |
| COX-2-R | GCTCACGAGGCCACTGATACCTA |
| MMP2-F | CAAGTTCCCCGGCGATGTC |
| MMP2-R | TTCTGGTCAAGGTCACCTGTC |
| MMP14-4F | CAGTATGGCTACCTACCTCCAG |
| MMP14-4R | GCCTTGCCTGTCACTTGTAAA |
- Abbreviations: F, forward primer; R, reverse primer.
2.5 Western blot analysis
Total proteins were extracted from cells using Radio-Immunoprecipitation Assay (RIPA) buffer (Beijing Solarbio Science & Technology Co., Ltd.) in the presence of Protease Inhibitor Cocktail and Protein Phosphatase Inhibitor (Beijing Solarbio Science & Technology Co., Ltd.). The proteins were separated using sodium dodecyl sulfate-polyacrylamide gel electrophoresis, and then electro-blotted onto a polyvinylidene difluoride membrane, which was incubated with the primary antibodies in 5% BSA overnight at 4°C. The blots were detected using ImageLab software (Bio-Rad Laboratories, Inc.). The following primary antibodies were used: IκBα antibody (1:2000, ab32518, Abcam), phosphorylated-IκBα antibody (1:1000, ab92700, Abcam), p65 antibody (1:2000, ab32536, Abcam), phosphorylated-p65 antibody (1:1000, 3033S, Cell Signaling Technology, Inc.), SARM antibody (1:1000, 13022 S, Cell Signaling Technology, Inc.), LaminB antibody (1:2500, ab16048, Abcam), COX-2 antibody (1:2000, ab179800, Abcam), ARG-1 antibody (1:2000, 93668T, Cell Signaling Technology, Inc.). Secondary antibodies: HRP-linked anti-mouse IgG (1:8000, 7076P2, Cell Signaling Technology); HRP-linked anti-rabbit IgG (1:5000, 7074P2, Cell Signaling Technology).
2.6 Cell proliferation analysis
Cell proliferation was determined by performing Cytotoxicity Assay Kit assay (Beijing Beyotime Co., Ltd.) at 0, 24, 48, and 72 h according to the manufacturer's protocol. For BrdU staining, cells were incubated with 50 μM BrdU at 0 and 48 h, then fixed in ice-cold 70% (vol/vol) ethanol and permeabilized with 2 M HCl. After staining with anti-BrdU antibody, cells were analyzed by flow cytometry.
2.7 NF-κB reporter analysis
GL261 glioma cells expressing an NF-κB reporter lentiviral construct were established as previously described (Zhou et al., 2014). 1 ×10⁵/well NF-κB-expressing GL261 cells were plated in 12-wells and stimulated with TNF-α after transfection with empty vector or SARM overexpression vector. Luciferase activity was detected by a luciferase assay kit (Promega) according to the manufacturer's protocol.
2.8 Reagents
Bacterial lipopolysaccharide (LPS) and recombinant human TNF-α were purchased from Novoprotein. Nuclear and cytosolic fractions were prepared using Minute™ Cytoplasmic and Nuclear Fractionation kit (Invent) according to the manufacturer's instructions.
2.9 Statistical analysis
Data are expressed as mean ± standard error (SD) of the mean, from at least three independent experiments. Statistical significance was analyzed with IBM SPSS Statistics 22.0 (IBM, Amonk). Student's t-test was used to analyze the comparison between two groups. Analysis of variance followed by a Tukey–Kramer post hoc test was used to analyze data in more than two groups. p-values below .05 were considered to indicate a statistically significant difference.
3 RESULTS
3.1 SARM overexpression suppressed glioma cell growth
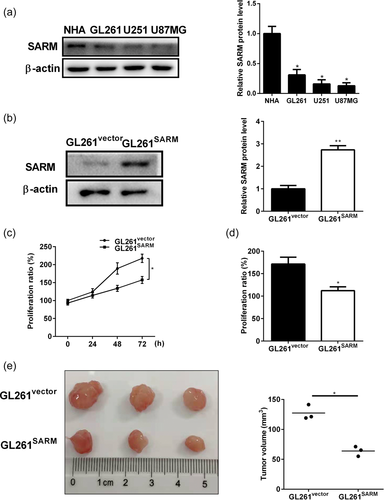
To determine the role of SARM, we first examined the expression of SARM in different glioma cell lines, including GL261, U251, and U87MG, as well as normal human astrocytes (NHA). As shown in Figure 1a, SARM expression was lower in all the glioma cell lines compared with NHA. We next generated SARM-overexpression GL261 cell lines (GL261SARM) by transfecting with SARM overexpression plasmid. Stable transfection was verified by western blot with SARM antibody (Figure 1b). The effect of SARM on proliferation in GL261 cells was investigated using MTT viability (Figure 1c) and BrdU proliferation (Figure 1d) assays. The results showed that SARM overexpression significantly inhibited GL261 cell growth. Further, the effect of SARM overexpression on tumor growth was examined by injecting GL261 cells into nude mice. Tumors established in mice implanted with GL261SARM cells were smaller than tumors arising from control cells (GL261vector) (Figure 1e). These results indicated that overexpression of SARM inhibited glioma progression.
3.2 SARM attenuates TNF-α-induced activation of NF-κB pathway in glioma cells
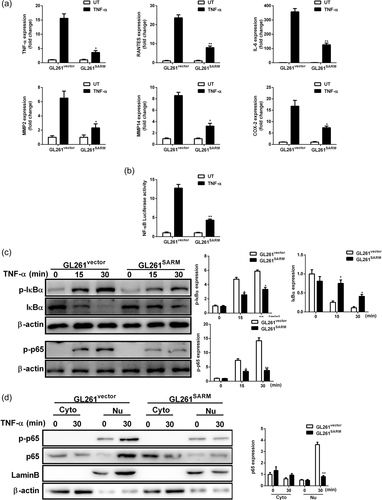
SARM has been shown to be involved in regulation of NF-κB pathway (Carty et al., 2006). In addition, TNF-α induces IL-6 release through the phosphorylation of NF-κB (Yamaguchi et al., 2009). We next assessed the role of SARM on TNF-α-induced NF-κB activation in glioma cells. Treatment GL261vector cells with TNF-α notably increased the RNA expression of TNF-α, RANTES, IL-6, MMP2, MMP14, and COX-2, whereas GL261SARM cells had severely blunted responses to TNF-α (Figure 2a). Furthermore, SARM overexpression indeed inhibited TNF-α-induced activation of NF-κB luciferase activity (Figure 2b). In support of this finding, overexpression of SARM obviously suppressed TNF-α-induced phosphorylation of IκBα and p65, IκΒ degradation (Figure 2c). It was also observed that SARM reduced nuclear translocation of the p65 subunit of NF-κB (Figure 2d). Based on these results, SARM can suppress TNF-α-induced inflammatory activation in GL261 cells.
3.3 SARM inhibits microglial activation induced by the conditioned media from glioma cells
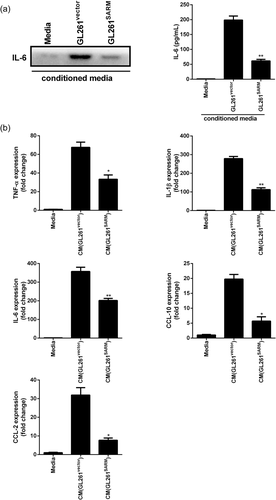
In addition to the immunomodulatory effects, IL-6 has been shown to exerts its proliferative function on GBM (Kudo et al., 2009). We observed SARM overexpression inhibited the secretion of IL-6 in culture media (Figure 3a). Cytokines secreted by glioma cells can activate microglia, which modulate glioma progression. Thus, we examined the effect of conditioned media (CM) from glioma cells on microglial activation. As shown in Figure 3b, cm from GL261WT cells significantly increased the expression of TNF-α, IL-6, IL-1β, CCL-2, and CCL-10 in BV-2 microglia cells (Figure 3b). However, overexpression of SARM suppressed the CM-mediated pro-inflammatory response in BV-2 microglia cells.
3.4 Knockdown of SARM suppresses IL-4-induced M2 polarization and promotes LPS-induced M1 activation
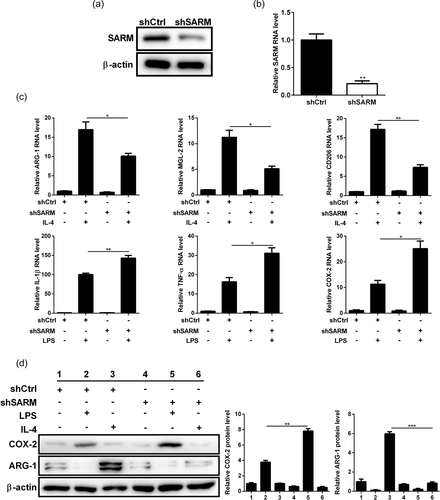
Next, we investigated the effect of SARM on microglial polarization. Stable SARM knockdown BV-2 microglia cells was achieved by transfection of sh-SARM lentiviral particles. Western blot analysis and qPCR results confirmed the knockdown of SARM in BV-2 cells (Figure 4a,b). After the BV-2 cells were treated with IL-4, there was an increase in the expression of M2 markers ARG-1, MGL-2, and CD206. However, silencing of SARM reduced the expressions of these markers (Figure 4c). In contrast, SARM-silenced cells showed an elevation in the expressions of M1 markers (IL-1β, TNF-α, and COX-2) upon LPS stimulation (Figure 4c). Consistently, western blot results confirmed the regulatory role of SARM on ARG-1 and COX-2 protein expression in IL-4- or LPS-treated BV-2 cells (Figure 4d). Thus, SARM knockdown enhanced M1 activation and inhibited M2 polarization in microglial cells.
3.5 Knockdown of SARM decreased the migratory capacity of BV-2 microglial cells
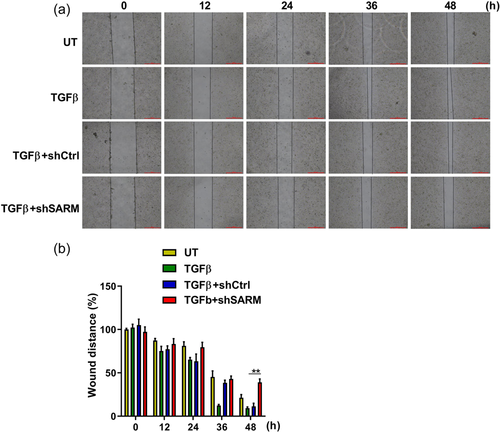
Microglial cells respond to inflammation accompanied by migration (Andreasson et al., 2016). Once activated, the cytokines and chemokines promote microglia migrate toward injured areas. We wonder whether SARM affects microglial migration; and thus, a wound-healing assay was performed to test the effect of SARM on migratory ability of BV-2 cells. The migration rate of microglial cells in SARM knockdown group was significantly decreased when compared with the control group (Figure 5a). Statistical analysis showed that silencing of SARM significantly decreased the migratory ability of BV-2 cells (Figure 5b), indicating that SARM knockdown inhibited in TGFβ-stimulated microglial cell migration.
4 DISCUSSION
GBM has a 5-year survival rate of less than 5%, which is a uniformly fatal disease (Ostrom et al., 2014). Surgery combined with radiotherapy and chemotherapy is a common treatment for glioma (Carlsson et al., 2014). Due to insufficient understanding of the pathology and the underlying molecular mechanism of glioma, there is a lack of effective treatment (Carlsson et al., 2014). In-depth understanding of microenvironment of tumor is important for the development of novel methods for the treatment of GBM treatment. The present study provides evidence that overexpression of SARM inhibits glioma cell proliferation and tumor growth (Figure 1). Despite SARM is mainly expressed in neurons of mice, a previous studies have shown that SARM is expressed in murine astrocytes which is increased with high fructose treatments (Pan & An, 2018). Interestingly, SARM protein is increased in liver when the mice are fed high-fat diets, suggesting that SARM expression is more widely distributed than previously thought (Pan & An, 2018). Our results demonstrated that SARM was higher expression in normal human astrocytes compared with the glioma cell lines. We also investigated the role of SARM in neuro-inflammatory responses (Figure 2). SARM has been shown to negatively regulated TRIF dependent TLR signaling (Carty et al., 2006). Other study also confirmed the negative regulatory role of SARM in both TRIF and MyD88-dependent TLR signaling (Peng et al., 2010). Gliomas release pro-inflammatory cytokines such as TNF-α and IL-6, which is strongly correlate with GBM progression and clinical aggressiveness (Albulescu et al., 2013). TNF-α microenvironment has been shown to play a critical role in glioma invasion (Ramaswamy et al., 2019). In this study, we observed that overexpression of SARM reduced TNF-α-induced phosphorylated IκBα and p65, indicating that SARM suppressed inflammatory activation via NF-κB pathway in glioma cells.
It was previously demonstrated that upon different viral infections, SARM contributes to the transcriptional induction of cytokines and chemokines of the CNS with different outcomes. For example, SARM was required for TNF expression in the brain stem of mice upon West Nile Virus (WNV) challenging. SARM deficient mice are more sensitive to infection with WNV compared with wild-type mice. However, mice lacking SARM showed increased survival in response to vesicular stomatitis virus (VSV) infection, indicating that SARM-dependent transcriptional response to VSV was detrimental (Hou et al., 2013). This may be attributed to the fact that SARM family members have acquired diverse biological roles during evolution (Panneerselvam & Ding, 2015). For example, the ortholog of SARM in Drosophila, Ect4, is essential for development in Drosophila, whereas SARM is redundant for viability in mice (Carty & Bowie, 2019). In addition, human SARM was identified as a negative regulator of the TLR signaling. However, TIR-1, the ortholog of SARM in C. elegans, was reported to play a positive role in worm immunity, due to the depletion of TIR-1 mRNA led to decreased survival of the worm upon bacterial infections (Couillault et al., 2004). IL-6 is a pleiotropic cytokine with anti-inflammatory and pro-inflammatory effects (Hunter & Jones, 2015; Mauer et al., 2014). It has been shown that IL-6 from glioma cells can induce alternative activation of tumor-infiltrating macrophages (Wang et al., 2018). In the present study, we found that upregulation of SARM reduced IL-6 release in conditioned media. Furthermore, overexpression of SARM significantly inhibited the CM-mediated pro-inflammatory response in activated microglia cells (Figure 3).
Previous studies a conserved function of SARM as a NADase, regulates multiple types of neuronal cell death (Kim et al., 2007; Summers et al., 2016). However, the role of SARM in regulation of macrophage polarization in tumors have not been completely elucidated. In this study, we showed that SARM silencing promotes M1 pro-inflammatory activation and inhibits M2 polarization in microglial cells, indicating that SARM is required for M2 polarization (Figure 4). These results suggested that apart from its direct role in glioma cell proliferation, SARM could also inhibits glioma progression by inducing microglia/macrophage M2 polarization. Furthermore, our results also indicated that the migratory ability of microglia was impaired by the downregulation of SARM (Figure 5). In conclusion, overexpression of SARM suppressed glioma growth. Knockdown of SARM in microglia induced aberrant pro-inflammatory cytokines release, suppressed the migratory ability of activated microglia. These observations provide new insights into the role of SARM in microglial activation and further elucidate the mechanism of SARM in neuro-inflammation-related diseases.
CONFLICTS OF INTEREST
The authors declare no conflicts of interest.
ETHICS STATEMENT
All animal experimental procedures in this study were conducted following the guidelines of Animal Care and Ethics Committee of Guangxi Medical University.
Open Research
DATA AVAILABILITY STATEMENT
The data that support the findings of this study are available from the corresponding author upon reasonable request. Data sharing is not applicable to this article.


