Silencing of COL3A1 represses proliferation, migration, invasion, and immune escape of triple negative breast cancer cells via down-regulating PD-L1 expression
Abstract
This study is designed to illuminate the specific role and underlying mechanism of collagen type III alpha 1 chain (COL3A1) in triple negative breast cancer (TNBC). Quantitative real-time polymerase chain reaction was applied to examine mRNA expression of COL3A1. Western blot analysis was employed to determine protein levels of COL3A1, programmed death ligand 1 (PD-L1), Bcl-2, and cleaved caspase-3. Immunohistochemistry staining was utilized for assessing protein expression of Ki67 and COL3A1 in tissues. The proliferous capacity of cells was assessed through CCK-8 assay and 5-Ethynyl-2′-deoxyuridine assay. Cell apoptosis and the percentage of CD8+ T cells were measured using flow cytometry. Migration and invasion of TNBC cells were examined via transwell assay. Lactate dehydrogenase (LDH) release was measured via a LDH assay kit. For establishing a xenograft tumor model, MDA-MB-231 cells were injected into the flank of mice through subcutaneous injection. COL3A1 expression was raised in TNBC tissues and cells, and it was inversely associated with overall survival data of TNBC patients. COL3A1 downregulation repressed proliferation, invasion, migration, and immune escape of TNBC cells along with tumor growth of xenograft mice. In TNBC cells and tumor tissues of mice, protein expression of PD-L1 was reduced by COL3A1 knockdown. COL3A1 knockdown-mediated inhibitory effects on cell proliferation, migration, invasion, and immune escape were reversed by PD-L1 upregulation in vitro. Silencing of COL3A1 exerted an antitumor role in TNBC, implying its potential as a therapeutic target for TNBC.
1 INTRODUCTION
Breast cancer (BC) is acknowledged as a prevalent malignant tumor in women, and triple negative breast cancer (TNBC) is the most aggressive form of BC (Kumar & Aggarwal, 2016; Sukumar et al., 2021; Torre et al., 2015). TNBC makes up 15% of BC cases (Bray et al., 2018; Gluz et al., 2009), which possesses high risk of recurrence and metastasis (Abramson et al., 2015). It is reported that overall survival of metastatic TNBC patients is less than 1 year (Dent et al., 2007; Howard & Olopade, 2021). At present, cytotoxic chemotherapy and radiotherapy are major therapeutic tactics for TNBC patients, but therapeutic efficiency remains unfavorable (Bianchini et al., 2016; Lyons, 2019; Won & Spruck, 2020). Therefore, seeking for novel effective targets is essential for preventing and treating TNBC.
Collagen type III alpha 1 chain (COL3A1), an extracellular matrix protein, is a key structural component of hollow organs (Frank et al., 2015; Kuivaniemi & Tromp, 2019). Multiple reports have demonstrated that COL3A1 is involved in malignant phenotypes of cancers (S. Han et al., 2021; Yuan et al., 2017). For example, Engqvist et al. (2019) have revealed that COL3A1 upregulation is closely correlated with a worse survival of ovarian cancer (OC) patients. S. W. Zhang et al. (2020) have found that high expression of COL3A1 is associated with the high pathologic stage of esophageal cancer (EC) patients. More importantly, a recent study has uncovered that METTL3 suppresses metastasis of TNBC cells by downregulating COL3A1 expression (Shi et al., 2020). TCGA analysis has showed that COL3A1 expression is elevated in TNBC tissues. Nonetheless, there are few studies on the specific function of COL3A1 in TNBC.
It is acknowledged that immune escape mediated by programmed cell death-1/programmed death ligand 1 (PD-L1) exerts a critical role in several cancers (Davoli et al., 2017; Xie et al., 2019). Meantime, ample evidence has validated the importance of PD-L1 for TNBC development (Chen et al., 2021; Lotfinejad et al., 2021; Y. Zhang et al., 2021). For instance, silencing of PD-L1 is found to suppress proliferation and migration of TNBC cells (Lotfinejad et al., 2021). PD-L1 overexpression is revealed to facilitate TNBC development by enhancing epithelial–mesenchymal transition (EMT) (Chen et al., 2021). Notably, COL3A1 upregulation is uncovered to facilitate immune evasion in cancers (H. Zhang et al., 2021). However, whether COL3A1 fulfills an important role via interacting with PD-L1 in TNBC has not been elucidated.
In this investigation, COL3A1 expression, together with the function of COL3A1, was detected in TNBC tissues and cells. Furthermore, the underlying mechanism of COL3A1-mediated carcinogenesis was also investigated in TNBC.
2 MATERIALS AND METHODS
2.1 Collection of tissue samples
Total 68 pairs of TNBC tissues and adjacent normal tissues were acquired from TNBC patients of Fuzhou First Hospital Affiliated to Fujian Medical University between August 2019 and February 2021. None of patients received radiotherapy or chemotherapy before surgery, and patients with other diseases were excluded from this investigation. This study got permission from the Ethics Committee of Fuzhou First Hospital Affiliated to Fujian Medical University, and all participants have signed informed consents. Moreover, TNBC patients were assigned into COL3A1 low or high-expression group on the basis of the median value of COL3A1 expression in tumor tissues.
2.2 Cell culture
A human normal breast epithelial cell line (MCF10A) and human TNBC cell lines (BT-549, MDA-MB-231, and MDA-MB-468) were bought from American Type Culture Collection (ATCC). Dulbecco's modified Eagle's medium (DMEM; Invitrogen) containing 10% fetal bovine serum (FBS) and 1% penicillin/streptomycin was utilized for cell culture. All cells were maintained at 37°C in an incubator with 5% CO2.
2.3 Cell transfection
The small interfering RNA against COL3A1 (si-COL3A1#1, si-COL3A1#2, and si-COL3A1#3), si-negative control (NC), pcDNA3.1-PD-L1 (including full length of PD-L1), and pcDNA3.1-NC were bought from Genepharma. Then these plasmids were transfected into BT-549 and MDA-MB-231 cells through Lipofectamine 3000 (Invitrogen) for 48 h.
2.4 Quantitative real-time polymerase chain reaction (qRT-PCR)
Total RNAs of TNBC tissues were obtained using RNAiso Plus reagent (Takara), which were then used for synthesis of complementary DNAs (cDNAs) according to instructions of a PrimeScript RT reagent kit (Takara). After that, cDNAs were applied to perform qRT-PCR through the SYBR Green PCR kit (Takara). Reaction procedures for PCR were exhibited as follows: 5 min at 94°C, 35 cycles of 20 s at 94°C, 40 s at 60°C, and 2 min at 72°C. Primer sequences (Sangon) were listed as follows: COL3A1-F, TTGAAGGAGGATGTTCCCATCT; COL3A1-R, ACAGACACATATTTGGCATGGTT; GAPDH-F, CTGACTTCAACAGCGACACC; GAPDH-R, CCCTGTTGCTGTAGCCAAAT. The 2−ΔΔct method was used for calculating relative mRNA expression of COL3A1 normalized to GAPDH.
2.5 CCK-8 assay
Proliferation of MDA-MB-231 and BT-549 cells was tested based on instructions of a CCK-8 kit (Boster Biological Technology). In detail, transfected cells (5 × 10³ cells/well) were put into 96-well plates, which were maintained for 0, 24, 48, and 72 h. Then, 10 μl CCK-8 solution was appended to each well to incubate for 1 h. After plates were washed with phosphate buffered solution, a microplate reader (MG LABTECH) was employed to monitor the optical density at 450 nm.
2.6 5-Ethynyl-2′-deoxyuridine (EdU) proliferation assay
The ability of MDA-MB-231 and BT-549 cells to proliferate was evaluated using EdU proliferation assay (RiboBio). Briefly, cells were subjected to EdU (50 μm) to incubate for 2 h. Afterward, these cells were stained using Apolo and 4′,6-diamidi-no-2-phenylindole and a fluorescence microscopy was used for detection of EdU-positive cells.
2.7 Flow cytometry analysis
Transfected MDA-MB-231 and BT-549 cells (1 × 10⁵ cells/well) were plated in six-well plates, followed by incubation with 5 μl Annexin V-FITC for 10 min and 10 μl PI for 15 min in the dark. Finally, a flow cytometer (BD Biosciences) was applied to assess cell apoptosis rate.
Moreover, transfected cells were cocultured with CD8+ T cells, after which flow cytometry was used for detecting the percentage of CD8+ T cells or apoptosis of CD8+ T cells.
2.8 Transwell assay
The transwell chamber (8.0 μm pore size; Millipore) coated with Matrigel (BD Biosciences) was utilized for evaluating the invasive capacity of transfected MDA-MB-231 and BT-549 cells. In short, the upper chamber was filled with 100 μl cell suspension suspended in FBS-free DMEM. Then, 600 μl DMEM containing 10% FBS was appended to the lower chamber. Following 48 h of incubation, cells in the lower chamber were fixed using methanol and then stained using crystal violet. An optical microscope was utilized for counting the number of stained cells.
Besides, the cell migratory ability was assessed via the upper chamber without Matrigel and other procedures were the same as the evaluation of cell invasion.
2.9 Lactate dehydrogenase (LDH) cytotoxicity assay
A LDH assay kit (Beyotime) was used for measuring LDH leakage. This assay was executed in 96-well plates, and a microplate reader (Thermo Fisher Scientific) was employed to measure the absorbance at 490 nm.
2.10 Western blot analysis
RIPA lysis buffer (Beyotime) was utilized for extracting proteins from TNBC cells and tissues, after which protein concentration was measured via a BCA Protein Assay Kit (Beyotime). Next, 10% SDS-PAGE was applied to separate these proteins. Then, these proteins were transferred to polyvinylidene difluoride membranes (Millipore), followed by block using 5% skim milk. Subsequently, primary antibodies (Abcam) including anti-COL3A1 (1:1000, ab184993), anticleaved caspase-3 (1:500, ab32042), anti-Bcl-2 (1:1000, ab32124), anti-PD-L1 (1:1000, ab205921), and anti-β-actin (1:200, ab115777) were added to immerse membranes overnight. After being washed using TBST, the secondary antibody (1:2000, ab6721) was added to react for 1 h. Eventually, the enhanced chemiluminenscent detection system was employed to examine protein blots. Image J software (NIH) was used for analyzing the intensity of protein blots.
2.11 Immunohistochemistry (IHC) staining
TNBC tissues fixed by 4% paraformaldehyde were embedded by paraffin, after which these tissues were cut into segments (4 μm), dewaxed, and rehydrated. Following antigen repair and seal of nonspecific sites, these sections reacted with primary antibodies including anti-COL3A1 (1:500, ab6310; Abcam), anti-Ki67 (1:200, ab16667; Abcam), and anticleaved caspase-3 (1:400, #9661; CST) overnight. After that, the secondary antibody (1:500, ab6112; Abcam) was added, followed by addition of 3,3′-diaminobenzidine substrate solution. At last, hematoxylin was used for staining these samples and staining areas were observed through a microscope.
2.12 In vivo experiment
Procedures of animal experiments have got permission from the Institutional Animal Care and Use Committee of Fuzhou First Hospital Affiliated to Fujian Medical University, and conformed to the guide for care and use of laboratory animals published by the NIH. BALB/C nude mice (6-week-old, female) from Chinese Academy of Sciences were kept at 25°C under the condition of 50% humidity and a 12h light/dark cycle. For stable transfection, lentiviral sh-NC (LV-sh-NC) and lentiviral sh-COL3A1 (LV-sh-COL3A1) were bought from Genechem. All mice were assigned into two groups (n = 5 mice/group). MDA-MB-231 cells (5 × 10⁶ cells in 0.1 ml/mouse) carrying LV-sh-NC/LV-sh-COL3A1 were introduced into the flank of mice through subcutaneous injection (Fan et al., 2021). The tumor size of mice was gauged every week after injection. Tumor volume was measured with the formula V = (shortest diameter)2 × (longest diameter) × 0.5. Following 4 weeks of injection, mice anesthetized using pentobarbital sodium were killed and tumors were separated from mice.
2.13 Statistical analysis
GraphPad Prism 7.0 (GraphPad Software Inc.) was employed to perform statistical analysis. Data from three independent experiments were displayed as mean ± standard deviation. Difference evaluation between two groups was carried out using Student's t test. Difference estimation among multiple groups was performed via one-way analysis of variance, followed by Tukey's multiple comparisons test. Statistical significance was identified as any difference with p < .05.
3 RESULTS
3.1 COL3A1 upregulation is observed in TNBC tissues and cells
First of all, we analyzed COL3A1 expression using the Gene Expression Profiling Interactive Analysis (GEPIA) database, and discovered that COL3A1 expression in tumor tissues was remarkably higher than that in adjacent normal tissues (Figure 1a, p < .05). Based on data from qRT-PCR, we also observed high expression of COL3A1 in tumor tissues compared to adjacent normal tissues (Figure 1b, p < .01). Afterward, we verified correlation between COL3A1 expression and survival of TNBC patients. Indeed, COL3A1 upregulation resulted in poor survival data of TNBC patients (Figure 1c, p < .01). Furthermore, protein expression of COL3A1 was determined via western blot and IHC staining, and found that the protein expression COL3A1 in tumor tissues was boosted compared to normal tissues (Figure 1d,e, p < .05).
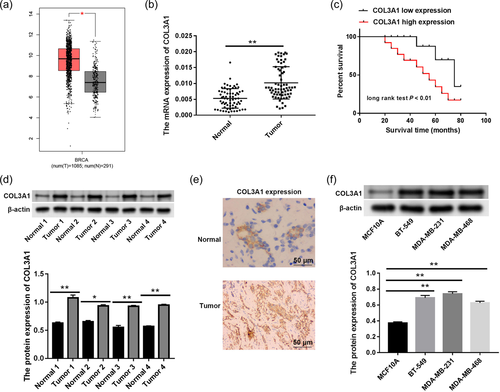
When we assessed protein expression of COL3A1 in human normal breast epithelial cells (MCF10A) and TNBC cells, COL3A1 upregulation was observed in BT-549, MDA-MB-231, and MDA-MB-468 cells as opposed to MCF10A cells (Figure 1f, p < .01). MDA-MB-231 and BT-549 cells were used to perform subsequent experiments since they showed higher expression of COL3A1 than MDA-MB-468 cells.
3.2 Silencing of COL3A1 represses proliferation and induced apoptosis in TNBC cells
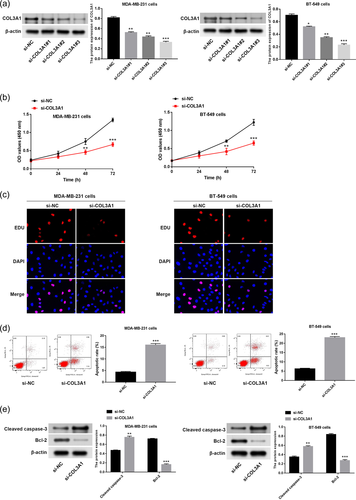
In consideration of COL3A1 upregulation in TNBC, we then explored the potential role of COL3A1 via loss-of-function assays. As displayed in Figure 2a, COL3A1 was silenced by transfection of si-COL3A1#1, si-COL3A1#2, and si-COL3A1#3 in MDA-MB-231 and BT-549 cells (p < .05), and si-COL3A1#3 was used for following function experiments. Based on results of CCK-8 and EdU assays, we discovered that the proliferation capacity of MDA-MB-231 and BT-549 cells was evidently suppressed after COL3A1 knockdown (Figure 2b,c, p < .01). According to data of flow cytometry (Figure 2d), we found that the apoptotic rate of MDA-MB-231 and BT-549 cells was markedly elevated following COL3A1 knockdown (p < .001). At the same time, expression levels of apoptosis-related proteins were detected using western blot, which indicated that COL3A1 knockdown facilitated protein expression of cleaved caspase-3 but repressed protein expression of Bcl-2 in MDA-MB-231 and BT-549 cells (Figure 2e, p < .01).
3.3 COL3A1 downregulation impedes migration, invasion, and immune escape of TNBC cells
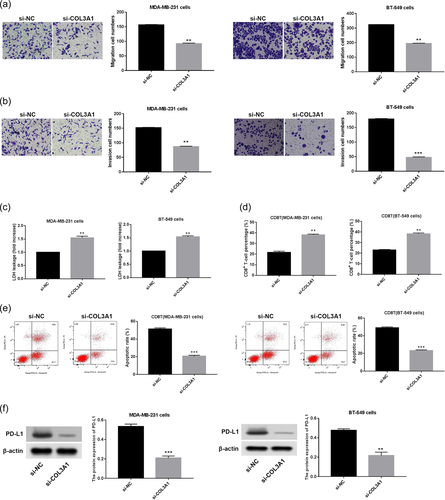
Afterward, malignant behavior changes of TNBC cells affected by COL3A1 were explored. It was demonstrated that migration and invasion abilities of MDA-MB-231 and BT-549 cells were attenuated by COL3A1 downregulation (Figure 3a,b, p < .01). Moreover, immune escape of cancer cells to CD8+ T cells is a key inducement for cancer progression, accompanied by upregulation of PD-L1 expression and exclusion of CD8+ T cells (Fang et al., 2021; Liu et al., 2020; Spranger, 2016). Thus, for probing the effect of COL3A1 downregulation on immune escape of TNBC cells, following experiments were implemented. It was demonstrated that COL3A1 knockdown led to the increase of LDH release in MDA-MB-231 and CD8+ T cocultured cells or BT-549 cells and CD8+ T cocultured cells (Figure 3c, p < .01). Besides, the percentage of CD8+ T cells was raised in response to COL3A1 knockdown, and the apoptosis rate of CD8+ T cells was reduced in response to COL3A1 knockdown in MDA-MB-231 and BT-549 cells (Figure 3d,e, p < .01). The protein level of PD-L1 was diminished by COL3A1 knockdown in MDA-MB-231 and BT-549 cells (Figure 3f, p < .01). These findings suggested the oncogenic property of COL3A1 in TNBC.
3.4 PD-L1 overexpression partly reverses inhibitory impacts of COL3A1 knockdown on proliferation, migration, invasiveness and immune escape of TNBC cells
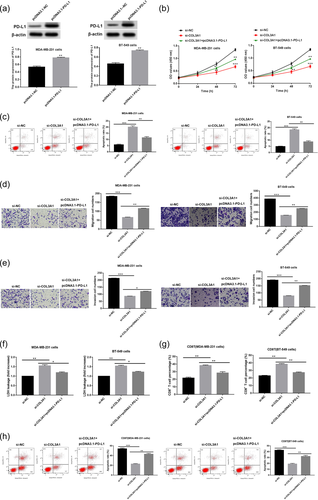
To verify whether PD-L1 was implicated in COL3A1 knockdown-mediated inhibitory effect on TNBC progression, PD-L1 was firstly overexpressed through transfection of pcDNA3.1-PD-L1. As expected, PD-L1 expression was notably boosted after transfection of pcDNA3.1-PD-L1 in MDA-MB-231 and BT-549 cells (Figure 4a, p < .01). Subsequently, rescue assays of cell proliferation, apoptosis, migration, invasion, and immune escape were conducted. It was demonstrated that the suppressive effect of COL3A1 knockdown on cell proliferation and the promoting effect of COL3A1 knockdown on cell apoptosis were reversed by PD-L1 overexpression (Figure 4b,c, p < .01). Likewise, migration and invasion repression of MDA-MB-231 and BT-549 cells caused by COL3A1 knockdown was reversed by PD-L1 overexpression (Figure 4d,e, p < .05). In addition, the promoting effects of COL3A1 knockdown on LDH release and the percentage of CD8+ T cells as well as the suppressive effect of COL3A1 knockdown on apoptosis rate of CD8+ T cells were partly abolished by PD-L1 overexpression in MDA-MB-231 and BT-549 cells (Figure 4f–h, p < .05). Above outcomes indicated that COL3A1 knockdown made impact on TNBC progression via regulating PD-L1 expression.
3.5 Silencing of COL3A1 represses tumor growth in vivo
At last, the influence of COL3A1 on tumor growth was validated in xenograft mice. As manifested in Figure 5a,b, tumor size and tumor volume in the LV-sh-COL3A1 group were smaller than that in the LV-sh-NC group (p < .05). Tumor weight in the LV-sh-COL3A1 group was lower than that in the LV-sh-NC group (Figure 5c, p < .001). In contrast to the LV-sh-NC group, Ki67 expression in tumor tissues was evidently reduced in the LV-sh-COL3A1 group and cleaved caspase-3 expression in tumor tissues was evidently boosted in the LV-sh-COL3A1 group, indicating that COL3A1 downregulation suppressed cell proliferation in tumors (Figure 5d). Besides, regulatory relation between COL3A1 and PD-L1 was verified in tumor tissues, which indicated that protein expression of PD-L1 was diminished after COL3A1 knockdown (Figure 5e, p < .01).

4 DISCUSSION
For the past few years, TNBC still threatens women's life and health, demanding the consideration of novel effective targets to prevent this disease (Cancer Genome Atlas Network, 2012; Manjunath & Choudhary, 2021). Emerging literatures have stated that COL3A1 is abnormally expressed in cancers and acts as a key biomarker for evaluating tumor malignancy (Engqvist et al., 2019; S. W. Zhang et al., 2020). For example, COL3A1 shows higher expression in EC tissues than that in healthy tissues, which is closely related to the advanced pathologic stage of EC patients (S. W. Zhang et al., 2020). COL3A1 upregulation is correlated with a worse survival of OC patients (Engqvist et al., 2019). Thus, we also determined COL3A1 expression in TNBC and assessed its clinical value. In line with expression trend of COL3A1 reported in prior investigation, we found high expression of COL3A1 in TNBC tissues and cells in comparison with their controls, establishing the link between COL3A1 and TNBC. Concurrently, we discovered that COL3A1 expression was negatively relevant to survival data of TNBC patients, suggesting that COL3A1 was a valuable prognostic indicator for TNBC patients.
In addition, it is demonstrated that that METTL3 impairs metastasis of TNBC cells via downregulating COL3A1 expression (Shi et al., 2020). In this regard, COL3A1 downregulation shows potential to repress TNBC development. Similarly, our results displayed that COL3A1 downregulation evidently attenuated proliferative, migratory, and invasive abilities of MDA-MB-231 and BT-549 cells and contributed to apoptosis of MDA-MB-231 and BT-549 cells. Meantime, COL3A1 downregulation inhibited tumor growth in TNBC mice. These results implied that silencing of COL3A1 suppressed malignant behaviors of TNBC. On the other hand, COL3A1 upregulation has been validated to facilitate immune evasion in cancers (Fang et al., 2021; Li et al., 2021). In this study, we observed the suppressive effect of COL3A1 knockdown on immune evasion in MDA-MB-231 and BT-549 cells, as evidenced by increased LDH release and the percentage of CD8+ T cells along with reduced apoptosis rate of CD8+ T cells and the protein level of PD-L1. Combining above findings, we deduced that COL3A1 was expected to be a promising target for TNBC treatment.
As we known, PD-L1 is responsible for immune evasion of tumor cells and inhibits CD8+ T cell cytotoxicity (Y. Han et al., 2020; Iwai et al., 2002; Juneja et al., 2017). Likewise, abundant studies have revealed promoting impacts of PD-L1 on proliferation, migration and EMT of TNBC cells (Chen et al., 2021; Lotfinejad et al., 2021). Above all, COL3A1 upregulation is demonstrated to facilitate immune evasion in cancers (H. Zhang et al., 2021). Thus, we inferred that COL3A1 is involved in TNBC development by modulating PD-L1, and then verified our hypothesis. It turned out that PD-L1 overexpression partly reversed suppressive influences of COL3A1 knockdown on proliferation, migration, invasiveness, and immune escape of MDA-MB-231 and BT-549 cells. At the same time, we observed that the protein expression of PD-L1 was reduced by COL3A1 knockdown in MDA-MB-231 and BT-549 cells as well as tumor tissues of mice. Taken together, these outcomes provided persuasive evidence that COL3A1 knockdown functioned as an antitumor factor through reducing PD-L1 expression in TNBC, which may unveil a novel therapeutic strategy for TNBC.
5 CONCLUSIONS
To conclude, COL3A1 was highly expressed in TNBC tissues and cells, which was inversely correlated with prognosis of TNBC patients. Silencing of COL3A1 repressed progression and development of TNBC in vitro and in vivo, thereby having great potential for TNBC therapy. In terms of mechanism, this study indicated that the inhibitory influences of COL3A1 knockdown on TNBC malignancy behaviors were partially mediated by PD-L1 overexpression.
AUTHOR CONTRIBUTIONS
Fan Yang: Conceptualization; writing—original draft. Ling Lin: Formal analysis. Xiaohua Li: Formal analysis. Ronglan Wen: Formal analysis. Xin Zhang: Formal analysis.
ACKNOWLEDGMENT
This study was supported by the Fujian Science and Technology Innovation Joint Fund Project (Fujian Science and Technology Department) (2018Y9122).
CONFLICT OF INTEREST
The authors declare no conflict of interest.
Open Research
DATA AVAILABILITY STATEMENT
The data that support the findings of this study are available from the corresponding author upon reasonable request.


