Dynorphin/KOR inhibits neuronal autophagy by activating mTOR signaling pathway to prevent acute seizure epilepsy
Lin Liu and Zuoliang Liu contributed equally to this study.
Abstract
In previous studies, we found that dynorphin exerts antiepileptic effect by activating the kappa opioid receptor (KOR). However, the role of neuronal autophagy in dynorphin/KOR-mediated antiepileptic is still unclear. This study aimed to investigate the molecular mechanism of dynorphin's antiepileptic effect by inhibiting autophagy and reducing neuronal apoptosis. Here, a pilocarpine-induced rat model of epilepsy was established and hippocampal neurons were treated with Mg2+-free exposed for epileptiform activity induction. The real-time polymerase chain reaction and Western blot analysis were used to evaluate messenger RNA and protein expression. The TdT-mediated dUTP-biotin nick end labeling staining and flow cytometry were used to analyze cell apoptosis in vivo and in vitro. Neuron cells viability was detected by Cell Counting Kit-8 assay. Immunofluorescent staining and green fluorescent protein-light chain 3 immunofluorescence were used to measure autophagy in vivo and in vitro. Results showed that overexpression of prodynorphin alleviated neuronal apoptosis, activated the mammalian target of rapamycin (mTOR) signaling pathway, and inhibited neuronal autophagy in epileptic rats. Dynorphin inhibited Mg2+-free-induced seizure-like neuron apoptosis, partially reversing the effect of Mg2+-free on the mTOR signaling pathway and seizure-like neuron autophagy. Further, using rapamycin, we found that dynorphin inhibited Mg2+-free-induced seizure-like neuron autophagy and apoptosis by activating the mTOR signaling pathway. In conclusion, dynorphin inhibits autophagy by activating the mTOR signaling pathway and has a protective effect on epilepsy acute seizure and epilepsy-induced brain injury.
1 INTRODUCTION
Autophagy is a major metabolic pathway for the clearance of longevity proteins and senescent or damaged organelles in the cytoplasm outside the ubiquitin-proteasome system. Under normal physiological conditions, autophagy-mediated clearance of abnormally folded ubiquitinated proteins or organelles plays an important role in maintaining cell dimensional state and health; however, under pathological conditions, abnormal autophagy can lead to cell or tissue abnormalities, and even lead to the occurrence of diseases, such as cancer, cardiovascular disease, autoimmune disease, neurodegenerative disease, etc. (Ichimiya et al., 2020).
Epilepsy is a common neurological disorder, which has a high incidence rate and mortality and seriously affects the physical and mental health and quality of life of patients (Thijs et al., 2019). More and more studies have found that autophagy is closely related to the occurrence of epilepsy, that is, autophagy is abnormally activated in the epilepsy model, and autophagy activation can lead to the occurrence of epilepsy (Fassio et al., 2020; Lv & Ma, 2020); and inhibition of autophagy can significantly improve the progress of epilepsy, such as miR-101a-3p mimics, high mobility group box-1 (HMGB1) neutralizing antibodies, hyperoside, etc., which can play a certain role in alleviating epilepsy by inhibiting autophagy (Cao et al., 2020; L. Wang, Song, et al., 2019; Ying et al., 2020).
Dynorphin is a neurotransmitter closely related to epilepsy. Many studies have shown that dynorphin is an endogenous opioid peptide with anticonvulsant effect (Agostinho et al., 2019; Simonato & Romualdi, 1996; Tortella & Holaday, 1986). In our previous study, we found that dynorphin can activate kappa opioid receptor (KOR), on the one hand, by activating PI3K/Akt signaling pathway, promote Nrf2 nuclear heterotopia, reduce neuronal oxidative damage and apoptosis (Dai et al., 2019); on the other hand, by inhibiting TLR4/NF-κB signaling pathway, promote microglia M2 polarization, and finally play an antiepileptic role (L. Liu et al., 2020).
The mammalian target of rapamycin (mTOR) signaling pathway is a serine/threonine kinase, which can regulate cell growth and proliferation through a variety of signals. mTOR signaling is a central regulator of autophagy by modulating multiple aspects of the autophagy process (Kim & Guan, 2015). Previous studies have shown that activation of mTOR can inhibit autophagy, while inhibition of mTOR can induce autophagy (Y. Wang & Zhang, 2019). It has been reported that KOR-specific agonizts can inhibit autophagy through the AMP-activated protein kinase (AMPK)-mTOR Pathway (Zhou et al., 2017). However, whether dynorphin regulates epileptic autophagy through mTOR signaling pathway has not been reported. Therefore, this study aims to explore the prevention of acute seizures effect of dynorphin by activating the mTOR signaling pathway and inhibiting autophagy.
2 MATERIALS AND METHODS
2.1 Establishment of acute seizure epilepsy model in rats and lentivirus (LV) injection
A total of 32 male Wistar rats (8 weeks old) were purchased from Charles River Laboratories. All animals were used in strict accordance with national animal experiment requirements that were approved by the animal ethics association of the Third Xiangya Hospital (Hunan, China). Rats were randomly divided into four groups (n = 8): Control group, epileptic model group, LV-Negative control (NC) (control LV) group, and LV-prodynorphin (PDYN) (PDYN overexpression LV) group. Rats in the control group received an intraperitoneal injection with PBS. The epilepsy was induced by pilocarpine injection as described in our previous study (Dai et al., 2019; L. Liu et al., 2020). Briefly, the rats in the epilepsy model group were injected intraperitoneally (ip) with lithium chloride (127 mg/kg; Sigma-Aldrich) 18 h before the first administration of pilocarpine (30 mg/kg, ip, Sigma-Aldrich). Pilocarpine (10 mg/kg, ip) was then repeatedly injected every 30 min until the rats developed seizures. One hour after the onset of the status epileptics, rats were injected with diazepam (10 mg/kg, ip) to terminate seizures.
Rats in the LV-NC group and LV-PDYN group received a stereotaxic intrahippocampus injection of LV-NC and LV-PDYN (GeneChem), respectively, as described in our previous study (L. Liu et al., 2020). After LV injection, all of the rats were kept in a standard environment for 1 week, and then given pilocarpine to observe acute seizure features. Animals were killed by decapitation 24 h after status epilepticus. The hippocampus was removed and stored in liquid nitrogen for TdT-mediated dUTP-biotin nick end labeling (TUNEL) staining and extraction of RNA and protein.
Moreover, the baseline levels of PDYN expression before the pilocarpine administration are shown in Supporting Information: Figure 1. The animals were killed on the 7th day after LV injection (1 day before the establishment of epilepsy model). Compared with LV-NC group, the messenger RNA (mRNA) and protein of PYDN were upregulated 2.4-fold in LV-PDYN group.
2.2 TUNEL staining
TUNEL staining was performed to analyze the apoptosis in rat hippocampus. Briefly, the 5 μm-thick sections were dewaxed, rehydrated, and incubated with proteinase K (20 µg/ml) at 37°C for 20 min. After that, the sections were washed with phosphate-buffered saline (PBS) twice and then incubated with the TUNEL reaction mixture provided by the in situ cell death detection kit (Roche). After washing with PBS three times, the sections were stained with diaminobenzidine (Sigma-Aldrich) for 10 min. Finally, the sections were sealed and images were acquired by an Olympus microscope. TUNEL positive cells (brown) was counted and compared with the total cells using Image-Pro Plus 6.0 software and expressed as a percentage (from three mice, respectively).
2.3 Immunofluorescent staining
The sections were dewaxed, rehydrated, and then immersed into citrate buffer for antigen repair. After that, the sections were blocked with 2% bovine serum albumin and then incubated overnight at 4°C with the following primary antibodies: anti-LC3 (1:200; Invitrogen) and anti-NeuN (1:100; Abcam), followed by incubation with the secondary antibodies Alex Fluor® 488-labeled secondary antibody (green; 1:1000; Abcam), Alex Fluor®647-labeled secondary antibody (red; 1:1000; Abcam) and 4,6-diamino-2-phenyl indole (DAPI) (blue; 1:1000) for 1 h at room temperature. Slides were observed by a fluorescent microscope (Olympus IX-71) equipped with a Canon EOS digital camera. Using Image J software, the LC3 and NeuN positive cells were separately counted from three representative slides (from three mice, respectively).
2.4 Cell isolation, culture, and identification
Hippocampal tissue of normal rats was isolated, dissected, ground, and placed on the cell plate treated with poly-d-lysine. The neural cells were cultured in the medium supplemented with 2% B27 (Neuroblastal/B27) and 10% FBS (Gibco) in the 37°C and 5% CO2. After plating for 3 days, the hippocampal neuron was treated with cytosine arabinoside (5 μm; sigma Aldrich) to inhibit astrocytes proliferation, and the medium was changed every 3 days. Hippocampal neurons cultured for 7−18 days in vitro were used for subsequent experiments.
Morphology of hippocampal neurons was observed at different cultured time points, and hippocampal neurons were identified by immunofluorescence staining of neuronal microtubule associated protein-2 (MAP-2), which suggested that hippocampal neurons in this study have been successfully isolated and have strong cell viability (Supporting Information: Figure 2).
2.5 Cell treatment
Epileptiform activity was induced in vitro by magnesium-free (Mg2+-free) physiological solution (PH7.3) supplemented with 2.5 mM KCl, 145 mM NaCl, 2 mM CaCl2, 10 mm HEPES, 10 mM glucose, and 0.002 mM glycine. After being cultured in Mg2+-free solution for 3 h, the neurons were transferred to the conventional Neuroblastal/B27 medium for further culture.
To investigate the role of KOR activation in epilepsy or the effect of mTOR pathway in dynorphin-A mediated effect in epilepsy, we treated neurons exposed to Mg2+-free with Dyn-A (dynorphin-A, KOR agonist; Sigma-Aldrich; 1 µM, 1 h), Guanidinonaltrindole (GNTI) (KOR antagonist; R&D system; 2 nM, 1 h), or rapamycin (mTOR pathway inhibitor; Sigma-Aldrich; 20 nM, 1 h) alone or in combination.
2.6 Cell viability assay
Cell viability assay was performed using the Cell Counting Kit-8 (CCK-8; Beyotime). Briefly, the primary mouse hippocampal neurons were seeded in the 96-well plates and were exposed to Mg2+-free and/or treated with dynorphin-A, GNTI or rapamycin. After the treatments, CCK-8 reagent (10 μl) was added to each well and incubated at 37°C for 2 h. Optical delnsity values were evaluated at 450 nm using a microplate absorbance reader (Thermo Fisher Scientific). All experiments were repeated three times independently.
2.7 Flow cytometry analysis
To evaluate cell apoptosis in the primary mouse hippocampal neurons, flow cytometry analysis was performed using the FITC-conjugated Annexin V apoptosis detection kit (BD Pharmingen) according to the manufacturer's instructions. After Mg2+-free and/or treated with dynorphin-A, GNTI or rapamycin treatments, the hippocampal neurons were collected, washed, and then suspended in the binding buffer. Annexin V-FITC and PI (Sigma-Aldrich) were then added to the binding buffer and incubated in the dark at room temperature for 15 min. Finally, the apoptosis rate of hippocampal neurons was analyzed by flow cytometry and cell quest software (BD Biosciences). All experiments were repeated three times independently.
2.8 Real-time polymerase chain reaction (RT-PCR) analysis
For tissue RNA extraction, the hippocampal tissues of rats in each group were isolated, ground under liquid nitrogen, and then RNA was extracted. For cell RNA extraction, after the treatments, the hippocampal neurons were collected and then suspended in the PBS. Total RNA was extracted from hippocampus tissue or hippocampal neurons using TRIzol (Invitrogen). Then, RNA was reverse-transcribed to complementary DNA (cDNA) using a Transcriptor First Strand cDNA synthesis kit (Roche). The expression of PYDN was using the SYBR premix (Takara) in the Applied Biosystems 7500 PCR system. The glyceraldehyde-3-phosphate dehydrogenase was used as the internal control for mRNA. The relative expression of genes was analyzed using method. All experiments were repeated three times independently.
The total protein of hippocampus tissue and cells were extracted by radio-immunoprecipitation assay lysis buffer (Sigma Aldrich). Bicinchoninic acid assay protein quantitative Kit (Invitrogen) was used to quantify the total protein concentration. The extracted proteins were separated by 10% sodium dodecyl sulfate-polyacrylamide gel electrophoresis and transferred to the poly vinylidene fluoride (PVDF) membrane. Tris-hcl buffer plus tween-20 buffer containing 5% skim milk was used to block for 1 h at room temperature. Then, the PVDF membranes were incubated with primary antibody overnight at 4°C. The primary antibodies were obtained from Abcam or Santa Cruz Biotechnology, including anti-PYDN (ab11137), anti-p-mTOR (ab109268), anti-mTOR (ab134903), anti-Beclin-1(ab210498), anti-LC3B (ab192890), anti-Caspase-3 (ab39754), anti-Bax (ab182733), and anti-Bcl-2 (ab194583). Then the secondary antibody was incubated at room temperature for 1 h. The β-actin and α-tubulin were used as internal references. Immuno Western chemiluminescence HRP substrate (EMD Millipore) was used to display the protein bands. The protein bands were quantified by ImageJ software.
2.9 Green fluorescent protein-light chain 3 (GFP-LC3) immunofluorescence
The GFP-LC3-expressing plasmid (pEGFP-LC3) was transiently transfected into the stably transfected neuron cells, with the help of Lipofectamine 2000 reagent (Invitrogen). LC3 protein was indicated by the aggregated green fluorescent particles. Fluorescence images were captured and analyzed under a fluorescence microscope (Nikon Corporation). Coverslips were mounted on glass slides, and the GFP-LC3 punctated dots in a total of >3 cells were counted. The number of GFP-labeled autophagosomes was presented as the dots' number in one cells. All experiments were repeated three times independently.
2.10 Statistical analysis
All statistical analyses were conducted using GraphPad Prism 7.0. A statistical comparison of different treatment groups was determined by one-way analysis of variance followed by Tukey's posttest. p < .05 were considered significant.
3 RESULTS
3.1 Overexpression of PDYN alleviated neuronal apoptosis in epileptic rats
Rats were randomly divided into four groups: Control, epileptic model, LV-NC (control LV injection), and LV-PDYN group (PDYN overexpression LV injection). At first, we have detected the PDYN expression in the hippocampus of epileptic rats, before details of LV stereotaxic injections. The baseline levels of PDYN expression before the pilocarpine administration are shown in Supporting Information: Figure 1. The animals were killed on the 7th day after LV injection (1 day before the establishment of epilepsy model). Compared with LV-NC group, the mRNA and protein of PYDN were upregulated 2.4-fold in LV-PDYN group.
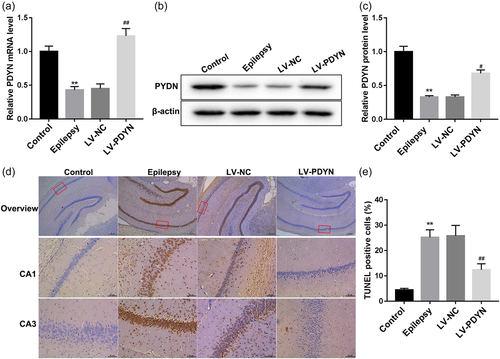
Next, to investigate the role of overexpression PDYN on neuronal apoptosis in epileptic rats, the epilepsy model was induced by pilocarpine injection, and Rats in the LV-NC group and LV-PDYN group received a stereotaxic intrahippocampus injection of LV-NC and LV-PDYN, respectively, before the establishment of the epilepsy model. The PDYN expression in the hippocampus of epileptic rats was detected by quantitative reverse transcription-polymerase chain reaction and western blot. As shown in Figure 1a–c, the PDYN mRNA, and protein expression levels in the hippocampus of epileptic rats were significantly lower than that in the control group. As expected, compared with the LV-NC group, LV-PDYN administration significantly restored the reduction of PDYN expression in the epilepsy model rats. Then, the neuronal apoptosis in epileptic model rats was measured by TUNEL staining. As shown in Figures 1d,e, intrahippocampus injection of LV-PDYN markedly attenuated the pilocarpine-induced hippocampal neuronal apoptosis, which suggested that overexpression of PDYN could alleviate pilocarpine-induced neuronal apoptosis in rats.
3.2 Overexpression of PDYN activated mTOR signaling pathway and inhibited neuronal autophagy in epileptic rats
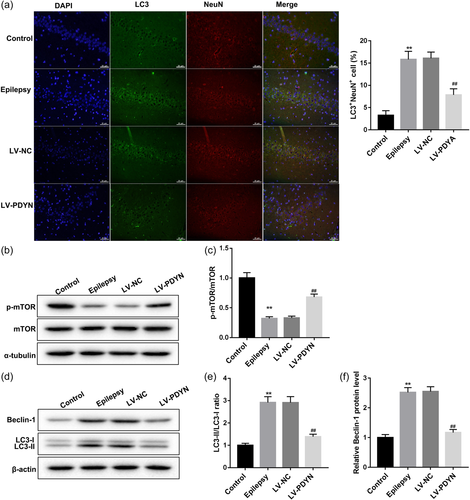
Autophagy is a catabolic pathway in which dysfunctional organelles and cellular components are degraded by lysosomes. During this process, cytoplasmic LC3 translocates to the autophagosome membrane. Therefore, cells undergoing autophagy can be identified by visualizing fluorescent labeled LC3. To visualize the distribution and cellular localization of LC3 in the hippocampus of rats, double-labeling immunofluorescence experiments using an antibody to LC3 (which does not distinguish LC3-I from LC3-II) in combination with NeuN marker were performed. LC3 labeling was localized in most NeuN-positive neuronal cells (red). We observed a marked LC3 immunoreactivity (green) in the epileptic model group, which was decreased by LV-PDYN administration (Figure 2a). Mammalian target of mTOR (a serine/threonine-protein kinase) is a major repressor of autophagy. Here,the p-mTOR and mTOR proteins expression were detected by western blot. As shown in Figures 2b,c, the ratio of p-mTOR/mTOR protein was decreased significantly in the epileptic model group, while LV-PDYN administration restored the reduction of p-mTOR protein, which demonstrated that overexpression of PDYN could activate the mTOR signaling pathway. Subsequently, western blot analysis data revealed that autophagy-related proteins (LC3-II/LC3-I and Beclin-1) were upregulated in epileptic model rats, but reduced by LV-PDYN administration (Figure 2d–f). These data indicated that overexpression of PDYN could activate the mTOR signaling pathway and inhibit neuronal autophagy in acute seizure epileptic rats.
In addition, to assess receptor specificity, the effects of PDYN overexpression have be tested in the presence of pharmacological selective agents. As shown in Supporting Information: Figure 2, we found the significantly decreased KOR in the hippocampus of epileptic rats. Overexpression of PDYN upregulated the expression of KOR, µ-opioid receptor (MOR) and δ-opioid receptor (DOR). According to this result, we can conclude that dynorphin/KOR inhibits neuronal autophagy by activating mTOR signaling pathway to exert antiepileptic effect.
3.3 Dyn-A activation of KOR inhibited Mg2+-free-induced seizure-like neuron apoptosis
To verify the effect of KOR activation on neurons, we first isolated and cultured rat hippocampal neurons. As shown in Supporting Information: Figure 3A, morphology of hippocampal neurons was observed at different cultured time points. Under the inverted microscope, it can be seen that all hippocampal neuronal cells were round at the beginning of implantation, the cell body was transparent, uniform in size, and suspended in the implantation solution. After 24 h of planting, the cells adhered well, the cell body increased, the refraction was good, spindle or irregular, and most of the cells showed short protrusions. 48 h after planting, the cell body was further enlarged, the processes were significantly elongated, the dendrites and axons were clearly visible, and the contact between adjacent cells was formed. Three days after planting, most of the cells had typical neuronal morphology, and the processes further extended and intertwined into a network. On the 7th day, the cell body was full and bright, the connection of processes was closer, and the cells showed a centralized distribution trend. In addition, on the 8th day of hippocampal neuron culture, neuronal MAP-2 was used for cellular immunofluorescence staining. Randomly select five visual fields under the fluorescence microscope, count the positive cells (representing neurons and red fluorescence) and nuclei (representing the total number of cells and blue fluorescence) respectively, and calculate the positive rate, that is, the purity of cultured neurons. Statistical analysis showed that the maximum purity of neurons reached 90%, the minimum was 85%, and the median (representing the average purity of neurons) was 88% on the 8th day. Supporting Information: Figure 3B shows the nuclei and MAP-2 positive cells under the fluorescence microscope. These images suggested that hippocampal neurons in this study have been successfully isolated and have strong cell viability.
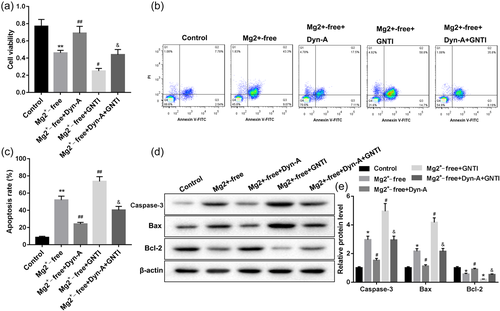
Then the rat neuron cells were randomly divided into five groups: Control, Mg2+-free, Mg2+-free+ Dyn-A, Mg2+-free+GNT1, Mg2+-free+ Dyn-A + GNT1. As shown in Figure 3a, the cell viability decreased significantly in the Mg2+-free group. Dyn-A activation of KOR reversed the decreased cell viability, while GNT1 further inhibited the cell viability in rat neuron cells exposed to Mg2+-free solution. Most notably, GNTI significantly abrogated the Dyn-A-mediated cell viability change in rat neuron cells exposed to Mg2+-free solution. Then, the flow analysis results show remarkably increased cell apoptosis in the Mg2+-free group (Figure 3b,c). Dyn-A reversed the increased cell apoptosis, while GNT1 further enhanced the cell apoptosis in rat neuron cells exposed to Mg2+-free solution. On the contrary to the trend of cell viability, GNTI significantly abrogated the Dyn-A-mediated cell apoptosis change in rat neuron cells exposed to Mg2+-free solution. In addition, the apoptosis-related protein (Caspase-3, Bax and Bcl-2) expression was detected by western blot (Figure 3d,e). In line with the trend of apoptotic cell proportion, apoptotic protein (Caspase-3 and Bax) were increased significantly in the Mg2+-free group, and Dyn-A reversed the increased protein expression, while GNT1 further increased the protein expression in rat neuron cells exposed to Mg2+-free solution. The expression of antiapoptotic protein Bcl-2 was opposite to that of apoptotic protein Caspase-3 and Bax, showing a marked decline in the Mg2+-free group, and Dyn-A reversed the decreased Bcl-2 protein expression, while GNT1 further inhibited the Bcl-2 protein expression. These results indicated that Dyn-A activation of KOR inhibited Mg2+-free-induced seizure-like neuron apoptosis.
3.4 Dyn-A activation of KOR activated mTOR signaling pathway and inhibited seizure-like neuron autophagy
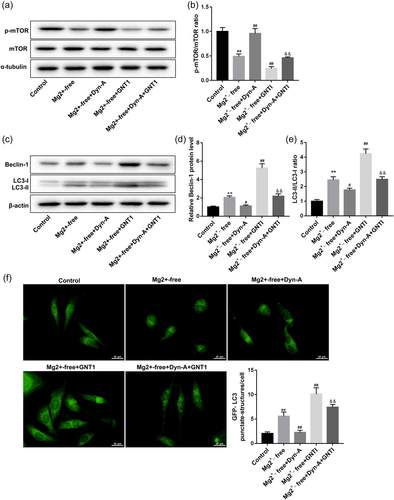
To investigate the effect of Dyn-A activation of KOR on mTOR signaling pathway and seizure-like neuron autophagy in rat neuron cells exposed to Mg2+-free solution, the p-mTOR, mTOR, LC3-I, LC3-II, and Beclin-1proteins expression were detected by Western blot. As shown in Figures 4a,b, the ratio of p-mTOR/mTOR protein significantly decreased in the Mg2+-free group, which was reversed by Dyn-A but further decreased by GNT1. And GNTI significantly abrogated the Dyn-A-mediated change on the ratio of p-mTOR/mTOR protein in rat neuron cells exposed to Mg2+-free solution. Next, the Western blot analysis data showed that the ratio of LC3-II/LC3-I and the Beclin-1 protein expression were remarkably upregulated in the Mg2+-free group, which was reversed by Dyn-A but further increased by GNT1. And GNTI significantly abrogated the Dyn-A-mediated change on the ratio of LC3-II/LC3-I and the expression of Beclin-1 protein in rat neuron cells exposed to Mg2+-free solution (Figure 4c–e). Moreover, we also found that the rat neuron cells following Mg2+-free exhibited stronger GFP-LC3 puncta and increased percentage of GFP-LC3 cells when compared with the control neuron cells. Dyn-A reversed the increased cell autophagy, while GNT1 further enhanced the cell autophagy in rat neuron cells exposed to Mg2+-free solution (Figure 4f). These data indicated that Dyn-A activation of KOR could activate the mTOR signaling pathway and inhibit seizure-like neuron autophagy.
3.5 Dyn-A activation of KOR inhibited Mg2+-free-induced seizure-like neuron autophagy by activating the mTOR signaling pathway
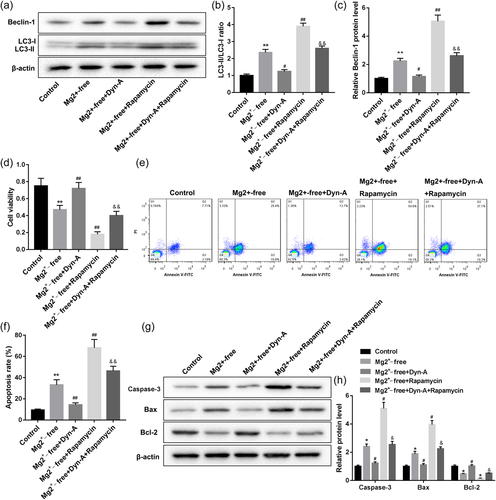
As we have known that Dyn-A activation of KOR could activate the mTOR signaling pathway and inhibit seizure-like neuron autophagy, so does Dyn-A activation of KOR inhibit seizure-like neuron autophagy by activating the mTOR signaling pathway. Here, we used the mTOR inhibitor, Rapamycin to prove that Dyn-A activation of KOR inhibited Mg2+-free-induced seizure-like neuron autophagy by activating the mTOR signaling pathway. As shown in Figure 5a–c, compared with the Mg2+-free group, the ratio of LC3-II/LC3-I and the Beclin-1 protein expression in group A were significantly decreased by Dyn-A but further increased by Rapamycin. And Rapamycin significantly abrogated the Dyn-A activation of KOR-mediated the ratio of LC3-II/LC3-I and the Beclin-1 protein expression change in rat neuron cells exposed to Mg2+-free solution. Accord to autophagy-related proteins changes, Rapamycin also significantly abrogated the Dyn-A activation of KOR-mediated cell viability and apoptosis changes in rat neuron cells exposed to Mg2+-free solution (Figures 5d–h). These data supported our hypothesis that Dyn-A activation of KOR inhibited Mg2+-free-induced seizure-like neuron autophagy by activating the mTOR signaling pathway.
4 DISCUSSION
Epilepsy is one of the most common chronic nervous system diseases affecting patients of all ages, with a worldwide prevalence of 1%−2%. Recurrent seizures can damage normal brain function, lead to neuron loss, leading to cognitive and emotional disorders (Agostinho et al., 2019). Dynorphin represents a family of endogenous opioids that modulate neuronal excitability through activation of KOR, perceived as natural anticonvulsants. During burst stimulation, typical for the onset of seizures, dynorphin is released from neurons and bind to KOR, thereby preventing seizure development (Schwarzer, 2009). Our previous study has shown that PDYN overexpression alleviated pilocarpine-induced neuronal apoptosis in rats, which was been proved again in this study. In addition, here, we also found that overexpression of PDYN could activate the mTOR signaling pathway and inhibit neuronal autophagy in acute seizure epileptic rats. Meanwhile, the in vitro experiment also showed that dynorphin activation of the KOR activated the mTOR signaling pathway and inhibited seizure-like neuron autophagy.
The mTOR signaling pathway is now known to be important for integrating cellular signaling in the central nervous system. Studies have demonstrated that the mTOR signaling pathway may be involved in mediating aversion caused by KOR agonizts (J. J. Liu et al., 2018, 2019), and KOR activation can activate the mTOR signaling pathway (Dunn et al., 2019). Also, KOR-specific agonizts can inhibit autophagy through the AMPK-mTOR Pathway (Zhou et al., 2017). In this study, we observed that dynorphin activation of KOR activated the mTOR signaling pathway, inhibition of KOR by GNTI suppressed the mTOR signaling pathway, which was in agreement with the reported results. Autophagy has been shown to play a potential role in epilepsy-induced neuronal loss in the developing brain (Li et al., 2018; Yang et al., 2020). In our study, we also demonstrated that activation of autophagy is involved in the development of epilepsy, which was agreed with that reported in the literature.
Moreover, studies have pointed out that some autophagy mechanisms (such as mammalian targets of rapamycin pathway) are related to epilepsy (Giorgi et al., 2015; Limanaqi et al., 2020), and autophagy constitutes an important part of mTOR signaling. Although the effect of dynorphin activating KOR on autophagy has not been reported, we know that the mTOR signaling pathway plays a negative role in autophagy. Nesxt, using Rapamycin, our results showed that Rapamycin significantly abrogated the dynorphin-mediated cell viability, apoptosis, and the autophagy-related protein expression change in rat neuron cells exposed to Mg2+-free solution, indicating that dynorphin activating KOR inhibited Mg2+-free-induced seizure-like neuron autophagy by activating the mTOR signaling pathway.
It is well known that dynorphins have a high degree of promiscuity for the opioid receptor and activity on other non-opioid targets is highly discussed (e.g., NMDA receptors). Overexpression of the dynorphins precursor (PDYN) would lead to synthesis of multiple neuropeptides (DynA, DynB, alpha-neoendorphin, Leu-enkephalin, etc.) with different affinities, potencies and efficacies for the three canonical opioid receptors. In this study, we found the significantly decreased KOR in the hippocampus of epileptic rats, and overexpression of PDYN upregulated the expression of KOR, MOR and DOR, which indicated that dynorphin/KOR inhibits neuronal autophagy by activating mTOR signaling pathway to exert antiepileptic effect.
In conclusion, our results demonstrated that dynorphin activation of KOR has a protective effect on epilepsy and epilepsy-induced brain injury, which is associated with mTOR signaling pathway activation and inhibition of autophagy, and thus reduce apoptosis of neurons. Our findings provide new insight into the underlying mechanism of dynorphin-mediated protection in acute seizure epilepsy.
ACKNOWLEDGMENT
This study was supported by the Natural Scientific Foundation of Hunan Province (2018JJ2611), and the project of science and technology foundation of Changsha city (kq2004148 and kq2004144).
CONFLICT OF INTEREST
The authors declare no conflict of interest.
Open Research
DATA AVAILABILITY STATEMENT
The data that support the findings of this study are available from the corresponding author upon reasonable request.


