TGF-β acts as a dual regulator of COX-2/PGE2 tumor promotion depending of its cross-interaction with H-Ras and Wnt/β-catenin pathways in colorectal cancer cells
Abstract
Transforming growth factor-β (TGF-β) plays a dual role acting as tumor promoter or suppressor. Along with cyclooxygenase-2 (COX-2) and oncogenic Ras, this multifunctional cytokine is deregulated in colorectal cancer. Despite their individual abilities to promote tumor growth and invasion, the mechanisms of cross regulation between these pathways is still unclear. Here, we investigate the effects of TGF-β, Ras oncogene and COX-2 in the colorectal cancer context. We used colon adenocarcinoma cell line HT-29 and Ras-transformed IEC-6 cells, both treated with prostaglandin E2 (PGE2), TGF-β or a combined treatment with these agents. We demonstrated that PGE2 alters the subcellular localization of E-cadherin and β-catenin and enhanced the tumorigenic potential in HT-29 cells. This effect was inhibited by TGF-β, indicating a tumor suppressor role. Conversely, in Ras-transformed IEC-6 cells, TGF-β induced COX-2 expression and increased invasiveness, acting as a tumor promoter. In IEC-6 Ras-transformed cells, TGF-β increased nuclear β-catenin and Wnt/β-catenin activation, opposite to what was seen in the PGE2 and TGF-β joint treatment in HT-29 cells. Together, our findings show that TGF-β increases COX-2 levels and induces invasiveness cooperating with Ras in a Wnt/β-catenin activation-dependent manner. This shows TGF-β dual regulation over COX-2/PGE2 tumor promotion depending on the H-Ras and Wnt/β-catenin pathways activation status in intestinal cancer cells.
Abbreviations
-
- APC
-
- Adenomatous Polyposis Coli
-
- CDK-4
-
- cyclin-dependent kinase 4
-
- COX-2
-
- cyclooxygenase-2
-
- CRC
-
- colorectal cancer
-
- EMT
-
- epithelial–mesenchymal transition
-
- ERK
-
- extracellular signal-regulated kinase
-
- JNK
-
- c-Jun NH2-terminal kinase
-
- NF-κB
-
- nuclear factor-κB
-
- p38MAPK
-
- p38 mitogen-activated protein kinase
-
- PGE2
-
- prostaglandin E2
-
- PI3K
-
- phosphinositide 3-kinase
-
- ROS
-
- reactive oxygen species
-
- Smad
-
- mothers against decapentaplegic homolog.
1 INTRODUCTION
Colorectal cancer (CRC) is one of the most widespread human malignant tumors. It ranks third overall in incidence and second in mortality worldwide (Bray et al., 2018). Its development is built up on the accumulation of genetic and epigenetic alterations. Mutations in genes like APC, K-Ras and TP53 are deemed necessary for the tumors to form (Nguyen & Duong, 2018). Adenomatous Polyposis Coli (APC) loss of function mutations induce Wnt signaling activation. This occurs by an increase of cytoplasmic β-catenin levels that will translocate into the nucleus and promote transcription of CRC-related oncogenes (Clevers & Nusse, 2012). Ras pathways have also been shown to play a central role in tumor development (Nandan & Yang, 2011; Rimbert et al., 2018). But apart from the classical mutated genes in CRC progression, recent studies show that cyclooxygenase-2 (COX-2) plays a key part in colorectal carcinogenesis (Y. Liu et al., 2017). Its mechanism though, is still not completely understood.
Among growth factors, transforming growth factor-β (TGF-β) is a multifunctional cytokine that inhibits the proliferation of most cell types and regulates diverse biological processes, such as cell migration, differentiation, and extracellular matrix production (Soleimani et al., 2018). Crucial to a plethora of cellular behaviors, it's no surprise that aberrations in the TGF-β pathway impact tumor development. Genetic and epigenetic events regulate the delicate balance of TGF-β acting as a suppressor or a tumor promoter (Saitoh, 2015). In addition to stimulating canonical Smad 2/3 signaling, TGF-β activates other noncanonical effectors (e.g., extracellular signal-regulated kinase 1/2 [ERK1/2], p38 mitogen-activated protein kinase [p38MAPK], and phosphinositide 3-kinase [PI3K]/AKT, RhoA, and nuclear factor-κB [NF-κB]) that contribute to the complexity of its stimulation response. These alternate activation routes contribute to neoplasm formation (Zhang, 2017).
Prostaglandins, bioactive lipid molecules, are the final products of the action of cyclooxygenases (COX) on arachidonic acid. Prostaglandin H2 (PGH2) is the initial metabolite produced by both enzymes, COX-1 and 2, which is then converted to the final product through the action of specific synthases. One of these synthases, PGE synthase (PGES), catalyzes the conversion of PGH2 to PGE2 (Castellone et al., 2005). It is known that nonsteroidal anti-inflammatory drugs (NSAIDs), which inhibit COX-1 and COX-2, reduce the number and size of adenomas in patients with familial adenomatous polyposis and prevent colon cancer development in Apcmin mice (Torrance et al., 2000). Indeed, clinical and experimental data supports a potent antitumorigenic efficacy of NSAIDs in colon cancer (Brown & DuBois, 2005) and involves the participation of COX-2 and one of its metabolites, PGE2, in colon cancer development (Sonoshita et al., 2001).
The accumulation of mutations is quite evident in CRC tumor samples. Mutated forms of Ras proto-oncogene can be found in almost 50% of CRC cases (Nandan & Yang, 2011). COX-2 is overexpressed in 85–90% of tumors and TGF-β is also abnormally expressed in the majority (90%) of those (S. H. Kim et al., 2018; Luo et al., 2019). Based on the literature, we hypothesize an interconnected pathway where TGF-β collaborates with oncogenic Ras for COX-2 induced PGE2 production. This signaling network would promote tumor progression through a more invasive phenotype in CRC cells.
This study was designed to further analyze the role that TGF-β and PGE2 play during CRC progression and how their pathways interact. We observed that in HT-29 cells, a colon adenocarcinoma cell line, PGE2 treatment altered subcellular localization of E-cadherin and β-catenin. There was also an increase in proliferation, migration and invasiveness. These effects, however, were hindered by the presence of TGF-β. In cells with active H-Ras and consequently high COX-2 expression, TGF-β induced cell invasiveness through Wnt/β-catenin pathway activation.
2 MATERIALS AND METHODS
2.1 Antibodies and chemicals
The following antibodies were used: mouse anti-β-catenin monoclonal antibody (15B8, #C7207), mouse anti-E-cadherin monoclonal antibody (36, #610181; BD Biosciences); rabbit anti-COX-2 monoclonal antibody (D5H5, #12282; Cell Signaling Technology); and mouse anti-GAPDH monoclonal antibody (6C5, #AM4300; Thermo Fisher Scientific). The secondary antibodies goat anti-rabbit (#NA934) and anti-mouse (#NA931) IgG horseradish peroxidase-conjugated were obtained from GE Healthcare. Alexa 488-conjugated goat anti-rabbit IgG and Alexa 546-conjugated goat anti-mouse IgG were purchased from Molecular Probes. Transforming growth factor-β (TGF-β; #PHG9204)) was purchased from Life Technologies and diluted in phosphate-buffered saline (PBS) + 0.1% bovine serum albumin (BSA) to obtain a stock concentration of 10 µM. Prostaglandin E2 (#14520) was purchased from Cayman Chemical, and diluted in dimethyl sulfoxide (DMSO) to obtain a stock concentration of 100 mM.
2.2 Cell culture and treatments
HT-29 human colon adenocarcinoma cell lines (ATCC; #HTB-38) obtained from American Type Culture Collection were passaged weekly using a solution of 0.05% trypsin/0.02% EDTA in PBS solution. HT-29 cells are moderately differentiated, with PIK3CA, TP53, SMAD4, and APC mutations (Bastos et al., 2014). IEC-6 (ATCC; #CRL-1592) cells had growth medium supplemented with 0.1 unit of insulin. All cells were grown in Dulbecco's modified Eagle's medium (DMEM) supplemented with 10% fetal bovine serum (FBS), penicillin G (60 mg/L), and streptomycin (100 mg/L) at 37°C in a humidified atmosphere of 5% CO2/air. Cell cultures were switched to serum-free medium for 24 h before PGE2 (10 nM) and TGF-β (5 ng/ml) treatment. IEC-6 pBabe and IEC-6 H-RasV12 cells were also used in the present study and obtained as previously reported by Accioly et al. (2008).
2.3 Cell extraction and Western blot analysis
Total cell lysates were obtained by incubating the cells in lysis buffer (150 mM NaCl, 10 mM Hepes, pH 7.3, 0.2% sodium dodecyl sulfate, 1% TX-100, 0.5% deoxycholate, and 2 mM EDTA) containing 2 mM orthovanadate, 20 mM NaF, and protease inhibitor cocktail (1:100; Sigma-Aldrich). Cells were then scratched from the plates, homogenized, and centrifuged at 11,000g for 10 min at 4°C. The supernatant was collected and stored at –20°C.
For Western blot analysis, equal amounts of protein (30 μg/lane of cell lysate) were electrophoretically separated by sodium dodecyl sulfate-polyacrylamide gel electrophoresis on 10% or 12% polyacrylamide gel. Protein was then transferred to nitrocellulose membranes using a semidry transfer cell. After transfer onto nitrocellulose membranes, nonspecific binding sites were blocked with 5% nonfat milk in TBS-Tween (TBST; 50 mmol/L Tris–HCl [pH 7.4], 150 mmol/L NaCl, 0.05% Tween 20). Membranes were probed overnight in primary antibodies against COX-2 (1:1000), and GAPDH (1:10,000) in TBS-T. Proteins of interest were then identified by incubating the membrane with horseradish peroxidase–conjugated secondary antibodies in TBST. Membranes were developed with an enhanced chemiluminescence reagent (Amersham Biosciences), and luminescence was visualized by the ChemiDoc MP Imaging System from Bio-Rad.
2.4 Immunofluorescence
To analyze the subcellular localization of proteins, cell monolayers were grown on sterile glass coverslips and then manually wounded by scraping with a pipet specifically to analyze the front of the monolayer. After treatment, cells were washed in PBS and fixed in 4% paraformaldehyde for 10 min and permeabilized/blocked with 0.1% Triton X-100 3% BSA in PBS for 2 h. Coverslips were incubated overnight at 4°C in primary antibodies against E-cadherin (1:500) and β-catenin (1:200), followed by 1 h in the respective Alexa 488-conjugated secondary antibodies (1:500). Afterward, the coverslips were incubated with 4′,6-diamidino-2-phenylindole (DAPI; 1:1000) for 1 min, washed, and mounted using Prolong Gold antifade reagent (Invitrogen). Cell staining was detected using a Fluoview FV10i (Olympus Co.) laser scanning confocal microscope with a 543 nm excitation laser. Individual images were collected of regions whereof the monolayers were scrapped. The images shown are representative of at least three independent experiments.
2.5 Cell proliferation assay
HT-29 cells (2 × 10⁴ cells/ml) were cultured in 96-well plates and treated with PGE2 (10 nM) and TGF-β (5 ng/ml) for 24 or 48 h. After this time, they were fixed with ethanol for 10 min and incubated with a crystal violet solution (0.05% crystal violet and 20% ethanol) for an additional 10 min. Wells were washed twice with water and then solubilized with 100% methanol. The absorbance at 595 nm was measured with a Spectra Max 190 spectrophotometer (Molecular Devices).
2.6 Anchorage-dependent and independent colony formation assays
Anchorage-dependent and anchorage-independent colonies constitute an important parameter for measuring tumorigenic potential in vitro. First, for anchorage-dependent colony formation assays, HT-29 cells were seeded at low density (500 cells/well) in 12-well plates. Cells were monitored for 10 days to check the ability of a single cell to form a colony. Treatment with PGE2 (10 nM) and TGF-β (5 ng/ml) was continuous over 10 days. At the end of the experiment, cells were fixed with 100% ethanol for 10 min and subsequently incubated with a solution containing 0.05% crystal violet and 20% ethanol for 10 min. Then, wells were washed with distilled water and the crystal violet eluted with 100% methanol. The absorbance at 595 nm was quantified using a SpectraMax 190 spectrophotometer (Molecular Devices). Second, for anchorage-independent colony formation assays, the cells (500 cells/well) were seeded into a 12-well plate previously coated with 1 ml of a semi-solid medium containing 0.3% agarose. After 10 days of treatment, cell colonies were observed and counted with an Axio Observer Z1 microscope (Carl Zeiss, Inc.).
2.7 Migration assay
Cell migration is an important parameter to evaluate the tumorigenic potential of cancer cells. To do that, HT-29 cells were seeded into a six-well plate and allowed to grow until they reached confluency. Cellular monolayers were then manually wounded by scraping with a pipette tip to carry out the wound healing assay. Wells were washed with PBS and incubated in complete growth medium in the absence or presence of PGE2 and TGF-β for 12 and 24 h. For each well, five sites of a unique regular wound were analyzed under an Axio Observer Z1 microscope equipped with an Axio Cam HRc and Axio Vision Release 8.2 Image Analyzer. The sites were then selected and marked. After treatment, cells were allowed to migrate into the clearing area for 24 h. Immediately after wounding (0 h) and at the end of the experiment (24 h), the entire wound of the five previously selected sites of each scrap/well were photographed.
The lesion area was manually quantified using ImageJ software version 1.51r (http://imagej.nih.gov/ij). Values were represented by the percentages of cell migration in bar graphs, and the data are presented as the means ± SEM of triplicate assays for each cell line. At least three independent experiments were performed.
2.8 Luciferase assay for TCF activity
Top-flash luciferase reporter assay is fundamental to analyze activation of the Wnt/β-catenin pathway. Cells were seeded in 24-well plates and transiently transfected with 2 μg SUPER-8 Top-flash reporter plasmid and 3 μl FUGENE HD Transfection Reagent (Roche Applied Science). For transfection efficiency control, 0.2 μg of a Renilla luciferase construct (pRL-Tk) was included in each transfection. Twenty-four hours after transfection, the cells were washed twice with PBS and then treated with 5 ng/ml TGF-β, 10 nM PGE2, or 10 mM LiCl as a positive control. After 24 h, cells were harvested, and the extracts were prepared with 50 µl reporter lysis buffer (Promega). Renilla and luciferase activity were assayed according to the manufacturer's protocol with a Kit Dual-Luciferase Reporter Assay System (Promega). The luciferase activity in each well was normalized to the Renilla activity.
2.9 In vitro invasion assay
To analyze cell invasion, HT-29, IEC-6 pBabe, and IEC-6 H-RasV12 cells (3 × 10⁴) were seeded in the upper surface of an 8 μm pore size Polycaronate Membrane Transwell® insert (Corning Costar). This was previously coated with 20 µl Matrigel® (BD Biosciences) diluted 1:10 in DMEM. Cells were seeded in 200 µl of serum-free medium and incubated at 37°C for 30 min. DMEM with 20% FBS was added as a chemoattractant in the lower chamber. After 24 h of incubation, the upper surface of the membrane was scrubbed with a cotton swab. Invasive cells in the lower membrane were fixed with ethanol for 10 min, stained with 0.05% crystal violet, and analyzed under the Axio Observer Z1 microscope (Carl Zeiss, Inc.). The number of invaded cells was expressed as the average of five random fields under the microscope. The cell invasion values are represented as fold increases of cell invasion via bar graphs, and data are presented as the mean ± SEM of triplicate assays of three independent experiments.
2.10 Statistical analysis
Statistical analysis was performed using GraphPad Prism 5.0 (GraphPad Software). Data from at least three independent experiments are expressed as mean ± SEM and were interpreted using one-way analysis of variance (ANOVA) followed by the Bonferroni or Dunnet's posttest where relevant. All comparisons were determined using a one-way ANOVA between the experimental group and the control group. Differences were considered statistically significant when *p < .05; **p < .01 and ***p <.001.
3 RESULTS
3.1 Combination of TGF-β plus PGE2 treatment hinders the increased cell migration and invasion induced by PGE2 alone
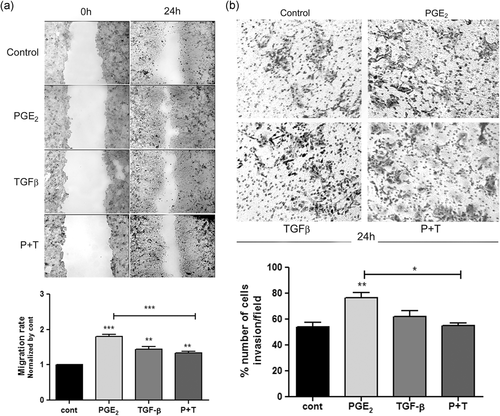
Initially, to elucidate the role that PGE2 and TGF-β play on the aggressive features of HT-29 cells, we investigated the cell migration at 12 and 24 h and the invasive potential of these cells after 24 h of treatment with PGE2, TGF-β, or a combination of these compounds. We observed that after 24 h, all treatments caused a significant increase of wound healing, specially in the treatment with PGE2 alone. Interestingly, combined treatment with these compounds induced cellular migration, but it inhibited the effect caused by treatment with TGF-β alone (Figure 1a). Additionally, we observed that in shortened time points (12 h), when the impact on cell proliferation could be less pronounced the treatments did not alter cell migration (Figure S1). Furthermore, we found that only PGE2 alone significantly increased invasiveness compared to untreated cells after 24 h of treatment. Even though, TGF-β alone had no significant effect on cell invasion, the association of it with PGE2 hindered its sole effect in invasion (Figure 1b).
3.2 Joint treatment of TGF-β and PGE2 prevents increase in colony formation and proliferation induced by PGE2 alone
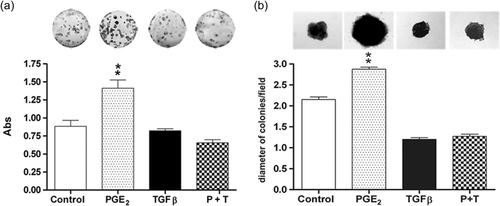
Tumor cells can form anchorage-dependent and anchorage-independent colonies, which constitutes an important parameter for measuring tumorigenic potential in vitro. Therefore, we evaluated the effects of PGE2 and TGF-β on the clonogenic properties of HT-29 cells. Figure 2a shows that HT-29 cells exposed to PGE2 had significantly increased numbers of anchorage-dependent colonies when compared to the control group. TGF-β treatment did not induce changes, but when PGE2 and TGF-β were applied in combination, the increased number of colonies caused by PGE2 was completely inhibited. Additionally, we assessed the effects of PGE2 and TGF-β treatment on anchorage-independent growth using a soft agar colony formation assay. Our results show that PGE2 significantly increased colony size, while TGF-β alone and TGF-β in combination with PGE2 impaired this increase (Figure 2b).
We then decided to verify whether these treatments alter cellular viability over time using the crystal violet assay. We observed after 24 h of PGE2 and TGF-β treatment, an increase in cell viability indicating that HT-29 cells had significantly increased cell growth. However, after 48 h, only PGE2 showed this effect. PGE2 and TGF-β joint treatment reduced cell viability after 48 h of treatment, but not at 24 h (Figure 3).

3.3 TGF-β increases COX-2 protein levels and invasiveness in a H-Ras dependent fashion
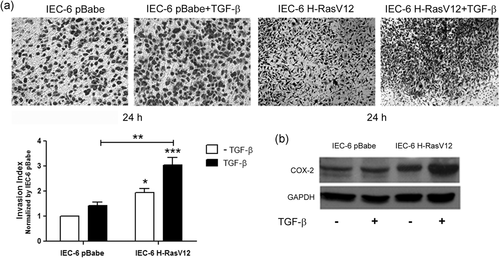
Our results showed that HT-29 cells treated with PGE2 had increased growth, migration, and invasion, but that the combination with TGF-β inhibited these effects. This might indicate that TGF-β works as a tumor suppressor in the presence of PGE2. There is evidence that for TGF-β to induce invasion and tumoral progression, Ras signaling must be active (Liu et al., 2018). Thus, to evaluate the contribution of the Ras oncogene to TGF-β-associated tumor promotion, we used rat intestinal cells (IEC-6) transfected with H-Ras oncogene (IEC-6 H-RasV12). This cellular model was previously established and characterized by increased COX-2 expression and therefore, increased PGE2 production and release in the culture medium (Accioly et al., 2008). Matrigel-coated transwell invasion assay showed that TGF-β treatment alone did not cause a significant increase in invasion in IEC-6 pBabe. However, when associated with IEC-6 H-RasV12 cells, that are already more invasive, TGF-β lead to more invasion (Figure 4a). Next, we used Western blot analysis to confirm whether TGF-β treatment-induced changes in COX-2 expression in IEC-6 pBabe and IEC-6 H-RasV12 cells. Figure 4b shows that, in the presence of TGF-β, IEC-6 H-RasV12 cells have higher COX-2 protein levels. These results suggest that H-Ras is necessary for TGF-β to enhance the invasive potential and when combined, both lead to COX-2 upregulation.
3.4 TGF-β and oncogenic H-Ras induce Wnt/β-catenin pathway activation
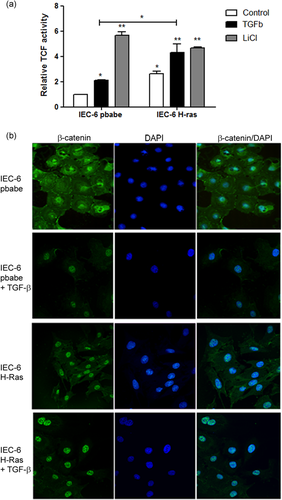
Previous studies have demonstrated that H-Ras and TGF-β can increase COX-2 expression in human CRC cell lines (Du et al., 2005; Roman et al., 2002). However, the mechanisms through which this occurs remain unclear. It is known that COX-2 is a transcriptional target of Wnt/β-catenin signaling (Araki et al., 2003). Therefore, Wnt/β-catenin activation could be the regulator of COX-2 expression in our model. To test this hypothesis, we investigated Wnt/β-catenin activation in IEC-6 pBabe and IEC-6 H-RasV12 cells, with or without TGF-β treatment. This was done using a Top-flash luciferase reporter assay. Our results show that IEC-6 H-RasV12 cells have higher luciferase activity (Top activation) when compared to IEC-6 pBabe and that after 24 h, TGF-β treatment significantly increased luciferase activation of IEC-6 pBabe and IEC-6 H-RasV12 cells compared to the respective control groups. In this experiment, lithium treatment was used as a positive control of TCF activation (Figure 5a). Wnt/β-catenin pathway activation is characterized by the translocation of β-catenin into the nucleus before TCF activation. This has been implicated in tumorigenesis and increased cell invasion (Haase et al., 2016). For this reason, we analyzed β-catenin localization in response to TGF-β via immunofluorescence assay of IEC-6 pBabe and IEC-6 H-RasV12 cells. As shown in Figure 6b, β-catenin was observed at cell-cell contact points and in the cytoplasm of IEC-6 pBabe cells. When treated with TGF-β for 24 h, we observed the translocation of β-catenin from the membrane to the nucleus. H-Ras oncogene expression alone was enough to determine β-catenin localization in the nucleus. Associated with TGF-β, IEC-6 H-RasV12 treated cells displayed intense β-catenin staining in the nucleus (Figure 5b). These findings support the notion that the H-Ras oncogene and TGF-β could increase COX-2 expression via Wnt/β-catenin signaling.
3.5 Independent treatment of HT-29 cells with PGE2 and TGF-β causes subcellular E-cadherin and β-catenin redistribution, but not when combined
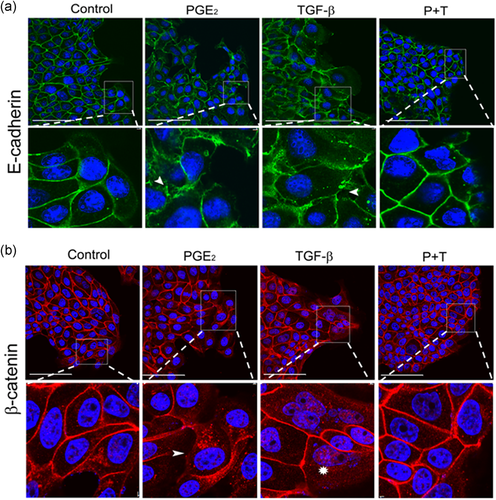
The loss of cell-cell contacts is a feature that potentially causes tumor cells to migrate and invade tissues (Zhou et al., 2017). Thus, we raised the question whether the subcellular localization of E-cadherin and β-catenin would be affected after treatments with PGE2, TGF-β, or their combination. To address this question, we used immunofluorescence to analyze the subcellular redistribution of E-cadherin and β-catenin, specifically in the front of the monolayer, focusing on cells that may migrate after these treatments. As shown in Figure 6a,b, we observed that 24 h after PGE2 and TGF-β treatment, E-cadherin and β-catenin lost their predominant membrane staining and showed a more diffuse pattern with some punctate in the cytoplasm. This indicates a disorganization of cellular contacts when compared to the control group. Cells in the combined treatment showed majority labeling of both proteins at the cell-cell contact points, similar to the control group. Considerable β-catenin labeling was detected at the nucleus after TGF-β treatment, unlike cells that received the combined treatment. Taken together, these data indicate that PGE2 and TGF-β both individually promote the loss of cell-cell contacts. Interestingly, the presence of both agents seems to hinder their individual effects. As PGE2 treatment triggers cell-cell disorganization, as observed by redistribution of E-Cadherin and β-catenin, and this can be a clue of epithelial–mesenchymal transition (EMT), we need to analyze by reverse-transcription polymerase chain reaction the mRNA levels of E-cadherin, a classic EMT marker. Our result showed that the treatments with PGE2 and TGF-β did not alter the RNA levels of this proteins, but the treatment combined increased these levels (Figure S2).
3.6 Wnt/β-catenin signaling activation is a differential regulator of cell invasiveness in the presence of TGF-β
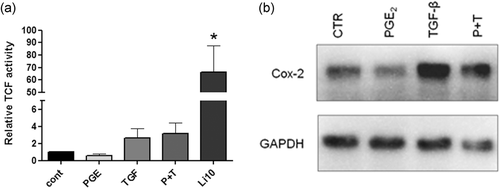
Our prior results using HT-29 cells showed that PGE2 treatment induced disorganization of the cellular contacts through E-cadherin and β-catenin relocalization, increased migration, proliferation, colony formation, and invasiveness. However, when cells were treated with PGE2 and TGF-β in combination, these effects were absent. Conversely, in IEC-6 H-RasV12 cells, which showed increased COX-2 expression and Wnt/β-catenin activation, TGF-β treatment increased invasiveness. We, therefore, decided to analyze whether COX-2 expression and Wnt/β-catenin signaling activation occurs in HT-29 cells treated with PGE2 and TGF-β. As shown in Figure 7a, PGE2, TGF-β, and PGE2 in combination with TGF-β treatments did not induce significant β-catenin transcriptional activity in comparison with the control group. In this assay, lithium chloride (10 mM) was used as positive control. To further confirm this result, we stimulated HT-29 cells with the same treatments for 24 h. Interestingly only TGF-β increased COX-2 protein levels. PGE2 left COX-2 levels unaltered and so did the treatment with PGE2 in combination with TGF-β (Figure 7b). These results confirm that Wnt/β-catenin pathway activation did not occur when HT-29 cells are stimulated with PGE2, suggesting that this is the differential regulator of cell invasiveness. It was interesting to see the suppressive effect of TGF-β on increased invasiveness caused by PGE2, and we decided to verify what mechanism will be underlying this event. It is widely known that invasion is associated with the dynamic and regulation of actin cytoskeleton, and that non-Smad signaling of TGF-β induces changes in actin dynamics via rapid activation of RhoA GTPase (Souza-Squiavinato et al., 2019). Therefore, we analyzed the activity of this protein by using a specific G-LISATM RhoA Activation Assay Biochem KitTM, which showed that RhoA activity was increased in cells exposed to early time to PGE2 and to TGF-β at 15 min. However, in the combined treatment with these two compounds, the RhoA activity was abolished (Figure S3).
4 DISCUSSION
In this study we showed that in HT-29 cells, a colon adenocarcinoma cell line, PGE2 treatment resulted in altered subcellular localization of E-cadherin and β-catenin, increased cell proliferation, colony formation, migration, and invasiveness. We have also determined that this effect was extinguished in the presence of TGF-β. In a distinct intestinal cell line (IEC-6) with active H-Ras and consequently high COX-2 expression, TGF-β induced cellular invasion through a mechanism involving Wnt/β-catenin pathway activation.
TGF-β is a cytokine produced by inflammatory and noninflammatory cells and acts as a tumor suppressor in the early stages of tumorigenesis. However, it can also promote invasiveness and metastasis in advanced stages of tumor progression (Pardali & Moustakas, 2007). In CRC, the suppressive role of TGF-β remains to be determined and can depend on the interaction of distinct signaling pathways. TGF-β classically leads cells to the EMT, a cellular program characterized by loss of E-cadherin, cellular junctions, increased migration and invasiveness (Rocha et al., 2018; Sousa-Squiavinato et al., 2019). On the other hand, COX-2 and prostaglandins can promote cell growth and survival (Y. Liu et al., 2017), being overexpressed during the inflammatory process (Troncone et al., 2018). However, the interactions between PGE2 and TGF-β that are involved in inducing events related with cancer progression have not been elucidated. Our results demonstrate that PGE2 could acts as an inducer of EMT-related events, such as redistribution, but not downregulation of E-cadherin, partial nuclear translocation of β-catenin to the nucleus, and increased proliferation and migration. The equivalent RNA levels for CDH1 in treated cells in our study are not completely unexpected. Although E-cadherin loss is an established feature of EMT, it is now known that this step is not essential for cell migration. Evidence shows that most metastatic carcinomas migrate collectively (Friedl et al., 2012) and in some cases E-cadherin presence can be even more tumorigenic (Padmanaban et al., 2019). In addition, these results are in agreement with previous studies involving lung cancer cells, which demonstrated that PGE2 induces EMT in a COX/PGE2 pathway-dependent manner and enhanced β-catenin translocation from the cytoplasm to the nucleus (Che et al., 2017). Furthermore, EMT induction by PGE2 occurs via EP4 and EP2 receptors, which influence the activity of Snail or Twist, which are strong transcriptional repressors of E-cadherin, as seen in human bronchial epithelial cells (Li et al., 2015).
The mechanism by which TGF-β acts as a tumor suppressor is still undefined. There has been evidence that TGF-β inhibits cell proliferation and tumor growth through Smad-dependent signaling activation (canonical TGF-β pathway), which depends on the translocation of Smad-2/3 to the nucleus to induce antitumoral effects (Luo et al., 2019). This pathway could pose as a hotspot for interaction with Ras signaling considering that its activation may inhibit the suppressive effects of Smad signaling (Matsuzaki et al., 2009). Smad is regulated through phosphorylation mediated by oncogenic kinases such as Ras-associated kinases, extracellular signal-regulated kinase (ERK), c-Jun NH2-terminal kinase (JNK), and cyclin-dependent kinase 4 (CDK-4). Taking this into consideration, the tumor-suppressive effects mediated by Smad can be affected by the activity of these kinases (Grusch et al., 2010; Mori et al., 2004). Hence, TGF-β action as a tumor promoter depends on the activation of a different set of signaling pathways. There is evidence that COX/PGE2 activation by EP receptors inhibits the tumor-suppressive effects induced by Smad (Neil et al., 2008). This cross-interaction allows TGF-β to induce EMT through noncanonical signaling. Therefore, it is possible that the activation of Smad by TGF-β treatment could inhibit the initial steps of EMT, interfering with PGE2 activation of downstream pathways that lead to this pro-invasive phenotype. Alternatively, our RhoA GTPase activity assay indicated that TGF-β inhibits PGE2-induced RhoA activation. Thus, it is possible to speculate that RhoA activity occurs downstream of PGE2 and that TGF-β inhibition of RhoA activity impairs the pro-invasive effect of PGE2 through a yet unknown mechanism. More specifics on this hypothesis, however, will be explored in the future.
As above discussed, studies suggest that TGF-β requires the activity of other signaling pathways, such as Ras, to induce protumorigenic effects. Thus, we used IEC-6 cells with a constitutively active Ras construct and demonstrated that TGF-β increased the invasive potential confirming a protumorigenic role. This finding is corroborated by a study using mammary epithelial MCF-10A cells that overexpress H-Ras. In these cells, invasiveness was increased by TGF-β treatment (H. Kim et al., 2014). Accioly et al. (2008) showed that oncogenic Ras-mediated IEC-6 cell transformation, COX-2 overexpression, and enhanced PGE2 production. We described that these IEC-6 H-RasV12 cells, when treated with TGF-β, enhanced COX-2 protein levels. Findings of increased COX-2 protein amounts in human CRC cell lines stimulated by oncogenic Ras or TGF-β treatment further support our findings (Sheng et al., 2000). However, the mechanism underlying COX-2 expression in this context remains unclear.
Being a transcriptional target of Wnt/β-catenin signaling, COX-2 upregulation could be explained by the presence of nuclear β-catenin (Haertel-Wiesmann et al., 2000). To assess this hypothesis in our study, we measured the transcriptional activity of nuclear β-catenin using a luciferase assay in control or TGF-β-treated IEC-6 H-RasV12 cells. We observed that TGF-β further increased luciferase activity, clearly showing that Ras and TGF-β cooperate to induce Wnt/β-catenin signaling. Through immunofluorescence assays, we confirmed that TGF-β induces nuclear accumulation of β-catenin in these cells. This is consistent with the observation that oncogenic KRAS/BRAF/MEK signaling in IEC-6 cells activates the Wnt/β-catenin pathway through LRP6 receptor phosphorylation leading to β-catenin/TCF4 activity and promoting cell migration and invasion (Lemieux et al., 2015). Together, these findings suggest that the TGF-β signaling pathway and oncogenic Ras cooperate to induce Wnt/β-catenin signaling. This would subsequently increase COX-2 expression and produce more PGE2, thus stimulating cell invasion.
Finally, as we do not observe increased invasiveness in HT-29 cells treated with TGF-β plus PGE2 (Figure 4b) despite disorganization of cell-cell contacts, we decided to evaluate if the increased invasion in IEC-6 H-RasV12 cells caused by TGF-β depends on its association with Wnt/β-catenin activation. When assessing β-catenin activity in the nucleus of HT-29 cells, we observed that TGF-β and PGE2 together did not induce TCF/LEF activation, even though TGF-β increased COX-2 levels (Figure 7). Indeed, Wnt-induced transcriptional activation is exclusively mediated by TCF/LEF, which is necessary for inducing cell invasion (Schuijers et al., 2014). Therefore, we speculate that exogenous TGF-β can cooperate with active Ras to increase COX-2 levels and upregulates PGE2 synthesis. This intricate regulation network would explain why HT-29 cells and IEC-6 H-RasV12 behaved in the opposite manner.
5 CONCLUSIONS
In conclusion, our study demonstrates that TGF-β acts as a tumoral suppressor or promoter in intestinal cells, depending on the activation status of its signaling pathways. As a tumor suppressor, TGF-β inhibits PGE2-mediated tumorigenicity, possibly through the canonical pathway. As a tumor promoter, to induce cell invasion, TGF-β is dependent on the activation of other signaling pathways such as Ras oncogenic activation, Wnt/β-catenin signaling, and increased COX-2 expression. We highlight the importance of these molecular players as regulators of invasiveness, all of which could be useful as important therapeutical targets for improving CRC treatment.
ACKNOWLEDGMENTS
This study was supported by grants of Conselho Nacional de Desenvolvimento Científico e Tecnológico, grant number 309259/2018-5; Fundação Carlos Chagas Filho de Amparo à Pesquisa do Estado do Rio de Janeiro, grant number E-26/203.325/2017, E-26/010.101072/2018 and Instituto Nacional de Câncer - Ministério da Saúde. We are grateful to all members of the laboratory for the assistance with assays and the constant discussion concerning the manuscript. This text was revised by Editage from Rockfeller University Press.
CONFLICT OF INTERESTS
The authors declare that there are no conflict of interests.
Open Research
DATA AVAILABILITY STATEMENT
Data available on request from the authors.


