Epigenomic exploration of disease status of EGFR-mutated non-small cell lung cancer using plasma cell-free DNA hydroxymethylomes
Yong Peng and Jason Karpus contributed equally.
List of Abbreviations
-
- 5hmC
-
- 5-hydroxymethylcytosine
-
- ANOVA
-
- analysis of variance
-
- AUC
-
- area under the receiver operating characteristic curve
-
- cfDNA
-
- cell free DNA
-
- CV
-
- coefficient of variation
-
- CV
-
- cross validation
-
- DPs
-
- differential peaks
-
- EGFR
-
- epidermal growth factor receptor
-
- Ex20 LI
-
- exon 20 loop insertion
-
- FBXL7
-
- f-box and leucine rich repeat protein 7
-
- LEPR
-
- leptin receptor
-
- lgG3
-
- immunoglobulin G3
-
- lgM
-
- immunoglobulin M
-
- MDS
-
- multidimensional scaling
-
- NORPEG (RAI14)
-
- novel retinal pigment epithelial cell protein
-
- NSCLC
-
- non-small cell lung cancer
-
- PACC
-
- P-loop and αC-helix compressing
-
- PCA
-
- principal component analysis
-
- PEER
-
- probabilistic estimation of expression residuals
-
- RAI14 (NORPEG)
-
- retinoic acid induced 14
-
- TFs
-
- transcription factors
-
- THRB
-
- thyroid hormone receptor beta
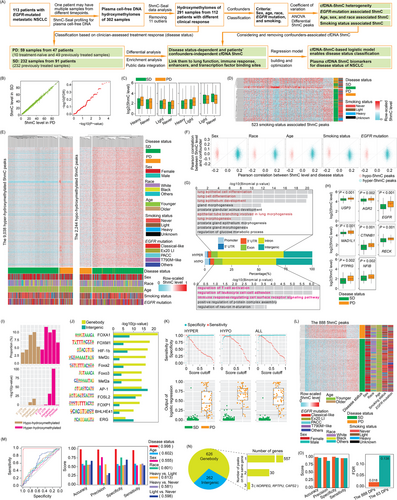
Non-small cell lung cancer (NSCLC) represents about 85% of histological diagnoses of lung cancer [1]. Epidermal growth factor receptor (EGFR) mutations occur in 12.7%-40.3% of NSCLC [2], and 5-hydroxymethylcytosine (5hmC) signatures and pathways can be inhibited by EGFR signaling [3]. The epigenome of plasma cell-free DNA (cfDNA), including 5hmC, has demonstrated promise as a cancer biomarker [4]. Currently, it remains unknown whether cfDNA 5hmC can identify disease status of NSCLC. Here, we performed 5hmC Seal-sequencing of 302 plasma cfDNA samples from 113 patients with metastatic EGFR-mutated NSCLC, which included 240 samples reflecting stable disease (SD) and 62 samples reflecting progressive disease (PD) (Figure 1A, Supplementary Table S1). SD and PD were clinically defined by the treating physician (Supplementary Methods).

High quality was ensured, 11 samples as outliers were discarded, and batch effects were removed effectively (Supplementary Figures S1, Supplementary Tables S2-S3). The remaining 291 samples were classified by disease status and various potential confounding factors (Figure 1A, Supplementary Tables S4-S7). The relative frequency of disease status in each group was nearly identical to that of the overall 291 samples (Supplementary Figure S4). cfDNA 5hmC peaks of each sample displayed proper reproducibility (Supplementary Figure S5A). Interestingly, 123 cfDNA 5hmC peaks were located on the EGFR gene (Supplementary Figure S5B, Supplementary Table S8). Genomewide cfDNA 5hmC levels were overall similar between PD and SD samples, as well as various potential confounders (Supplementary Figures S5C-E and S6).
A substantial portion of 5hmC peaks displayed high heterogeneity of 5hmC levels among the 291 samples (Supplementary Figure S7A), which were not derived from disease status and potential confounders (Supplementary Figure S7B-E, Supplementary Table S9). With 1,000 bp bins instead of peaks, similar results were observed (Supplementary Figure S8). We found that EGFR mutations were associated with 5hmC heterogeneity (Supplementary Figure S9A) and identified 4,743 cfDNA 5hmC peaks (Supplementary Table S10) with 5hmC levels differing among intergroups of EGFR mutation subtypes more than that of intragroups (P < 0.005) (Supplementary Figure S9B). Interestingly, the 4,743 cfDNA 5hmC peaks were strongly associated with the function of EGFR (Supplementary Figure S10A), but not associated with disease status (Supplementary Figure 10B-E). This result was further confirmed by a nearly identical 5hmC level between PD and SD samples (Supplementary Figure 10F), as well as distribution of false discovery rate and P values (Figure 1B).
Disease status-associated 5hmC peaks were completely different from potential confounder-associated 5hmC peaks, except for smoking status (Supplementary Figure S11). Consistently, 5hmC levels of SD and PD samples were significantly different on smoking status-associated peaks, but not on sex-, age-, or race-associated peaks (Supplementary Figure S12A). Comparisons between either two of the three smoking statuses or between the two disease statuses shared 123, 282, 106, and 58 differential 5hmC peaks, respectively (Supplementary Figure S12B-C, Supplementary Tables S11-S14). The shared 4 groups of 5hmC peaks showed differences of 5hmC levels between PD and SD samples (Figure 1C), and can classify both disease statuses and smoking statuses (Figure 1D, Supplementary Figure S13D-E). Overall, although 5hmC levels varied based on patients’ characteristics, only smoking status affected disease status-associated 5hmC.
The hyper- or hypo-hydroxymethylated 5hmC peaks from PD versus SD samples (Supplementary Tables S15-S16) could not identify subtypes of sex, race, age, smoking status, or EGFR mutation (Figure 1E, Supplementary Figure S13A-C). They were correlated only with disease status, but not the potential confounders (Figure 1F, Supplementary Figure S13D-E). Functional enrichment analysis showed that the hyper-5hmC peaks were closely associated with lung development, vital capacity, and smoking (Supplementary Figure S14A-C). Interestingly, the hypo-5hmC peaks were not associated with lung function directly but may affect the disease status through the immune system, such as T cell activation, leukocyte adhesion, and lgM levels (Supplementary Figure S14D-E). Like the hyper-5hmC peaks, the hypo-5hmC peaks were also associated with smoking behaviors and forced expiratory volume (Supplementary Figure S14F).
The lung function- and immune system-associated 5hmC peaks were mainly located on gene bodies, but not intergenic (Figure 1G), such as a hyper-5hmC peak at the intron of thyroid hormone receptor beta (THRB) gene (Supplementary Figure S15A) which regulates lung development [5]. Some important lung function-associated genes were hyper-hydroxymethylated (Figure 1H, Supplementary Figure S15B), whereas hypo-5hmC peaks were located on the gene body of immune-associated genes (Supplementary Figure S15C, Supplementary Table S17). Regulatory elements and lung enhancers were enriched in the gene body, promoter, or intergenic regions of the hyper- or hypo-5hmC peaks (Figure 1I, Supplementary Figure S15D). Motifs and binding regions of some lung function-associated transcription factors (TFs) were also enriched in the hyper-5hmC peaks (Figure 1J, Supplementary Figure S15E). Taken together, disease status-dependent and patient characteristics-independent cfDNA 5hmC peaks can be linked to lung development, smoking behavior, and immune response, as well as lung function-associated enhancers and TF-binding sites (Supplementary Figure S16).
We optimized 888 peaks (Supplementary Table S18) from the differential 5hmC peaks to build a logistic regression model with an area under the receiver operating characteristic curve (AUC) of 0.998 using appropriate cutoffs of the output probabilities (Figure 1K, Supplementary Figure S17A-B). Based on the 888 peaks, unsupervised clustering could discriminate PD and SD samples with 100% accuracy, while not being able to discriminate different groups from sex, race, age, smoking status, or EGFR mutation subtypes (Figure 1L). The AUC of the model for predicting disease status was much greater than those for classifying age, sex, race, or smoking status (Figure 1M, Supplementary Figure S17C). Our cfDNA 5hmC-based logistic regression model could discriminate disease status accurately, sensitively, and specifically, and was independent of potential confounding factors in NSCLC (Figure 1M, Supplementary Figure S17D-E). The 888 peaks could not distinguish the 10 treatment-naïve samples and the 49 previously treated samples (Supplementary Figure S17F-G).
As expected, most of the 888 peaks were located at gene bodies, and multiple peaks might locate on the same gene (Figure 1N). Interestingly, three genes with three of the 888 peaks (Figure 1N) were strongly associated with lung function and lung cancer [6, 7], and highly expressed in various cancers including lung cancer (Supplementary Figure S18A). More importantly, lung cancer patients with different expression levels of the retinoic acid-induced 14 (RAI14 or NORPEG) gene demonstrated a 16% difference of survival probability (Supplementary Figure S18B). Furthermore, some of the 30 genes with t peaks (Figure 1N) were associated with lung function such as leptin receptor (LEPR) and f-box and leucine rich repeat protein 7 (FBXL7) [8, 9], survival probability of patients with lung cancer (Supplementary Figure S18C-D), and exhibited high expression level in lung cancer (Supplementary Figure S18E). To determine 5hmC biomarkers for disease status, the top 63 cfDNA 5hmC peaks (Supplementary Table S19) with maximum absolute values of logistic regression coefficients were selected from the 888 peaks. The 63-5hmC peak-based logistic model could also achieve high performance (Figure 1O, Supplementary Figure S19A-B). Some of the 63-peak-associated genes not only played an important role for lung function but also correlated with lung cancer survival probability (Supplementary Figure S19C-E).
Overall, we found that smoking status affected disease status-associated cfDNA 5hmC. We unveiled that lung function and regulatory elements were enriched in disease status-associated 5hmC peaks which could discriminate progressive and stable NSCLC with high sensitivity and specificity. Our results conferred the epigenomic distinguishability of different treatment responses and nominated cfDNA 5hmC profiling as a non-invasive, cost-effective, and universally applicable approach to monitor disease status.
AUTHOR CONTRIBUTIONS
C.M.B. and C.H. contributed to project conceptualization and study design. J.K. collected samples and prepared libraries for sequencing. Y.P. performed the bioinformatic analysis. J.D.P., E.E.V., M.C.G., K.L., Z.Z, W.Z, and M.C. helped samples collection, and provided project supervision and suggestions. Y.P., C.M.B., J.K., and C.H. wrote the manuscript with input from all authors.
ACKNOWLEDGMENTS
We have no additional acknowledgements.
CONFLICT OF INTEREST STATEMENT
C.M.B. reports research funding to the institution from AstraZeneca and BMS; advisory boards and personal consulting payments from Amgen, AstraZeneca, BMS, CVS, Daiichi Sankyo, EMD Serono, Gilead, Guardant, JNJ, Mirati, Novocure, Sanofi, Tempus and Turning Point Therapeutics. M.C.G. reports funding to the institution from Eli Lilly, MSD, Pfizer (MISP); AstraZeneca, MSD International GmbH, BMS, Boehringer Ingelheim Italia S.p.A, Celgene, Eli Lilly, Ignyta, Incyte, MedImmune, Novartis, Pfizer, Roche, Takeda, Tiziana, Foundation Medicine, Glaxo Smith Kline GSK, Spectrum pharmaceuticals. MCG reports advisory boards and personal consulting payments from AstraZeneca, MSD International GmbH, Bayer, BMS, Boehringer Ingelheim Italia S.p.A, Celgene, Eli Lilly, Incyte, Novartis, Pfizer, Roche, Takeda, Seattle Genetics, Mirati, Daiichi Sankyo, Regeneron, Merck, Blueprint, Jansenn, Sanofi, AbbVie, BeiGenius, Oncohost. The remaining authors report no competing interests.
FUNDING INFORMATION
No funding was received for this project.
ETHICS APPROVAL AND CONSENT TO PARTICIPATE
This study was approved by the local Institutional Review Board according to the U.S. Common Rule ethical guidelines. All patients were consented to a general thoracic biobanking study under IRB 18-1319, which allowed for utilization of samples collected under IRB 9571.
Open Research
DATA AVAILABILITY STATEMENT
Data have been deposited in the NCBI Gene Expression Omnibus (GEO) and are accessible through GEO series accession number GSE231296. Bioinformatics pipeline for 5hmC Seal-sequencing data analysis and scripts used for plotting figures are available at https://github.com/CTLife/cfDNA-5hmC_LungCancer


