Galectin 3-binding protein (LGALS3BP) depletion attenuates hepatic fibrosis by reducing transforming growth factor-β1 (TGF-β1) availability and inhibits hepatocarcinogenesis
Dae-Hwan Kim and Minjeong Sung contributed equally to this work.
Abstract
Background
Increased Galectin 3-binding protein (LGALS3BP) serum levels have been used to assess hepatic fibrosis stages and the severity of hepatocellular carcinoma (HCC). Considering the crucial role of transforming growth factor-β1 (TGF-β1) in the emergence of these diseases, the present study tested the hypothesis that LGALS3BP regulates the TGF-β1 signaling pathway.
Methods
The expression levels of LGALS3BP and TGFB1 were analyzed in patients with metabolic dysfunction-associated steatohepatitis (MASH) and HCC. Multiple omics techniques, such as RNA-sequencing, transposase-accessible chromatin-sequencing assay, and liquid chromatography-tandem mass spectrometry proteomics, were used to identify the regulatory mechanisms for the LGALS3BP-TGF-β1 axis. The effects of altered TGF-β1 signaling by LGALS3BP were investigated in conditional LGALS3BP-knockin and LGALS3BP-knockout mice.
Results
In patients with MASH and HCC, the levels of LGALS3BP and TGFB1 exhibited positive correlations. Stimulation of LGALS3BP by the inflammatory cytokine interferon α in HCC cells or ectopic overexpression of LGALS3BP in hepatocytes promoted the expression levels of TGFB1. Aggravated fibrosis was observed in the livers of hepatocyte-specific LGALS3BP-knockin mice, with increased TGFB1 levels. LGALS3BP directly bound to and assembled integrin αV, an integral mediator required for releasing active TGF-β1 from extracellular latent complex with the rearranged F-actin cytoskeleton. The released TGF-β1 activated JunB transcription factor, which in turn promoted the TGF-β1 positive feedback loop. LGALS3BP deletion in the hepatocytes downregulated TGF-β1 signaling and CCl4 induced fibrosis. Moreover, LGALS3BP depletion hindered hepatocarcinogenesis by limiting the availability of fibrogenic TGF-β1.
Conclusion
LGALS3BP plays a crucial role in hepatic fibrosis and carcinogenesis by controlling the TGF-β1 signaling pathway, making it a promising therapeutic target in TGF-β1-related diseases.
List of Abbreviations
-
- ACTA2
-
- actin alpha 2, smooth muscle 2
-
- ATAC-seq
-
- assay for transposase-accessible chromatin with sequencing
-
- CAF
-
- cancer-associated fibroblast
-
- cDNA
-
- complementary DNA
-
- ChIP
-
- chromatin immunoprecipitation
-
- CNUHH
-
- Chonnam National University Hwasun Hospital
-
- COL1A1
-
- collagen type I alpha 1
-
- CM
-
- culture medium
-
- CRISPR
-
- clustered regularly interspaced short palindromic repeats
-
- DAPI
-
- 4′,6-diamidino-2-phenylindole
-
- DEG
-
- differentially expressed gene
-
- DEN
-
- diethylnitrosamine
-
- ECM
-
- extracellular matrix
-
- ELISA
-
- enzyme-linked immunosorbent assay
-
- F-actin
-
- filamentous actin
-
- H&E
-
- hematoxylin and eosin
-
- HBV
-
- hepatitis B virus
-
- HCC
-
- hepatocellular carcinoma
-
- HCV
-
- hepatitis C virus
-
- HFD
-
- high-fat diet
-
- IFN
-
- interferon
-
- IP
-
- intraperitoneally
-
- IRF7
-
- interferon regulatory factor 7
-
- ITG
-
- integrin
-
- JunB
-
- JunB proto-oncogene
-
- KI
-
- knockin
-
- KO
-
- knockout
-
- LC-MS/MS
-
- liquid chromatography-tandem mass spectrometry
-
- LGALS3BP
-
- galectin 3-binding protein
-
- LIF
-
- LIF interleukin 6 family cytokine
-
- MMP
-
- matrix metallopeptidase
-
- MT
-
- Masson's trichrome
-
- MASH
-
- metabolic dysfunction-associated steatohepatitis
-
- p-FAK
-
- phosphorylated focal adhesion kinase
-
- PDGFB
-
- platelet-derived growth factor subunit B
-
- PPI
-
- protein-protein interaction
-
- qRT-PCR
-
- quantitative reverse transcription-polymerase chain reaction
-
- RE
-
- response element
-
- rLGALS3BP
-
- recombinant LGALS3BP
-
- rTGF-β1
-
- recombinant TGF-β1
-
- RNA-seq
-
- RNA sequencing
-
- SEM
-
- standard error of the mean
-
- SERPINE1
-
- serpin family E member 1
-
- siRNA
-
- short-interfering RNA
-
- SMAD2
-
- SMAD family member 2
-
- SPP1
-
- secreted phosphoprotein 1
-
- TCGA
-
- The Cancer Genome Atlas
-
- TGF-β1
-
- transforming growth factor-β1
-
- VCAM1
-
- vascular cell adhesion molecule 1
1 BACKGROUND
Hepatocellular carcinoma (HCC) is the most prevalent form of primary liver cancer and usually emerges in the context of chronic inflammation. The primary causes of persistent hepatic inflammation include long-term infections with hepatitis B virus (HBV) and hepatitis C virus (HCV), and sterile inflammation caused by alcohol abuse and metabolic disorders. The excessive inflammation results in the constant death of parenchymal cells and activation of non-parenchymal cells, which ultimately contribute to the development of hepatic fibrosis, cirrhosis, and HCC [1-3].
Galectin 3-binding protein (LGALS3BP), also refers to as Gal3-BP, 90K, CyCAP, and Mac2-BP, is a secreted multifunctional glycoprotein whose expression is stimulated under inflammatory conditions, particularly by type I interferons (IFNs) [4, 5]. LGALS3BP has been studied for its regulatory role in innate immunity [4-6], multiorgan fibrosis [7-9], and carcinogenesis [5, 10-13]. Increased LGALS3BP levels in individuals with viral infections, including HBV [14, 15] and HCV [16, 17], and more recently, severe acute respiratory syndrome coronavirus 2 infections, have been implicated in the regulation of antiviral immune responses [18]. Serum levels of LGALS3BP and its disease-specific N-glycosylation have been used as biomarkers for evaluating the stages of hepatic [19] and pulmonary fibrosis [7] and other fibrotic liver-associated diseases [7, 20, 21]. The prognostic value of LGALS3BP has also been investigated in patients with HCC [22, 23].
Transforming growth factor beta (TGF-β) plays a crucial role in chronic inflammation-related diseases [24, 25]. TGF-β signaling generally inhibits normal epithelial, endothelial, and immune cell proliferation and promotes the differentiation of fibroblast cell lineages that deposit extracellular matrix (ECM) components [24-26]. When parenchymal cells are infected by viruses or are undergoing necrosis, they signal neighboring cells to establish an inflammatory environment, and TGF-β1 plays an essential role in this process [24-27]. Hepatic tumor cells are formed primarily through the transformation of mature hepatocytes, which can bypass the anti-proliferation mechanisms of the TGF-β signaling pathway and exploit the suppression of immune cells in the tumor microenvironment to their advantage [27]. The mammalian genome encodes three TGF-β isoforms (TGF-β1, TGF-β2, and TGF-β3), with TGF-β1 being the principal isoform involved in fibrosis. Latent TGF-β1 homodimers are stored in the ECM, along with accessory proteins, until an appropriate stimulus is received [28-30]. However, the mechanism underlying the initial pulling force to release active TGF-β1 remains unclear.
Given the role of type I IFN-induced LGALS3BP in diagnosing liver fibrosis and HCC and the association between TGF-β1 and fibrogenic diseases and poor clinical outcomes in patients with HCC, we hypothesized that LGALS3BP would directly regulate the TGF-β1 signaling pathway under IFN-α-primed inflammatory conditions. To test the hypothesis, multi-omics strategies were employed to explore the molecular basis of the LGALS3BP-TGF-β1 axis, and relevant mouse models of fibrogenic disease and HCC with hepatocyte-specific overexpression or systemic depletion of LGALS3BP were examined.
2 MATERIALS AND METHODS
2.1 Public database analysis
The Cancer Genome Atlas (TCGA, http://www.cbioportal.org, Liver Hepatocellular Carcinoma of PanCancer Atlas) and Gene Expression Omnibus (GEO;, GSE135251) databases were used to predict the potential roles of LGALS3BP and TGFB1 in patients with liver cancer and metabolic dysfunction-associated steatohepatitis (MASH).
2.2 Clinical samples from Chonnam National University Hwasun Hospital
Tumoral and peri-tumoral normal tissues were collected from 83 patients with HCC (date of visit: from 2017-01-25 to 2021-07-14) at Chonnam National University Hwasun Hospital (CNUHH, Hwasun, Jeollanam-do, South Korea). Clinicopathological characteristics of patients are described in Supplementary Table S1. The present study was approved by the ethics committee of CNUHH (Approval number: IRB CNUHH-2021-187). Written informed consent was obtained from all the patients.
2.3 Cell culture
Mouse primary hepatocytes were isolated via in situ collagenase perfusion and separation using the Percoll (Sigma-Aldrich, Burlington, MA, USA) density-gradient method from the livers of 10-week-old male LGALS3BP-KI mice and their controllittermates or LGALS3BP fl/wt; Alb-Cre mice and their LGALS3BP fl/wt littermates. Isolated mouse primary hepatocytes were cultured in Dulbecco's modified Eagle's medium (Gibco, Burlington, MA, USA) containing 10% fetal bovine serum (FBS) with 5×10⁵ cells per well in six-well plates for 40 h before analysis. Mouse HCC (Hepa-1c1c7) and human HCC cells (HepG2, Hep3B and SNU449) were purchased from the American Type Culture Collection (ATCC, Manassas, VA, USA) or Korean cell line bank (KCLB, Seoul, South Korea). All cells in this study were cultured in the recommended medium as alpha minimum essential medium (Gibco) for Hepa-1c1c7, Dulbecco's Modified Eagle's Medium for Hep3B, Eagle's minimum essential medium (Sigma-Aldrich) with 25 mmol/L sodium bicarbonate for HepG2, or RPMI-1640 medium (Sigma-Aldrich) for SNU449 cells, containing 10% fetal bovine serum (Sigma-Aldrich) and 1% penicillin and streptomycin (Invitrogen). To evaluate the gene regulation effects of recombinant proteins, cells were serum-starved for 16 h followed by the treatment with different concentrations of recombinant IFN-α (rIFN-α), recombinant LGALS3BP (rLGALS3BP) or recombinant TGF-β1 (rTGF-β1) for subsequent whole-cell extract purificaiton or total RNA isolations.
2.4 Animals
All animal experiments were performed in specific pathogen-free facilities at Chonnam National University Medical School, according to the guidelines of the Institutional Animal Care Committee (CNU IACUC-H-2021-7). LGALS3BP-KO mice were generated using the clustered regularly interspaced short palindromic repeats (CRISPR)-associated protein 9 editing system (Macrogen, Seoul, South Korea) with two single-guide RNAs (sgRNAs, 5′-GCCAGGCAATGGCTCTCCTGTGG-3′ and 5′-CTGTGTTCTTGCTGGTTCCAGGG-3′) targeting exon 3 of LGALS3BP as previously described [31]. Briefly, the sgRNAs and Cas9 recombinant proteins were co-injected into the embryos of C57BL/6N mice (Orient Bio, Seongnam, South Korea), which were then implanted into the oviducts of foster mothers to obtain newborn pups. LGALS3BP-KO mice were screened using PCR, the T7E1 assay, and sequencing of tail genomic DNA. The PCR primers used for genotyping are listed in Supplementary Table S2. The T7E1 assay was performed using T7 Endonuclease I (M0302L) according to the manufacturer's instructions (NEB, Ipswich, MA, USA). Heterozyous LGALS3BP-KO mice were further bred on C57BL/6J genetic background mice for at least six generations and intercrossed to obtain homozygous LGALS3BP-KO mice and its control wild type littermates. The hepatocyte-specific LGALS3BP-knockin (KI) mouse was developed using the Cre-/Loxp recombinant enzyme system (Macrogen). Briefly, a silenced C-terminal Myc-tagged LGALS3BP-KI cassette under the control of LoxP sites was introduced into the ubiquitously expressed Rosa26 locus of C57BL/6J mouse embryos. Newborn heterozygous LGALS3BP-KI pups were screened and bred on a C57BL/6J genetic background for at least four generations. Alb-Cre mice were used to obtain mice with hepatocyte-specific LGALS3BP overexpression in LGALS3BP fl/wt; Alb-Cre mice. For the carbon tetrachloride (CCl4)-induced liver fibrosis model [32, 33], 18-week-old male C57BL/6J mice were injected intraperitoneally (IP) with CCl4 (0.5µL/g, 1:3, v/v in corn oil; #289116, Sigma) or vehicle (dimethyl sulfoxide in corn oil) twice per week for 4 or 6 weeks. Animals were euthanized by cervical dislocation 72 h after the final CCl4 injection, and whole livers and sera were collected. For the mouse MASH model, 8-week-old male wild type C57BL/6J mice were purchased (Orient Bio, Seongnam, South Korea) and acclimated to a 12 h light/dark cycle at 22 ± 2°C for 2 weeks. The mice were divided into two groups: the control group was fed a normal chow diet and the MASH group was fed a high-fat methionine-choline-deficient (HFMCD) diet with l-amino acids, 60% calories from fat, 0.1% methionine, and no added choline (A06071302, Research Diets, New Brunswick, NJ, USA) for 5 weeks before being sacrificed. For the diethylnitrosamine (DEN)-high-fat diet (HFD) model of liver carcinogenesis [34], 2-week-old male LGALS3BP-KO mice and their littermates were injected with DEN (25 mg/kg body weights, 442687, Merck-Millipore, Burlington, MA, USA). The mice were fed HFD (D12492, Research Diets, New Brunswick, NJ, USA) for 26 weeks until they were sacrificed. The tumors in each liver lobe were counted and measured. Tumors, non-tumor tissues, and serum samples were collected for further analysis.
2.5 Enzyme-linked immunosorbent assay (ELISA)
The levels of LGALS3BP protein were assessed in mouse serum using a mouse Mac-2 binding protein assay kit (27796, Immuno-Biological Lab, Japan). Conditioned media (CM) derived from Hepa-1c1c7, SNU449, or HepG2 cell cultures under the indicated conditions with rLGALS3BP treatment were collected and stored at −20°C. To evaluate the influence of integrin αV or FAK inhibition on the regulation of TGF-β1 by LGALS3BP, cells were pre-incubated with 0.5 ng/mL for Hepa-1c1c7 or 1 ng/mL for human HCC cell lines of GLPG0187 (HY-100506, MedChemExpress, Monmouth Junction, NJ, USA) or 1 µmol/L Defactinib (HY-12289, MedChemExpress) for 1 hour before being exposed to rLGALS3BP. The concentration of TGF-β1 in the conditioned media was assessed using TGF-β1 Duoset ELISA kits (DY1679 for mouse or DY240 for human TGF-β1, R&D Systems) according to the manufacturer's instructions. Briefly, to measure concentrations of total latent TGF-β1, the CM were activated with acids treatment and stopped for the subsequent quantification. The free active forms of TGF-β1 in the CM were quantified without acid activation.
2.6 Western blotting
Whole cell extracts from mouse liver tissues, cultured mouse primary hepatocytes, or Hepa-1c1c7, HepG2, or SNU449 cell lines were prepared in standard radio-immunoprecipitation assay buffer (Invitrogen) and separated by Sodium dodecyl-sulfate polyacrylamide gel electrophoresis (SDS-PAGE) and transferred to polyvinylidene fluoride (PVDF) membranes (Invitrogen). Membranes were probed with primary antibodies and secondary peroxidase-conjugated antibodies (Jackson Immuno-Research, West Grove, PA, USA) and developed using Western BLoT Ultra-Sensitive Horseradish peroxidase Substrate (Takara, Kusatsu, Japan). Signal intensities were detected using an Image Quant LAS 4000 mini (Minato City, Tokyo, Japan). Primary antibodies against phosphorylated Mothers against decapentaplegic homolog 2 (SMAD) family member 2 (p-Smad2, #3108, 1:3,000, Cell signaling technology [CST], Danvers, MA, USA), Smad2 (#5339, 1:3,000, CST), JunB (#3753, 1:3,000, CST), β-actin (#8457, 1:3,000, CST), Myc tag (M192-3, 1:3,000, Medical & Biological Laboratories, Tokyo, Japan), Cyclophilin C-associated protein (CyCAP)/mouse LGALS3BP (#28128, 1:1,000, Immuno-Biological Lab, Japan, Fujioka, Japan), TGF-β1 (ab215715, 1:3,000, Abcam), Integrin subunit alpha V (ITGaV, #60896, 1:3,000, CST), Phosphorylated focal adhesion kinase (FAK) (#3283, 1:3,000, CST), FAK (#3285, 1:3,000, CST) and vascular cell adhesion molecule 1 (VCAM1, ab134047, 1:3,000, Abcam).
2.7 Hematoxylin and eosin (H&E), Sirius Red, Masson's trichrome (MT), and immunohistochemistry staining
Paraffin-embedded mouse liver tissues were sectioned (4-µm thick) and subjected to H&E (BBC Biochemical, Mount Vernon, WA, USA), Sirius Red (ab150681, Abcam), MT (ab150686, Abcam), and immunohistochemical staining with alpha-smooth muscle actin (α-SMA) antibodies (ab5694, 1:1,000, Abcam, Waltham, Boston, USA), TGF-β1 (ab215715, 1:1,000, Abcam), JunB (#3753, 1:3,000, CST), Ki-67 (ab16667, 1:3,000, Abcam) and a secondary antibody (ab6721, 1:1,000, Abcam). To ensure the specificity of staining, negative controls were prepared by incubating the sections with the secondary antibody alone. Additionally, hydrogen peroxidase and BSA were applied to block endogenous peroxidase activity and prevent non-specific binding. Bright-field images of histological sections were captured using a Zeiss Axio Scan Z1 slide scanner (Carl Zeiss, Baden-Württemberg, Germany). The quantification of the intensities of Sirius Red, MT, α-SMA, and TGF-β1 positively stained areas was carried out using Fiji software (version 2.14.0; National Institutes of Health, Bethesda, MD, USA) by setting and adjusting intensity thresholds based on control samples to ensure consistent detection and measurement of the mean pixel intensity. Positive nuclei for JunB and Ki-67 staining were counted and quantified using Fiji software. The intensity threshold was set to differentiate positive nuclei from the background, and the mean intensity of pixels above this threshold was measured.
2.8 Quantitative reverse transcription-polymerase chain reaction (qRT-PCR)
Total RNA from human tumoral or peri-tumoral normal tissues of CNUHH patients with HCC, mouse liver tissues, cultured mouse primary hepatocytes, or Hepa-1c1c7, SNU449, Hep3B, and HepG2 cell lines were isolated using a Ribospin II Kit (314-103, GeneAll Biotechnology, Seoul, South Korea) and reverse-transcribed to cDNA using a GoScript reverse transcriptase kit (A5001, Invitrogen, Carlsbad, CA, USA). qRT-PCR was performed using SYBR Green PCR Master Mix (PB20, PCR Biosystems, PA, USA) and the appropriate primers (Supplementary Table S3) with cDNAs using the CFX Connect Real-Time PCR Detection System (Bio-Rad Hercules, CA, USA). The thermocycling conditions were set as follows: 95°C for 3 min, followed by 40 cycles of amplification at 95°C for 10 s, 60°C for 10 s and 72°C for 30 s. The reaction was completed by determining the dissociation curve of all amplicons.
2.9 RNA-sequencing (RNA-seq) analysis
Total RNA was extracted from cultured mouse primary hepatocytes from LGALS3BP-KOand its control mice or Hepa-1c1c7 cells treated with vehicle or 5 µg rLGALS3BP (5608-GA; R&D Systems, Minneapolis, MN, USA) using a Ribospin II Kit (Geneall Biotechnology, Seoul, South Korea). Total RNA (1 µg) was used to prepare an mRNA sequencing library using the MGIEasy RNA Directional Library Prep Kit (MGI Tech, San Jose, CA, USA). The synthesized DNA-nanoball library was quantified using a QuantiFluor DNA System (Promega, Madison, WI, USA). Sequencing was conducted using the MGIseq-2000 system (MGI Tech) with paired-end 100-base pair reads. Adapter sequences and low-quality bases in the raw reads were trimmed using Skewer (Version 0.2.2, https://sourceforge.net/projects/skewer). The remaining high-quality reads were mapped to the reference genome using STAR (2.5). Differentially expressed genes (DEGs) were defined as those showing a >2-fold change between control hepatocytes and LGALS3BP-KO primary hepatocytes and a >1.5-fold change between vehicle-treated and rLGALS3BP-treated Hepa-1c1c7 cells. Volcano plots were constructed using the DEGs with Prizm software, and Reactome and Bioplanet biological pathways and transcription factor, protein-protein interaction (PPI) network were predicted using the Enrichr website [35]. RNA-seq data from Hepa-1c1c7 or primary hepatocytes were deposited in the GEO database under accession codes GSE271352 and GSE271355, including all raw and processed data.
2.10 Short-interfering RNA (siRNA) experiments
siRNA-mediated knockdown experiments were performed with two independent mouse JUNB, mouse LGALS3BP, or human LGALS3BP siRNAs (Bioneer, Daejeon, South Korea; Supplementary Table S4) using Lipofectamine RNAi-MAX (Thermo Fisher Scientific, MA, USA). Following transfection, the cells were incubated for 24 h, serum-starved for 16 h, and treated with 5 µg/mL of rLGALS3BP and/or 0.5 ng/mL of GLPG0187. The total RNA and whole-cell extracts were prepared for qRT-PCR and western blotting, respectively.
2.11 Assay for transposase-accessible chromatin with sequencing (ATAC-seq)
ATAC-seq was performed with Hepa-1c1c7 cells treated with vehicle or 5 µg/mL rLGALS3BP using an ATAC-seq Kit (C01080002, Diagenode, NJ, USA). Briefly, the cells were lysed and genomic DNA was transposed simultaneously in a transposition mix. After tagmentation, the transposed DNA fragments were purified and amplified using PCR. The final libraries were purified using AmPure XP Magnetic Beads (Beckman Coulter, Brea, CA, USA), quantified using a Qubit 2.0 Fluorometer (Thermo Fisher Scientific), and sequenced using the NovaSeq platform (Illumina, CA, USA). Potential sequence adapters and low-quality reads were trimmed using the Skewer software. The cleaned quality reads were mapped to the reference genome using bowtie2 (2.3.2). We performed strand cross-correlation analysis to check the suitability of ATAC-seq data for further analysis. MACS2 (2.1) with ‘default’ or ‘broad’ parameters was used to identify the significantly enriched regions. Motif enrichment in peaks was performed using findMotifGenome.pl in Homer (4.9) [36]. ATAC-seq data were deposited in the GEO database under the accession code GSE271354, including all raw and processed data.
2.12 Activator protein-1 (AP-1) reporter assays
Hepa-1c1c7, SNU449, or HepG2 cells were seeded to transiently transfect AP-1 reporter (631906, Clontech, CA, USA) in 96-well plates using Lipofectamine 3000 (Thermo Fisher Scientific). Culture media was changed into serum free medium 20 h following transfection and then treated with increased amounts of rLGALS3BP. Cells were subsequently washed with PBS, lysed for Dual luciferase assay (E1910, Promega, MI, USA), and reporter activities were measured by luminometer (SpectraMax, i3X, Molecular devises, CA, USA).
2.13 Chromatin immunoprecipitation (ChIP) analysis
ChIP assays to validate JunB binding at TGFB1 promoter were performed using Hepa-1c1c7 cell lysates and an EZ-ChIP Kit (17-371, Merck-Millipore, Burlington, MA, USA) with α-JunB (#3753, CST) or normal rabbit IgG (#2729, CST). Briefly, formaldehyde-cross-linked cells were lysed and sonicated to prepare genomic DNA fragments (200-500 bp). For each assay, 4 µg of antibody was used to immunoprecipitate 40 µg of input chromatin. Immune complexes were recovered using 30 µL of resuspended protein A/G agarose. After washing, the DNA was de-crosslinked and eluted, as described in the manufacturer's instructions. qPCR was performed in a 7500 Fast Thermal Cycler (Life Technologies, Carlsbad, CA, USA), using the ChIP primers listed in Supplementary Table S3.
2.14 Liquid chromatography-tandem mass spectrometry (LC-MS/MS)
Whole-cell extracts of primary hepatocytes isolated from LGALS3BP-KI mice were prepared to identify the PPI network using Myc-tagged LGALS3BP. One-milliliter pellets of primary hepatocytes were sonicated in 2.5 mL lysis buffer (25 mmol/L Tris-Cl pH 7.4, 150 mmol/L KCl, 1 mmol/L Ethylenediamine tetraacetic acid, 0.5% NP40, protease inhibitors) and immunoprecipitated. Following incubation with agarose beads or anti-Myc-conjugated agarose beads at 4°C for 2 h, the pellets were washed three times with lysis buffer and twice with phosphate-buffered saline. The precipitated proteins were digested and reconstituted with 0.1% formic acid in LC-MS grade water and analyzed using a Dionex UltiMate 3000 nano LC system connected to an Orbitrap Fusion Lumos MS equipped with an EASY-Spray ion source (Thermo Fisher Scientific).
2.15 Co-immunoprecipitation assay
Hepa-1c1c7 and SNU449 cells were transfected with a vector encoding Myc-tagged LGALS3BP or the parental vector, cultured for 40 h, and incubated in serum-free medium for 16 h. Ten milliliters of conditioned medium from each plate was incubated with anti-Myc-conjugated agarose beads, washed, and then incubated with Hepa-1c1c7 whole-cell extracts prepared with Pierce IP lysis buffer (#87787, Thermo Fisher Scientific). Following incubation at 4°C for 2 h, the beads were washed twice with Pierce IP lysis buffer (25 mmol/L Tris-Cl, pH 7.4, 150 mmol/L KCl, 1 mmol/L Ethylenediaminetetraacetic acid, 0.5% NP40, and protease inhibitors) and once with lysis buffer containing 300 mmol/L NaCl. Bead-bound proteins were resolved by SDS-PAGE followed by western blotting with antibodies against ITGαV (#60896, 1:3,000), ITGα5 (#4705, 1:3,000), and ITGβ1 (#34971, 1:3,000) from CST or an anti-Myc tag antibody (M192-3) from MBL with indicated dilutions.
2.16 Immunofluorescence staining
Hepa-1c1c7, HepG2, and SNU449 cells were subjected to immunofluorescence (IF) staining. Briefly, cells were fixed with 4% paraformaldehyde for 10 min, followed by permeabilization with 0.1% Triton X-100 for 15 min. After rinsing the samples with 1x PBS, a solution of 1% bovine serum albumin and 0.5% Tween-20 was applied to block non-specific antibody-binding sites. Anti-p-FAK (PA5-85602, Invitrogen), Phalloidin-conjugated Alexa Fluor 647 antibody (A22287, Invitrogen), and 4′,6-diamidino-2-phenylindole (DAPI) were used to label the phosphorylated FAK, filamentous actin (F-actin), and nuclei, respectively. To detect the ITGαV accumulation by LGALS3BP overexpression, HepG2 cells were seeded on poly-L-lysine (P4707, Sigma-Aldrich) coated eight well chambers (154534, Thermo Fisher Scientific). After 24 h, when cells achieved 70%–80% confluence, transfections were carried out with Lipofectamine 3000 (Thermo Fisher Scientific) and pcDNA6/myc-LGALS3BP (0.5ug/wells). Cells were fixed with 4% paraformaldehyde, and permeabilized with 0.1% Triton X-100. Myc-tagged LGALS3BP was detected using a mouse Myc-tag antibody (M192-3, MBL) followed by Alexa Fluor 488-conjugated secondary antibody (A32723, Invitrogen). ITGαV (ab179475, Abcam) was detected using rabbit anti-ITGaV antibody followed by Alexa Fluor 647-conjugated secondary antibody (A32733, Invitrogen). For Proximity Ligation Assay (PLA), HepG2 cells were transiently transfected with myc-LGALS3BP expressing vectors on coated eight well chambers (154534, Thermo Fisher Scientific). After 24 h, cells were permeabilized and blocked using a PLA kit (DUO92101, Sigma-Aldrich, St. Louis, MO) according to the manufacturer's instructions. Primary antibodies were incubated with cells for 2 h at 37°C and then washed and incubated with PLA probes. A mounting medium with DAPI (Sigma-Aldrich, St. Louis, MO) was added and cells were visualized under fluorescence with Texas Red filter (excitation 594 nm, emission 624 nm) with a Zeiss LSM 780 laser-scanning confocal microscope. Confocal images were acquired using an Olympus FLUOVIEW FV1000 confocal microscope and quantified using Image J Fiji software (version 2.14.0) and Zen blue 3.1 software (Zeiss, Oberkochen, Germany).
2.17 Triglyceride quantification
Triglyceride levels were measured in 30 mg homogenized liver tissue or mouse plasma samples using a triglyceride assay kit (ab65336, Abcam) according to the manufacturer's instructions.
2.18 Oil Red O staining
For frozen sections, the liver tissues were fixed with 4% paraformaldehyde overnight and then infiltrated with 30% sucrose. The tissues were embedded in OCT compound (Tissue-Tek, Sakura Finetek USA, Torrance, CA) and stored at −80°C until analysis. Frozen tissues were sectioned at 6 µm using a cryostat (CM1860, Leica Biosystems, IL, USA). The sections were then dried, fixed in 10% formalin, and washed with 60% isopropanol. The slides were stained with Oil Red O (O0625, Sigma-Aldrich) working solution for 15 min. The slides were counterstained with hematoxylin and washed with distilled water. Positively stained areas were quantified using Fiji software (version 2.14.0; National Institutes of Health, Bethesda, MD, USA).
2.19 Statistical analysis
All statistical analyses were performed using GraphPad Prism10 (Graph Pad, San Diego, CA, USA) and values are expressed as the mean ± standard deviation from three independent experiments, unless otherwise indicated. Student's t-test was used to determine the statistical significance between two groups, and two-way analysis of variance (ANOVA) for comparing more than two groups. P < 0.05 was considered significant.
3 RESULTS
3.1 Correlation of TGFB1 expression with LGALS3BP expression in HCC patients
To investigate the role of LGALS3BP in hepatic carcinogenesis, gene sets positively correlated with LGALS3BP expression in TCGA HCC dataset were analyzed using Reactome pathway analysis. As the regulatory role of LGALS3BP in innate immunity and cell-to-cell interactions has been studied, the immune system, signal transduction, and ECM organization genes were found to be significantly co-regulated with LGALS3BP expression (Figure 1A and Supplementary Table S5). As matrix metallopeptidase 2 (MMP2), MMP9, collagen type I alpha 2 (COL1A2), and TGFB1 were common to the pathways (Figure 1B), and MMP and collagen genes are regulated by TGF-β1 signaling [37-39], we hypothesized that LGALS3BP expression was closely associated with TGFB1 expression.
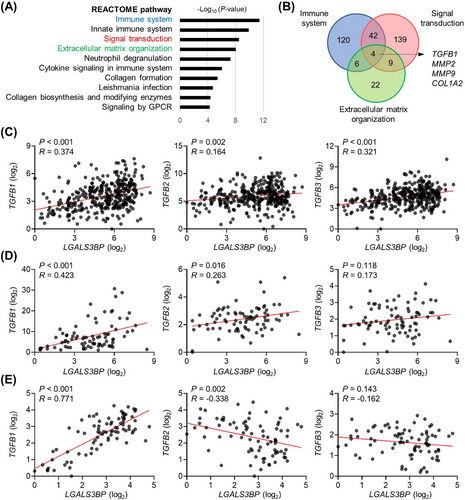
We examined the correlation between LGALS3BP and TGF-β family members TGFB1, TGFB2 and TGFB3 in primary liver cancer tissues from 83 patients who underwent surgery for HCC. As LGALS3BP expression exhibited strong positive correlations with TGFB1 in TCGA HCC data, LGALS3BP expression in HCC tumors at CNUHH also exhibited strong positive correlation with TGFB1. LGALS3BP had relatively weaker positive correlations with TGFB2 and TGFB3 (Figure 1C-E), suggesting its specialized role in TGFB1 regulation.
3.2 IFN-α induced LGALS3BP for TGFB1 expression
Treatment with IFN-α, a critical regulator of LGALS3BP expression, increased TGFB1 mRNA levels in rat preneoplastic liver cells, and IFN-α and TGF-β1 cooperated to induce liver fibrosis [40, 41]. To determine whether LGALS3BP regulates TGFB1 in this context, the effects of IFN-α on murine hepatic carcinoma Hepa-1c1c7 cells were tested. The rIFN-α treatment induced the expression of LGALS3BP and interferon regulatory factor 7 (IRF7) significantly, along with that of TGFB1 (Supplementary Figure S1A), and the knockdown of LGALS3BP using two separate siRNA constructs blocked IFN-α-dependent TGFB1 expression significantly (Supplementary Figure S1B). Notably, the mRNA expression of IFN-α-induced genes (IRF7 and MX2) and TGF-β1 target genes (VCAM1 and COL1A1) were positively associated with LGALS3BP expression in the tumoral and peri-tumoral normal tissues of HCC patients (Supplementary Figure S2).
3.3 Effect of hepatic LGALS3BP overexpression on TGFB1 upregulation and exacerbation of CCl4-induced hepatic fibrosis
To investigate the role of LGALS3BP in TGFB1 regulation in vivo, we generated a conditional knockin (KI) mouse model wherein hepatocytes specifically overexpressed LGALS3BP (Figure 2A). LGAL3BP was exclusively expressed in the liver tissues of transgenic mice when mated with Alb-Cre mice (Figure 2B). Primary hepatocytes isolated from LGALS3BP-KI mice exhibited significantly elevated TGFB1 levels along with LGALS3BP overexpression (Supplementary Figure S3A). Known TGF-β1-target genes, such as VCAM1, LIF, PDGFB, and COL1A1, were induced in LGALS3BP-KI primary hepatocytes (Supplementary Figure S3A). Culture medium and whole-cell extracts from primary LGALS3BP-KI hepatocytes showed the induced LGALS3BP protein secretion and elevated pro-TGF-β1 levels (Supplementary Figure S3B).
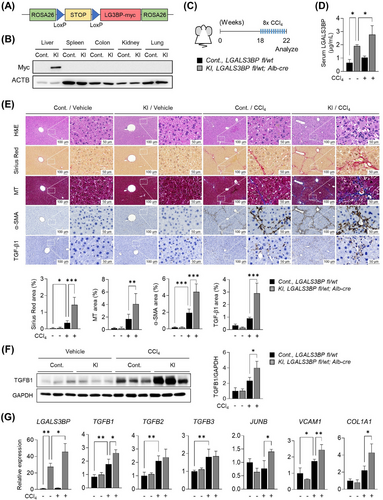
We used a CCl4-induced model of hepatic fibrosis to demonstrate the role of LGALS3BP in hepatic fibrosis in vivo (Figure 2C) as dysregulated TGF-β1 signaling regulates the progression of the disease [26]. Hepatocyte-specific overexpression in LGALS3BP-KI mice resulted in higher circulating serum LGALS3BP levels than in their control littermates (Figure 2D). The liver tissues of CCl4-treated mice exhibited a distorted structure, with micronodules noted throughout the liver parenchyma along with fibrosis symptoms, as determined by measuring the accumulation of collagen fibers and α-SMA. The LGALS3BP-KI mice displayed a more pronounced fibrosis profile in their livers than in those of WT mice (Figure 2E). We found that the expression of TGF-β1 was significantly higher in the livers of LGALS3BP-KI mice than in those of control mice following intraperitoneal CCl4 injection (Figure 2F) along with the expression of TGF-β1 target genes (Figure 2G).
3.4 Induction of TGFB1 and its target gene expression by rLGALS3BP treatment
The fibrosis-promoting role of LGALS3BP prompted us to investigate whether secreted LGALS3BP directly regulates TGFB1 expression. Surprisingly, treatment with rLGALS3BP alone was sufficient to stimulate TGFB1 expression and its canonical downstream signaling mediator, Smad2 phosphorylation, in Hepa-1c1c7 cells (Figure 3A-B). Compared with 5 µg/mL, 20 µg/mL of rLGALS3BP did not enhance the TGFB1 induction probably due to the induced SMAD6, a negative regulator for SMAD signaling at this condition (Supplementary Figure S4).
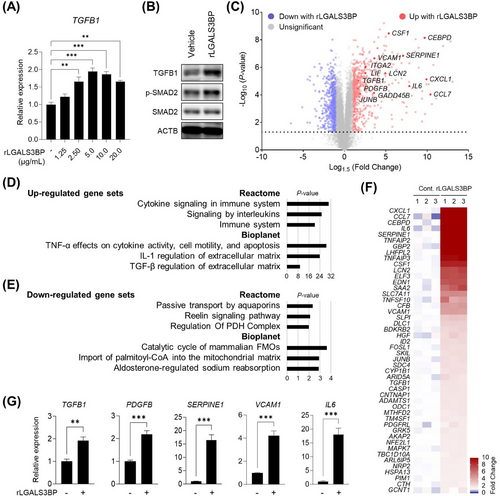
We examined the impact of gene expression in Hepa-1c1c7 cells using RNA-seq following exposure to rLGALS3BP (Figure 3C). Pathway analysis of the upregulated gene sets revealed the activation of multiple signaling pathways by inflammatory cytokines, including TNF-α, interleukins, and TGF-β1 (Figure 3D and Supplementary Table S6). Genes downregulated by rLGALS3BP treatment indicated that the metabolism of free fatty acids, such as the regulation of the pyruvate dehydrogenase complex and import of palmitoyl-coenzyme A into the mitochondrial matrix, was decreased (Figure 3E and Supplementary Table S7). The genes associated with the regulation of TGF-β on ECM was increased significantly, including known targets of TGF-β1, such as SERPINE1, VCAM1, and IL6 (Figure 3F), along with the upregulation of another TGF-β1 target gene, PDGFB (Figure 3G).
3.5 Regulation of TGFB1 expression by JunB with rLGALS3BP treatment
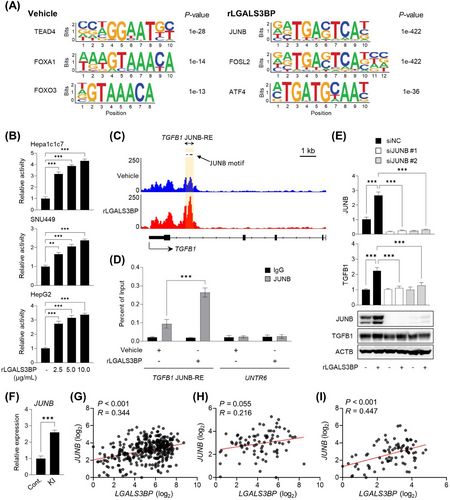
To define the underlying mechanisms via which TGFB1 expression is controlled directly, the alternation of transcription factor binding upon rLGALS3BP treatment was analyzed using ATAC-seq. Differentially accessible regions were curated for motif analysis, and one distinct transcription factor that exhibited changes in accessibility was JunB (Figure 4A), which has been studied for its role in regulating TGFB1 expression [42-45]. Transactivation of AP-1 luciferase reporter activated by transcription factors including JunB-binding sites was induced by rLGALS3BP treatment in various HCC cell lines (Figure 4B). Notably, the chromatin-accessible region around the TGFB1 locus contained three JunB-response sequences (Figure 4C). The rLGALS3BP-inducible JunB binding to ATAC peak regions was validated independently by JunB ChIP-qPCR (Figure 4D). JUNB knockdown using siRNA abolished the rLGALS3BP-promoted TGF-β1 expression completely (Figure 4E). Primary hepatocytes isolated from LGALS3BP-KI cells showed higher JUNB expression than those from the controls (Figure 4F). Using TCGA HCC data and CNUHH HCC patient tissues, a positive correlation between JUNB and LGALS3BP expression was identified (Figure 4G-I).
3.6 Interaction of LGALS3BP with ITGαV and promotion of ITGαV accumulation on the cell membrane to release TGF-β1
We observed an unexpected trend in TGFB1 mRNA expression and the amount of secreted total TGF-β1 in the culture medium upon rLGALS3BP treatment. The released active form of TGF-β1 peaked at 3 h, and even secreted total TGF-β1 levels were not altered, whereas TGFB1 mRNA expression increased gradually over time (Figure 5A, Supplementary Figure S4).
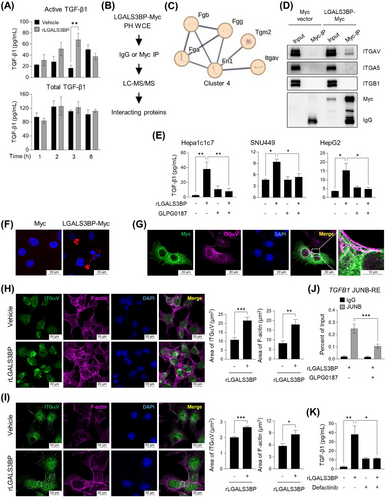
LC-MS/MS proteomics was conducted to gain insight into the mechanism of TGF-β1 release (Figure 5B). Interestingly, one network (cluster 4) interacting with LGALS3BP contained ITGαV among the 30 LGALS3BP-interacting protein clusters, and the enhanced network revealed the physical interactions between ITGαV and TGF-β1 (Figure 5C and Supplementary Figure S5A-B). The physical interaction was validated by an immunoprecipitation assay using the isolated LGALS3BP from the culture medium and ITGαV in SNU449 and Hepa-1c1c7 cell extracts (Figure 5D and Supplementary Figure S5C).
To determine the role of ITGαV in LGALS3BP-mediated TGF-β1 activation, we utilized GLPG0187, an ITGαV inhibitor that has been studied as a drug that suppresses the growth of various metastatic tumors [46] and more recently SARS-CoV-2 delta infections [46, 47]. GLPG0187 effectively inhibited the release of active TGF-β1 triggered by LGALS3BP in HCC cells, (Figure 5E). Physical interaction between transiently transfected LGALS3BP and ITGαV was observed (Figure 5F), and ectopic expression of LGALS3BP led to the ITGαV accumulation (Figure 5G). Upon rLGALS3BP treatment, ITGαV on the cell membrane was accumulated, and the number of filamentous actins (F-actin) in the cytosolic region was increased significantly (Figure 5H-I). The inhibition of ITGαV caused the reduction of the increased JunB binding to the promoter region of TGFB1 by rLGALS3BP treatment (Figure 5J). FAK is a primary intracellular downstream mediator that delivers signals from ITGαV [48, 49]. Notably, when Hepa-1c1c7 cells were treated with Defactinib, a chemical inhibitor of FAK, free TGF-β1 levels was significantly suppressed (Figure 5K)
3.7 JunB-TGF-β1 feedback loop initiation by LGALS3BP via the activation of ITGαV-mediated rearrangement of F-actin cytoskeleton
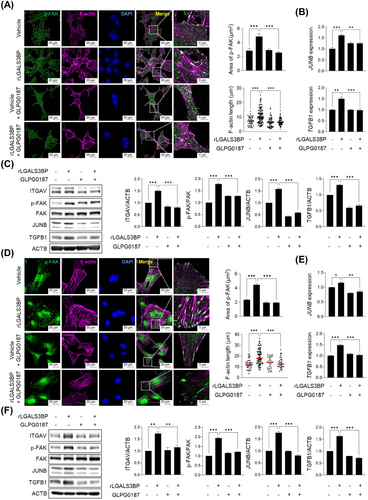
The release of active TGF-β1 from its latent complex requires the application of tensile force, which is generated by the formation of a stiff cytoskeleton modulated by ITGαV-FAK signaling [28-30, 50]. Interestingly, rLGALS3BP treatment led to the increased FAK phosphorylation and the subsequent rearrangement of F-actin cytoskeleton in Hepa-1c1c7 cells (Figure 6A). GLPG0187 was found to efficiently inhibit the activation of p-FAK and F-actin stretching(Figure 6A). Inhibition of ITGαV resulted in decreased TGFB1 and JUNB mRNA expression (Figure 6B). When the cells were treated with rLGALS3BP, expression levels of ITGαV, JunB, and cytosolic pro-TGF-β1 were significantly induced; the elevated protein levels along with increased phosphorylated FAK were blocked by ITGαV inhibition (Figure 6C). The rearrangement of the cytoskeleton and subsequent gene regulation dependent on ITGαV were also observed in human HCC SNU449 cells upon treatment with rLGALS3BP (Figure 6D-F). Collectively, LGALS3BP triggered active TGF-β1 releasement from its latent complex through ITGαV-FAK-mediated stiff F-actin cytoskeleton which is critical for the tensile force generation. rTGF-β1 treatment promoted the expression of JUNB and TGFB1 (Supplementary Figure S6A), suggesting the positive feedback loop by released TGF-β1. Since TGF-β1 transcriptionally promoted LGALS3BP expression in rat thyroid FRTL-5 cells [51], we also tested whether rTGF-β1 treatment increased LGALS3BP expression. Although rLGALS3BP or rTGF-β1 treatment promoted TGFB1 expression in Hepa-1c1c7 cells, LGALS3BP levels were not changed at these conditions (Supplementary Figure S6B).
3.8 Downregulation of TGF-β1 signaling and CCl4-induced fibrosis by LGALS3BP depletion
The observation that the JunB-TGF-β1 axis was directly regulated by secreted LGALS3BP prompted us to examine the effect of LGALS3BP depletion on the regulation of TGF-β1 signaling in the livers using LGALS3BP KO mice (Supplementary Figure S7). As an initial step, we analyzed the expression of altered genes in the isolated primary hepatocytes. DEG analyses between control and LGALS3BP-KO primary hepatocytes from RNA-seq analysis revealed significant downregulation of TGF-β1 and its target genes (Figure 7A). Upregulated genes were associated with multiple metabolic processes, including phenylalanine and tyrosine amino acid metabolism (Figure 7B and Supplementary Table S8). Notably, Reactome gene sets with downregulated genes showed decreased non-ITG membrane and ECM interactions and organization genes (Figure 7C and Supplementary Table S9). Moreover, the upregulated gene sets of Bioplanet pathways in rLGALS3BP-treated cells (Figure 3D) was reversed by the depletion of LGALS3BP (Figure 7C). TGF-β signaling mediators, Smad2/3, and its active transcriptional partner Smad4 were predicted to be factors associated with decreased gene sets (Supplementary Figure S8A), and TGF-β1 target genes, VCAM1, PDGFB, LIF, and COL1A1, were downregulated along with TGFB1 (Supplementary Figure S8B).
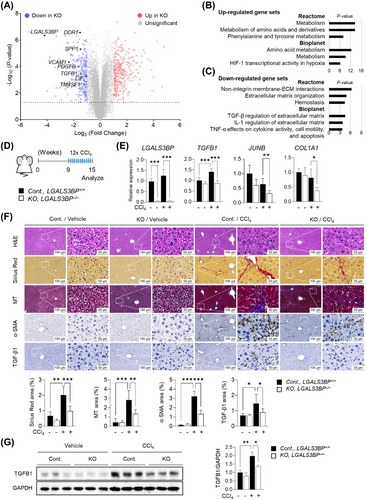
We further examined a CCl4-induced fibrosis mouse model to demonstrate the role of LGALS3BP depletion in vivo (Figure 7D). As expected, induced expression levels of TGFB1 by hepatic fibrosis were reduced by depleting LGALS3BP along with JUNB and COL1A1 significantly (Figure 7E). The livers of LGALS3BP-KO mice demonstrated reduced fibrosis compared to those of WT mice, as evidenced by decreased collagen fiber deposition and α-SMA expression (Figure 7F). TGF-β1, ITGαV, p-FAK, and JunB levels were significantly reduced in LGALS3BP-KO mouse livers, (Figure 7G and supplementary Figure S9) as opposed to the stimulation seen in LGALS3BP-KI mouse livers (Supplementary Figure S3C).
3.9 Reduction of the steatohepatitis-induced hepatocarcinogenesis by LGALS3BP depletion
We found that MASH severity in human patients was associated with increased LGALS3BP along with TGFB1 and COL1A1 expression, and LGALS3BP and TGFB1 levels were positively correlated in the patients [52] (GSE135251, Supplementary Figure S10A-C). In fact, LGALS3BP expression was elevated significantly along with TGFB1 in the livers of mice fed a HFMCD diet (Supplementary Figure S10D-E), which is a mouse model for studying MASH [53, 54].
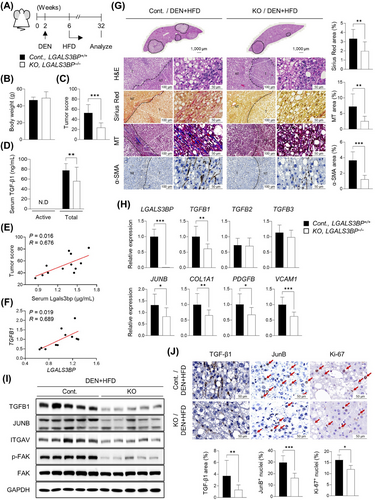
As uncontrolled chronic inflammation-induced hepatic fibrosis is closely associated with the development of hepatic carcinogenesis [32], we investigated whether LGAL3BP depletion ameliorates DEN- and HFD-induced hepatic carcinogenesis via regulating TGF-β1 signaling (Figure 8A). The livers of LGALS3BP-KO mice showed a noticeable decrease in tumor score, despite having body weight and lipid contents similar to WT mice (Figure 8B-C and Supplementary Figure S11). We found that active TGF-β1 was not detectable in the plasma probably due to its short half-life of 2-3 min [55]. However, circulating total TGF-β1 levels were significantly less in the DEN+HFD KO mice (Figure 8D). Serum levels of LGALS3BP were positively correlated with tumor scores (Figure 8E), and TGFB1 and LGALS3BP expression was correlated positively in the liver tumors of WT mice (Figure 8F). Furthermore, the accumulation of collagen and α-SMA around the tumor nodules decreased in the KO mouse livers (Figure 8G). Levels of TGFB1 and its associated genes were decreased in LGALS3BP-KO mouse liver tumors (Figure 8H-I). TGF-β1-stained area near the tumor sites, JunB-positive nuclei, and the proliferation of tumor cells were all decreased (Figure 8J). LGALS3BP was required for the expression of TGFB1 and its target genes, including JUNB, PDGFB, VCAM1, SERPINE1, and COL1A1 in various HCC cell lines (Supplementary Figure S12).
4 DISCUSSION
LGALS3BP and TGF-β1 are crucial components of the innate immune response, and impairments in their function have been associated with organ fibrosis and the development of multiple tumors [5, 13, 25, 39]. By conducting an unbiased transcriptome analysis coupled with proteomics analysis and in vivo experiments using mouse models, we found that LGALS3BP plays a key role in regulating TGF-β1 expression. Specifically, we uncovered mechanisms related to LGALS3BP that enhance the availability of TGF-β1, which is crucial for controlling the acute immune environment and explains the persistence of inflammation-mediated organ fibrosis and carcinogenesis. As a tumor expands, fibroblasts close to cancer cells including cancer-associated fibroblasts (CAFs) often grow along with the tumor and suppress immune surveillance. In such instances, an increased level of LGALS3BP in tumor cells can promote the growth of CAFs by increasing the availability of TGF-β1. The high levels of TGF-β1, as an essential regulator of innate immunity, can suppress the activity of natural killer cells, macrophages, and neutrophils, thereby creating an environment of negative immune regulation [24, 25]. We hypothesize that this may contribute to the oncogenic effects observed in patients with HCC who have elevated LGALS3BP levels.
Serological and histological levels of LGALS3BP are significantly elevated in patients with hepatic fibrosis, cirrhosis, and HCC, and a correlation exists between increased LGALS3BP levels and the progression and aggravation of liver disease following viral infection. Assessing LGALS3BP levels is a non-invasive approach to disease diagnosis [16, 20, 22, 23, 56]. LGALS3BP levels are elevated in serum samples of patients with fibrosis or sepsis, in the secretome of human cerebral organoids, and in late-stage human fibrotic tissues; it is also commonly induced in tissues obtained from mouse models following liver injury induced by various pathological conditions such as concanavalin A or CCl4 treatment, or common bile duct ligation [57-59]. Given that these investigations have focused on the role of LGALS3BP in the development of tissue fibrogenesis, further analyses (i.e., a more thorough assessment involving the IFN-α/LGALS3BP/TGF-β1 axis, comprehensive serological analysis, and examination of secreted proteins through proteomic studies) should be performed to enable a more accurate diagnosis.
The development of hepatic fibrosis and carcinogenesis is influenced by numerous cells in the liver, such as hepatic stellate cells and Kupffer cells. When we analyzed the secreted levels of LGALS3BP in different cell types, NIH3T3, a fibroblast cell line, and RAW264.7, a macrophage cell line that could represent various cell types in the liver, including stellate and Kupffer cells. We found that the levels of secreted LGALS3BP were detectable in all cell types in serum-free culture medium. Notably, the basal secretion level of LGALS3BP was the highest among the tested cell lines in RAW264.7. However, when the cells were exposed to 50U/ml IFN-α, the secreted LGALS3BP levels of Hepa-1c1c7 cells drastically increased compared to the subtle changes of RAW264.7 cells (Supplementary Figure S13). This suggests that hepatocytes are not the sole source of extracellular LGALS3BP and that in vivo levels are influenced by multiple factors in the environment. During physiological conditions, the initial increased secretion of LGALS3BP by epithelial hepatocytes, triggered by viral infections or toxic chemical-induced cell death, may be the primary source of extracellular LGALS3BP. However, quiescent stellate cells transformed into fibroblasts and infiltrated macrophages could be significant sources of extracellular LGALS3BP in pathological inflammation conditions.
ITGαV, in combination with the β1, β3, β5, β6, and β8 integrins, forms heterodimeric receptors that bind to Arg-Gly-Asp and activate TGF-β1 and TGF-β3, which are key mediators of fibrosis [60]. TGF-β activation in latent complexes with myofibroblasts or epithelial cell integrins αvβ1, αvβ3, αvβ5, or αvβ6 requires cytoskeletal contractions when fibroblasts differentiate into myofibroblasts during fibrotic-tissue development or TGF-β1-signaling activation in epithelial cells [50, 61, 62]. The initial activation of TGF-β1 by LGALS3BP can trigger a feedforward loop involving the release of active TGF-β1 (which upregulates TGFB1), leading to further upregulation of ECM-related proteins. These increased ECM marker levels result in a self-sustaining TGF-β1-signaling condition since the necessary molecules (including the TGF-β1 complex and its cognate receptor) are present in close proximity [29]. Investigations into the clinical use of small-molecule inhibitors targeting ITGαV, such as GLPG0187, have been used to treat various fibrosis-related diseases, including idiopathic pulmonary fibrosis, MASH, and coronavirus disease 2019 [46, 47, 62]. Given that ITGαV and TGF-β1 play critical roles in various biological pathways, inhibition of these signaling axes by blocking LGALS3BP could be used to treat several diseases, including those associated with fibrosis and carcinogenesis.
Further comprehensive studies are required on the interacting domains/motifs and the requirement of LGALS3BP glycosylation for interactions between LGALS3BP and ITGs to develop tools for enhancing or blocking rigid actin cytoskeleton formation. Another route by which ITGαV is activated involves the enhanced arrangement of its ligands around cells by LGALS3BP. Fibronectin, an ECM protein that interacted with LGALS3BP (Figure 5C), mediates cell-to-ECM interactions during wound healing, fibrosis, and tumor progression, and functions as a ligand for ITGαV [11, 63]. Therefore, it is imperative to elucidate the related physical interactions at the molecular level to facilitate the development of drugs to cure diseases caused by aberrant TGF-β1 signaling.
The persistent viral infections caused by HBV or HCV led to chronic inflammation, which is a key factor in the progression of MASH [64, 65]. LGALS3BP plays a substantial role in the body's defense mechanism and has been shown to have antiviral activity against a range of viral infections, such as influenza A virus, vesicular stomatitis virus, and herpes simplex virus, according to previous studies [4]. This suggests that LGALS3BP likely plays a role in regulating MASH symptoms caused by viral infections. However, while the function of LGALS3BP in the context of infectious diseases has been relatively well-investigated, its role in sterile inflammation, including chemical-induced hepatic fibrosis and metabolic dysfunction associated steatohepatitis, has received less attention in research. Our aim was to explore the role of LGALS3BP in a sterile inflammation context where there was no detectable viral load. Our results indicated that LGALS3BP was markedly induced in these situations, such as in response to CCl4 injection, a high-fat methionine-choline-deficient diet, or a DEN-high fat diet. Our study emphasized the critical role of LGALS3BP in regulating the fibrogenic TGF-β1 signaling pathway in sterile inflammation. We hypothesize that LGALS3BP may have a similar role in infectious diseases and metabolic dysfunction by regulating TGF-β1, but the role of LGALS3BP-TGF-β1 axis in infectious diseases needs to be validated in future studies.
5 CONCLUSIONS
LGALS3BP secretion is a key factor that initiates TGF-β1 signaling, which is crucial for regulating inflammatory responses, fibrosis, and carcinogenesis in the liver. This finding provides a better understanding of the molecular mechanisms underlying these processes and could lead to the development of effective therapies for malignant tumors.
AUTHOR CONTRIBUTIONS
DHK and MS conceptualized the study and drafted the manuscript. DHK, MS, MSP, KR, EGS, KHY, and SYJ designed experiments and developed the methodology. DHK, MS, MSP and KR performed the cell line and mouse model experiments. SY analyzed the human MASH patients’ data. SYJ performed and analyzed the LC-MS/MS proteomics study. WKB, SHC, and IJC interpreted data and reviewed the manuscript. All authors have read and approved the final manuscript.
ACKNOWLEDGMENTS
The biospecimens and data used in this study were provided by the Biobank of Chonnam National Univerisity Hwasun Hospital, a member of the Korea Biobank Network. This research was supported by the Bio & Medical Technology Development Program of the National Research Foundation (NRF) (grant number NRF-2020M3A9G3080281) and an NRF grant (grant number NRF-2020R1A5A2031185) funded by the Korean Government.
CONFLICTS OF INTEREST STATEMENTS
None.
ETHICS APPROVAL STATEMENT AND CONSENT TO PARTICIPATE
This study was approved by the Chonnam National University Hwasun Hospital Ethics Committee (approval number: IRB CNUHH-2021-187). Written informed consent for participation was obtained from all the patients.
Open Research
DATA AVAILABILITY STATEMENT
RNA-seq and ATAC-seq data generated in this study were deposited in the GEO database under the accession codes GSE271352, GSE271354, and GSE271355, including all raw and processed data.


