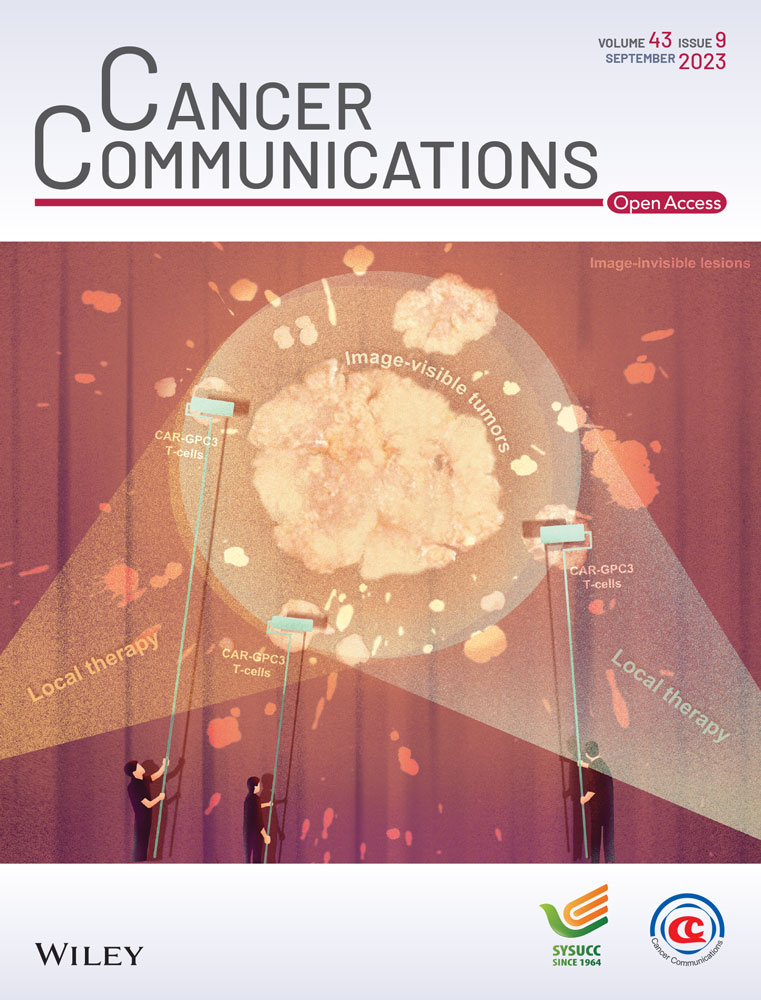
Bifidobacterium adolescentis orchestrates CD143+ cancer-associated fibroblasts to suppress colorectal tumorigenesis by Wnt signaling-regulated GAS1
Abstract
Background
The interplay between gut microbiota and tumor microenvironment (TME) in the pathogenesis of colorectal cancer (CRC) is not well explored. Here, we elucidated the functional role of Bifidobacterium adolescentis (B.a) on CRC and investigated its possible mechanism on the manipulation of cancer-associated fibroblasts (CAFs) in CRC.
Methods
Different CRC animal models and various cell line models were established to explore the function of B.a on CRC. The single-cell RNA sequencing (scRNA-seq) or flow cytometry was used to detect the cell subsets in the TME of CRC. Western blot, quantitative real-time polymerase chain reaction (qRT-PCR), or immunofluorescence staining were performed to examine the activation of Wnt signaling and growth arrest specific 1 (GAS1) on CD143+ CAFs. Chromatin immunoprecipitation quantitative real-time PCR (CHIP-qPCR) was performed to investigate the regulation of transcription factor 4 (TCF4) on GAS1. Multi-immunofluorescence assay examined the expression level of CD143 and GAS1 on tissue microarray.
Results
We found that B.a abundance was significantly reduced in CRC patients from two independent cohorts and the bacteria database of GMrepo. Supplementation with B.a suppressed ApcMin/+ spontaneous or AOM/DSS-induced tumorigenesis in mice. scRNA-seq revealed that B.a facilitated a subset of CD143+ CAFs by inhibiting the infiltration of Th2 cells, while promoting the TNF-alpha+ B cells in TME. CD143+ CAFs highly expressed GAS1 and exhibited tumor suppressive effect. Mechanistically, GAS1 was activated by the Wnt/β-catenin signaling in CD143+ CAFs. B.a abundance was correlated with the expression level of CD143 and GAS1. The level of CD143+ CAFs predicted the better survival outcome in CRC patients.
Conclusions
These results highlighted that B.a induced a new subset of CD143+ CAFs by Wnt signaling-regulated GAS1 to suppress tumorigenesis and provided a novel therapeutic target for probiotic-based modulation of TME in CRC.
Abbreviations
-
- CRC
-
- colorectal cancer
-
- TME
-
- tumor microenvironment
-
- B.a
-
- Bifidobacterium adolescentis
-
- E.coli
-
- Escherichia coli
-
- CAF
-
- cancer-associated fibroblast
-
- AOM/DSS
-
- azoxymethane/dextran sulfate sodium salt
-
- scRNA-seq
-
- sing-cell RNA sequencing
-
- GAS1
-
- growth arrest specific 1
-
- MDSC
-
- myeloid-derived suppressor cell
-
- CFU
-
- colony forming unit
-
- MOI
-
- multiplicity of infection
-
- qRT-PCR
-
- quantitative real-time PCR
-
- FBS
-
- fetal bovine serum
-
- RCM
-
- reinforced clostridial medium
-
- BSA
-
- bovine serum albumin
-
- CM
-
- conditional medium
-
- H&E
-
- hematoxylin and eosin
-
- PCNA
-
- proliferating cell nuclear antigen
-
- GO
-
- gene ontology
-
- NAF
-
- normal cancer-adjacent fibroblast
-
- FAP
-
- fibroblast activation protein
-
- SD
-
- standard deviation
-
- EPCAM
-
- epithelial cell adhesion molecule
-
- TCF4
-
- transcription factor 4
-
- TGF-β
-
- transforming growth factor beta
-
- CHIP-qPCR
-
- chromatin immunoprecipitation quantitative real-time PCR
-
- LiCl
-
- lithium chloride
-
- siRNA
-
- small interfering RNA
-
- TCGA
-
- the cancer genome atlas
-
- FISH
-
- fluorescence in situ hybridization
-
- Treg
-
- regulatory T cell
1 BACKGROUND
Colorectal cancer (CRC) is the third most common cancer and has ranked the third leading cause in cancer-associated death globally [1, 2]. The initiation and progression of CRC was related with multiple factors including genetic or epigenetic changes, environmental factors and intestinal microbiota [3-5]. Microbiota disorder leads to intestinal homeostasis imbalance, and thereby induces epithelial dysplasia and carcinogenesis. Some “CRC-promoting” bacteria have been studied in CRC, such as Fusobacterium nucleatum [6-8], Peptostreptococcus anaerobius [9], and Bacteroides fragile [10, 11]. Previous studies demonstrated that “Cancer-suppressing” bacteria could inhibit cell proliferation [12], inducing cancer cell apoptosis [13], and produce anti-cancer compounds [14].
Bifidobacterium adolescentis (B. adolescentis, B.a) is a gram-positive anaerobic bacterium belonging to Actinobacteria phylum. Studies showed that B.a protected mice from Yersinia and toxigenic Escherichia coli (E.coli) infection, and antagonized harmful bacteria growth [15, 16]. Tze et al. [17] found that B.a could induce Th17 cells without inflammation in the murine intestine. Our previous study showed that B.a improves health span and lifespan in multiple species [18]. Low Bifidobacterium abundance in the lower gut microbiota was associated with Helicobacter Pylori-related gastric cancer [19]. B.a carried with endostatin gene was the selective inhibitor of angiogenesis and hypoxic tumor growth [20]. Transplantation with Bifidobacteria could improve the effect of melanoma immunotherapy [21]. But the role and the molecular mechanism of B.a on CRC progression have not been investigated.
Microbiota-host tumor microenvironment (TME) interaction plays a crucial role in the pathogenesis of CRC. Some “harmful bacteria” recruited myeloid-derived suppressor cells (MDSCs) or regulatory T cells (Treg) in the tumor [22, 23]. Some “beneficial bacteria” can enhance the anti-tumor immune response. Bifidobacterium increased the antigen presentation ability of dendritic cells [24]. Cancer-associated fibroblasts (CAFs) are the main cellular components of the TME [25]. Studies suggested that CAFs can modulate tumor stroma microenvironment, and their functional heterogeneity are the potential therapeutic targets for cancer. However, the role of B.a in the CRC microenvironment has not been well explored. In this investigation, we sought to identify the function and clinical relevance of B.a and CD143+ CAFs in CRC and to clarify the molecular processes underlying Wnt/β-catenin-mediated growth arrest specific 1 (GAS1) regulation.
2 MATERIALS AND METHODS
2.1 Human sample collection
Fresh stool samples were obtained from 71 patients with CRC and 40 healthy subjects at the Sir Run Run Shaw Hospital of Zhejiang University School of Medicine (cohort 1; Hangzhou, Zhejiang, China). Fresh tumor and paired normal tissues were obtained from 99 patients with CRC who underwent surgical resection at Sir Run Run Shaw Hospital (cohort 2). All samples were refrigerated at liquid nitrogen until use. Fresh CRC tissues and their paired normal tissues were obtained from 27 patients with CRC who underwent surgical resection at Sir Run Run Shaw Hospital (cohort 3). Paraffined tumor and paired normal tissues of microarray came from 77 patients with CRC who underwent surgical resection at the Second Affiliated Hospital of Zhejiang University School of Medicine (cohort 4; Hangzhou, Zhejiang, China). The clinicopathological characters, including gender, age, tumor size, pathological type, differentiation grade and TNM stage, were selected and shown in Supplementary Table S1-S5. All population with CRC had no history of immunotherapy, laxatives, probiotics, and antibiotics intake in recent one month. All samples were coded in accordance with local ethical guidelines. Written informed consent was obtained, and Clinical Research Ethics Committee of the Sir Run Run Shaw Hospital and the Second Affiliated Hospital, Zhejiang University School of Medicine approved the protocol (20211103-35). All aspects of the study were conducted in accordance with the principles of the Declaration of Helsinki.
2.2 GMrepo database analysis
The GMrepo revealed the relative abundance of human gut microbiota in the populations with different diseases (https://gmrepo.humangut.info/home; Shanghai and Hubei, China) [26]. The abundance data of B.a in the patients with CRC and the healthy people were downloaded from the GMrepo database using GMrepo RESTful APIs for R (version 3.6.1; https://www.r-project.org; Auckland, New Zealand) and the RStudio software (version 1.1.442; https://www.rstudio.com; Boston, MA,USA). We assessed data quality and removed the part with missed clinical information. Then, the relative abundance of B.a for the healthy and CRC patients was analyzed.
2.3 Bacteria strain and culture
B.a (ATCC15703) was purchased from the American Type Culture Collection (ATCC, Rockville, Maryland, USA). The bacteria genome was extracted, and V4 of 16S ribosomal RNA sequencing was performed by Tsingke Biotechnology (Beijing, China), followed by comparing the sequence results with the strain sequence in the PubMed Nucleotide BLAST database (https://blast.ncbi.nlm.nih.gov) to confirm bacterial strain at the species level. The bacteria were cultured in anaerobic modified Reinforced Clostridium Medium (BD Difco, Sparks, MD, USA) under an atmosphere of 10% H2, 10% CO2, and 80% N2 (AW500SG anaerobic workstations; ELECTROTEK, Keighley, West Yorkshire, United Kingdom) for 48 h. The non-pathogenic commensal intestinal bacteria, Escherichia coli (E.coli) strain DH5a (Code No.9057, Takara, Dalian, Liaoning, China), which was used as a negative control, was cultured in Luria-Bertani medium (Cat. #A507002, Sangon Biotech, Shanghai, China) at 37°C. When the optical density (OD) at 600nm of B.a reached 1.0, the cultures were centrifuged at 1000 × g for 5 min at 4°C and then washed twice with sterile anaerobic phosphate-buffered saline (PBS), then resuspended at a final concentration of 1 × 10⁹ CFU/300 μL under strictly anaerobic conditions.
2.4 Animal use and care
All animal studies were approved by the Institutional Animal Care and Use Committee (IACUC) of Zhejiang University (IACUC-02102214; Hangzhou, Zhejiang, China). All animal experiments strictly adhered to protocols, policies, and ethical guidelines formulated by our IACUC. ApcMin/+ mice were purchased from Nanjing Biomedical Research Institute of Nanjing University (NBRI; Nanjing, Jiangsu, China). BALB/C nude mice and C57BL/6 mice were purchased from Shanghai SLAC Laboratory Animal (Shanghai, China). All mice were maintained in ventilated cages with 12-hour light/dark cycles, constant temperature and humidity, enriched water and ad libitum feeding under specific pathogen-free (SPF) conditions.
2.5 Carcinogen-induced cancer model
Six-week-old male C57BL/6 wildtype mice were purchased from Shanghai SLAC Laboratory Animal. Before bacterial intragastric administration, the mice were fed with 2 mg/mL streptomycin (Cat. #MB1275, Meilunbio, Dalian, Liaoning, China) in the drinking water for 7 days to ensure the consistency of microbiata level between the mice and facilitate B.a colonization as previous studies reported [27]. Mice were given a cycle of one single intraperitoneal injection of azoxymethane (AOM, Cat. #A5486, Sigma, St Louis, MO, USA, 10 mg/kg body weight) at the first week, then followed by three cycles of 5 days of 2.5% Dextran Sulfate Sodium Salt (DSS, Cat. #160110, MP Biomedicals, Santa Ana, California, USA) administration. After streptomycin treatment, mice were administrated of 1 × 10⁹ colony forming units (CFU) of B.a, E.coli, or the same volume of PBS three times per week for 120 days for the development of neoplastic lesions.
2.6 Spontaneous adenomatous mice
Prior to intragastric bacteria administration, male C57BL/6J ApcMin/+ mice (6-8 week of age, 20 g) were fed with 2 mg/mL streptomycin in the drinking water for 7 days to ensure the consistency of regular microbiota and facilitate B.a colonization. ApcMin/+ mice were randomly assigned to three groups. Mice in B.a and E.coli groups were administrated 1 × 10⁹ CFU B.a or DH5a suspended in 300 μL sterile anaerobic PBS, respectively, every 2 days for 3 months. The control group was administrated with PBS. Two cycles of 10-day 1% DSS were given to accelerate tumorigenesis. The body weight of mice was measured every week and mice anus prolapse was observed at the last month.
After four months, colon and spleen tissues were harvested after fasting. Colon tissues were photographed, and the number and size of tumors were measured. Tumor sizes (diameter) were quantified as <1 mm, 1-2 mm, 2-3 mm, or >3 mm. Tumor load was calculated as the sum of all tumor diameters in a single mouse. Spleen tissues were photographed and weight measured.
2.7 Genomics library and single-cell RNA sequencing (scRNA-seq)
The prepared single-cell suspensions were loaded to 10 × Chromium to capture enough single cell according to the 10 × Genomics Chromium Single-Cell 3' kit (V3) manufacturer's instructions. The reverse transcription, cDNA amplification and library construction steps were performed according to the standard protocol (10 × Genomics). Sequencing libraries were sequenced on an Illumina NovaSeq 6,000 sequencing system (paired-end multiplexing run,150 bp) by LC-Bio Technology Co., Ltd (Hangzhou, Zhejiang, China) at a minimum depth of 20,000 reads per cell.
We excluded contaminating lineage cells and low-quality cells and finally obtained 14,736 cells. Unsupervised graph clustering divided infiltrating cells into 24 groups based on gene expression patterns. Cells were divided into 6 groups according to their top expression markers, as previous studies reported [28-30]. T cells were marked by Cd3e, Cd3d, Cd3g, Trbc1, Trbc2, and Icos. Myeloid cells were marked by Cd14, Csf1r, Fogr3, and Adgre1. Fibroblast cells were marked by Col1a2, Col1a1, Dcn, and Sparc. Cancer cells were marked by Epcam, Cdh1, Krt8, and Krt18. Endothelial cells were marked by Pecam1, Cdh5, Ramp2, and Eng. B cells were marked by Cd79a, Cd79b, Cd19, and Ms4a1. According to the fibroblast cell group, unsupervised graph clustering divided infiltrating cells into 12 groups based on gene expression. Cell types finally identified were plotted in t-Distributed Stochastic Neighbor Embedding (t-SNE).
2.8 DNA extraction and bacteria DNA quantification
Bacterial DNA from human fecal contents were extracted using QIAGEN stool kits (Cat. #51604, QIAGEN, Bodenseeallee, Stockach, Germany), and bacterial genomic DNA (gDNA) from human tissues were extracted using QIAGEN DNA mini kits (Cat. #56304, QIAGEN) according to the manufacturer's protocol. Quantitative real-time PCR (qRT-PCR) was performed to assess the B.a gene, Universal Eubacteria 16S and PGT using a Roche LightCycler®480 System (Rotor gene 6000 Software, Sydney, Australia). Each reaction was performed in triplicate with SYBR Premix Ex Taq (Cat. #RR820A, Takara), primers and 100ng template gDNA. Relative abundance was calculated by -ΔCt method. Universal Eubacteria 16s was used as the internal reference gene for stool samples. The PGT gene was used as the internal control for tissue samples. Primers used are listed in the Supplementary Table S6.
2.9 Subcutaneous tumor models
Female BALB/C nude mice (3-4 weeks of age, 15 g) were kept in SPF conditions. CAFs from CRC patients were incubated with B.a (multiplicity of infection [MOI] = 10:1) for 48 hours, then HCT-116 cells and CAFs were washed twice with PBS and harvested using trypsin-EDTA solution (Cat. #GNM25200, Genom, Hangzhou, Zhejiang, China). A total of 3 × 10⁶ HCT-116 cells were mixed with B.a treated-CAFs (MOI = 10:1) or PBS treated-CAFs with 25 μL matrigel matrix (Cat. #354234, Corning Biocoat, NY, USA), and then injected (100 μL per mouse) subcutaneously into the right flank of nude mice. After 7 days since implantation, tumor volume was monitored every two days and calculated as follows: Volume = 0.54 × L × W2, where L is the longest diameter and W is the shortest diameter. At the terminal time, the tumor weights were recorded.
2.10 Histopathological analysis
Colorectal or subcutaneous tumors were fixed overnight with 10% formalin at room temperature and then embedded in paraffin. Sections of 5 μm were stained with hematoxylin and eosin (H&E) for pathological analysis. For immunohistochemistry, Xylene and ethanol were used to deparaffinize and rehydrate the paraffin-embedded tissues. For antigen retrieval, slides were steamed for 15 min in Tris-Ethylene Diamine Tetraacetie Acid (EDTA) buffer (pH9.0; Servicebio, Wuhan, Hubei, China). Then, slides were incubated in 0.3% H2O2-methanol (Aladdin, Shanghai, China) in the jar for25 min. Slides were blocked with 3% bovine serum albumin (BSA) and Tween 20 (TBST) for 30 min. Afterwards, slides were incubated in the primary antibody overnight at 4°C followed by incubation with the biotinylated secondary antibody for 50 min. Slides were reacted with peroxidase substrate solution 3, 3′-diaminobenzidine (DAB, Servicebio) until desired stain intensity develops. Slides were nucleus counterstained with hematoxylin stain solution for 3 minutes. The dehydrated (70% ethanol-xylene substitute) slides were airdried and then mounted with neutral tree gum (Servicebio). The TBST buffer without primary antibodies as the negative control was set, while the slides of colorectal tumor tissue as the positive control were observed. Primary antibodies were listed as: PCNA-specific antibody (Cat. #GB11010-1, dilution1:1000, Servicebio), α-SMA-specific antibody (Cat. #GB13044, dilution 1:1000, Servicebio), CD31-specific antibody (Cat. #GB11063-2, dilution 1:1000, Servicebio) and Ki67-specific antibody (Cat. #GB111141, dilution 1:1000, Servicebio).
2.11 Tumor sample dissociation and single cell suspension preparation
Mice colon tumor tissues were acquired from AOM/DSS model with or without B.a. Tumors were cut into 0.5 mm2 fragments. Tumor samples were digested for 40 min at 37°C in Hanks buffer (Cat. #MA0041, Meilunbio) containing 5% FBS (Cat. #10270, Gibco, Waltham, MA, USA), Collagenase IV (200 U/mL, Cat. #A005318, Sangon Biotech) and DNase I (120 U/mL, Cat. #B300065, Sangon Biotech), as previous studies reported. Samples were typically fully dissociated at this step and filtered through a 40 mmol/L cell strainer. Cells were centrifuged down at 500 g for 10 min and resuspended in 1 mL of ACK lysis (Cat. #R1010, Solarbio, Beijing, China) and placed on ice for 3 min. Cells were spun down at 700 g for 5 min and placed on ice. The dead cells were removed by Dead Cell Removal MicroBeads (Cat. #MACS 130-090-101, Miltenyibiotec, Bergisch Gladbach, Germany) and Miltenyi ® Dead Cell Removal Kit (Cat. #MACS 130-090-101). In the end, the cells were resuspended in PBS containing 0.04% BSA and centrifuged at 300 g for 3 min at 4°C. The cell viability needed to be above 85% determined by trypan blue staining (Cat. #MA0130, Meilunbio) using an automated counter, finally subsequently adjusted the cell concentration to 700-1200 cells/μL.
2.12 Cell culture
HCT-116 human colon cancer cells were obtained from the ATCC at the beginning of this project. Cells were maintained at 37°C under 5% CO2 in McCoy's 5A (Cat. #GNM16600, Genom) with 10% (vol/vol) FBS (Cat. #10270, Gibco) supplemented with 1% (vol/vol) penicillin and streptomycin (Cat. #P1400, Solarbio) and maintained in culture for a maximum of 2 months or 10 passages. Murine embryonic fibroblast NIH/3T3 were also obtained from the ATCC at the beginning of our study and maintained in culture for a maximum of 2 months or 10 passages. All cells tested negative for Mycoplasma contamination and were authenticated on the basis of short tandem repeats fingerprinting before use.
2.13 Fibroblast isolation and culture
The fresh tumor or normal colon tissues were cut into small blocks with a diameter of 2 mm and subsequently seeded on the surface of culture flask containing DMEM supplemented with 20% FBS (Gibco) and 1% penicillin/streptomycin (Solarbio). The culture flask was inverted and maintained at 37°C under 5% CO2 for 1 hour until the culture flask was turned over. The adherent cells were continuously cultured in DMEM with 20% FBS for approximately 2 weeks (tumor tissues) or 3 to 4 weeks (paired normal colon tissues). The culture medium was replaced every three days. Large groups of fibroblasts (morphologically spindle-shaped cells) became apparent after 2 weeks and they were validated by western blot and immunofluorescence staining.
2.14 Cell culture in the presence of B.a
CAF cells were digested by trypsin-EDTA solution (Cat. #GNM25200, Genom) slightly, then seeded at a density of 2 × 10⁵ cells per well in 6-well plate and cultured in antibiotic-free DMEM with 10% (vol/vol) FBS (Gibco) overnight. Then they were incubated with B.a at a MOI of 100:1 for 48 hours. Finally, CAF cells were digested by trypsin-EDTA solution (Cat. #GNM25200, Genom) for further analysis. We examined the proliferation of CAFs by CCK-8 assay and the apoptosis of CAFs by Annexin V-FITC/PI apoptosis kit as previous study reported [31].
HCT-116 cells were subsequently seeded at a density of 2 × 10³ cells per well with the B.a or PBS incubated-CAFs (MOI = 1:10) in the 96-well plate for 24, 48, 72 hours, then the cell viability was analyzed using a Cell Counting Kit (CCK-8; Cat. #CK04, Dojindo, Kumamoto Prefecture, Japan) according to the manufacturer's instructions at different time points. Briefly, after removing the medium, cells were incubated with CCK-8 for 2 hours and the absorbance was determined at 450 nm, each test was repeated 5 times.
For lithium chloride (LiCl) stimulation assay, CAFs were incubated with Wnt signaling agonist lithium chloride (LiCl; 20 mmol/L) for 24 hours, then the expression of c-Myc, Cyclin D1, and GAS1 were analyzed.
For composition investigation, CAFs were co-cultured with live-B.a, heated-B.a (in an incubator at 100°C for 1 hour), pasteurized-B.a (in an incubator at 70°C for 30 minutes), B.a-CM (B.a-conditional medium), RCM (Reinforced Clostridial Medium)or PBS controls for 24 hours. A total of 1 × 10⁶ spleen single cell from C57BL/6 mice were co-cultured with 1 × 10⁴ B.a or PBS-treated CAFs for 48 hours, then the percentage of TNF-α+ B cells was tested by flow cytometry.
2.15 Small interfering RNA (siRNA) silencing assay
siRNA-mediated gene silencing assay in CAFs was performed with validated control or TCF4-specific siRNAs according to the manufacturer's instructions (Genepharma, Shanghai, China). The siRNA specific for human TCF4 and control siRNA were synthesized by Genepharma. Transfection of siRNA was conducted in 6-well plates with Lipofectamine 3000 (Invitrogen, Thermo Fisher Scientific, Waltham, MA, USA) as described in the manufacturer's instructions. After 48 hours of transfection, the CAF cells were collected to perform qRT-PCR analysis to confirm the knockdown efficiency. The CAF cells were also incubated with B.a at a MOI of 100:1 for 48 hours then the molecules of Wnt pathway were tested by western blot.
2.16 Plasmids and cell transfection
The full-length of GAS1 was cloned into murine expression vector PLVX-puro (Tsingke Biotechnology, Beijing, China) with Amp+ selection gene. Cells were transfected with FuGENE HD (Promega, Madison, WI, USA) in accordance with the manufacturer's protocol. To generate cell lines with stably overexpression of GAS1, NIH/3T3 cells were transduced with PLVX-puro encoding GAS1 with Ampicillin selection cassette (CAS69-52-3, Sigma-Aldrich). The expression level of GAS1 was confirmed by qRT-PCR and western blot.
2.17 Immunofluorescence staining
For cell immunofluorescence staining, cells were fixed by 10% paraformaldehyde for 15 min at room temperature. After fixing, the samples were washed by PBS and permeabilized with 0.5% Triton X-100 (Cat. #T8200, Solarbio) for 15 min. The cells were treated with 3% BSA/PBS for blocking for 1 hour at room temperature, then cells were incubated by α-SMA-specific antibody (Cat. #A2547, dilution 1:200, Sigma), FAP-specific antibody (Cat. #ab207178, dilution 1:200, Abcam, Cambridge, MA, USA), β-catenin (Cat. #8480S, dilution1:200, CST, Danvers, MA, USA), and CD143 (Cat. #ab254222, dilution 1:30, Abcam) overnight at 4°C. Furthermore, sections were incubated with Alexa Fluor 488/594-conjugated secondary antibody (Fdbio science, Hangzhou, Zhejiang, China) for 1 hour at room temperature. Finally, sections were counterstained with 40,6-diamidino-2-phenylindole (DAPI; G1012, Servicebio). Sections were imaged with NIKON digital sight DS-FI2 (NIKON Eclipse ci, Konan, Minato-ku, Tokyo, Japan). Cells were analyzed in at least 5 randomly selected high-power fields.
For tissue staining, paraffin-embedded tissues were stained by CD31-specific antibody (Cat. #GB11063-2, dilution 1:1000, Servicebio), α-SMA-specific antibody (Cat. #GB13044, dilution 1:500, Servicebio), GAS1-specific antibody (Cat. #17903-1-AP, dilution 1:2000, Proteintech, Wuhan, Hubei, China) and CD143-specific antibody (Cat. #ab254222, dilution 1:1000, Abcam). Two investigators blinded to the nature of the samples independently evaluated the slides.
2.18 RNA extraction and qRT-PCR
RNA was extracted from CAFs using 1 mL RNAiso Plus reagent (Cat. #9108, Takara). Total RNA was reversely transcribed using Prime-Script RT reagent Kit (Cat. #RR047A, Takara). qRT-PCR was performed using SYBR Premix Ex Taq (RR820A, Takara) in the Light Cycler480 Real-Time PCR System (Roche) using cDNA. Each reaction was performed in triplicate in 10 μL reactions containing SYBR Premix Ex Taq (Cat. #RR820A, Takara), primers and 200 ng template cDNA. Three replicates were performed. cDNA was amplified by PCR under the following condition: 95°C for 2 min, followed by 40 cycles of 95°C for 15 seconds and 60°C for 30 seconds. The human primers of CD143, GAS1, Tcf4, Axin2, Cyclin D1, and c-Myc used are listed in Supplementary Table S6. Relative mRNA expression was calculated using comparative cycle method (2−ΔΔCt). Β-ACTIN was used as an internal control for human tissues.
2.19 Western blot
CAFs were homogenized in RIPA buffer (R0010, Solarbio). The homogenate was centrifuged at 4°C for 15 min at 15,000 g and then the supernatant was collected. Protein concentration was quantified with BCA protein assay kits (PC0020, Solarbio). Proteins were separated by 10% SDS polyacrylamide gels, and then transferred onto PVDF membranes. The membranes were blocked with 5% skimmed milk for 1 hour and then immunoblotted with CD143-specific antibody (Cat. #ab254222, dilution 1:1000, Abcam), GAS1-specific antibody (Cat. #17903-1-AP, dilution 1:1000, Proteintech), Cyclin D1 (Cat. #2978T, dilution 1:1000, CST), c-Myc (Cat. #5605S, dilution 1:1000, CST) and β-catenin (Cat. #8480S, dilution 1:1000, CST) at 4°C overnight. Membranes were then incubated with secondary antibodies conjugated with HRP (dilution1:10000, Abcam) at room temperature for 1 hour and bands were visualized using an ECL kit (FD8000, Fdbio science, Hangzhou, Zhejiang, China). β-actin, GAPDH, or lamin B was used as loading control.
2.20 Flow cytometry analysis
Tumor or normal colon tissue cells were digested into single cell as the method mentioned above, cells were subsequently counted, and the surface of the cells were stained for 30 min at room temperature using Fixable viability stain 510 (564406, 2 μg/mL, BD Biosciences, Franklin Lake, New Jersey, USA), FITC-EPCAM (Cat. #324203, 9C4, 1 μg/mL, Biolegend, San Diego, CA, USA), PERCP-CY5.5-CD31(Cat. #303131, WM59, 1 μg/mL, Biolegend), APC-hFAP (Cat. #FAB3715A-025, R&D, Emeryville, CA, USA) were used for surface staining. Subsequent analysis was performed with FlowJo software (Tree Star Inc., San Carlos, CA, USA).
2.21 Chromatin immunoprecipitation-quantitative PCR (CHIP-qPCR)
CHIP-qPCR assay in CAFs was performed with Pierce ChIP Kit, Agarose (Cat. #26156, Thermo Fisher Scientific, Waltham, MA, USA) according to the manufacturer's instructions. Briefly, crosslinking was performed by 1% formalin, and Micrococcal Nuclease (ChIP Grade) was used to fragment the DNA. ChIP for TCF4 was performed using a TCF4 antibody (Cat. #2565, dilution 1:50, CST). Eluted DNA fragments were analyzed by qPCR. We Predicted TCF binding sites in the promoter region of GAS1 in online translatory predictor datasets JASPAR (http://jaspar.genereg.net/) and the primers are listed in Supplementary Table S6.
2.22 Transcription factor analysis on UCSC and JASPAR database
To explore the regulatory mechanism of GAS1 expression, we analyzed the GAS1 promoter using the UCSC genome website [32] and JASPAR database [33]. UCSC genome website is referred to http://genome.ucsc.edu/, while JASPAR database is referred to http://jaspar.genereg.net/.
2.23 The Cancer Genome Atlas (TCGA) and GTEx analysis
RNA sequencing (RNA-seq) data level of 355 normal tissues from GTEx dataset and 380 colon carcinomas from The Cancer Genome Atlas (TCGA) were accessed from the UCSC Xena public data hub (University of California, https://xena.ucsc.edu). The RNA-seq gene expression was normalized as RSEM norm_count. Inclusion criteria from TCGA TARGET GTE cohort was set as sample type (normal tissue, solid tissue normal, and primary tumor) and primary site (colon and rectum). Data were analyzed with the GraphPad Prism 7.0 (GraphPad Software, San Diego, CA, USA), R (version 3.6.1) and R Bioconductor packages. Mann-Whitney test was conducted to compare normal tissues and colon carcinomas groups.
2.24 Fluorescence in situ hybridization (FISH) assay
Detection of B.a was performed by FISH on formalin-fixed paraffin-embedded (FFPE) section of CRC tumor tissue as described previously [34]. The sequence of B.a targeted probe is5’-CCGATAGAATCTTTCCCAGAAGG-3’was synthesized by Guangzhou EXON Biological Technology Co. China.
2.25 Statistical analysis
Paired or unpaired Student's t test was used to compare data from two groups while Mann Whitney test for two groups with non-normal distribution. One-way ANOVA test was calculated to compare data from three groups while Kruskal-Wallis test for three groups with non-normal distribution. Survival analysis was performed using the Kaplan-Meier method. All experiments were repeated three times, unless specified otherwise. A P value < 0.05 was considered statistically significant. Statistical analyses were performed using GraphPad Prism 5.04 software (GraphPad Software, Inc., La Jolla, CA, USA) and SPSS 19.0 for Windows (SPSS Inc., Chicago, IL, USA).
3 RESULTS
3.1 B.a was decreased in CRC patients and suppressed tumorigenesis in mice
We examined the fecal B.a abundance in healthy populations and patients with CRC (cohort 1). qRT-PCR showed fecal B.a abundance was significantly lower in CRC patients than that in the healthy controls (Figure 1A). In addition, we found that B.a abundance was decreased in tumor tissues compared to their adjacent normal mucosa (cohort 2) (Figure 1B, Supplementary Figure S1A). Consistently, the GMrepo database indicated that fecal B.a abundance in CRC patients was significantly lower as compared to healthy individuals (Figure 1C). These results suggested that the abundance of B.a was decreased in CRC patients.
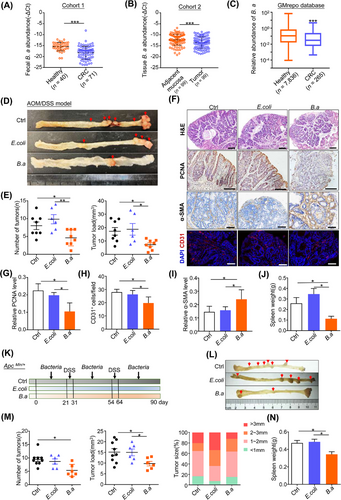
We then evaluated the effect of B.a in CRC. AOM/DSS-induced carcinogenesis model mimics colonic tumor progression caused by chronic colitis as seen in inflammatory bowel disease (IBD). Six-week-old C57BL/6 mice were injected with AOM (10 mg/kg) at the first week, followed by three cycles of 2.5% DSS and oral administration with B.a or E.coli for 120 consecutive days. B.a supplemented mice had an obvious reduction in tumor number and load as compared with that gavage with E.coli or PBS (Figure 1D,E). The lower expression of proliferative marker (proliferative cell nuclear antigen, PCNA) and tumor angiogenesis marker (CD31) was observed in B.a group (Figure 1F-H). Immunohistochemistry staining of the fibroblast marker (α-SMA) was highly expressed in the tumor from B.a-gavage mice (Figure 1I). The spleen weight showed an obvious decrease in B.a group (Figure 1J).
Six-week-old ApcMin/+ mice were orally gavage with B.a or E.coli for 90 consecutive days including two cycles of 1% DSS administration. We observed consistent tumor-suppressive effect of B.a in ApcMin/+ spontaneous tumor mice (Figure 1K-N, Supplementary Figure S1B,C). Collectively, our results indicated that B.a could suppress ApcMin/+ spontaneous and AOM/DSS-induced tumorigenesis in mice.
3.2 B.a recruited fibroblasts to suppress colonic tumorigenesis
To explore the tumor infiltrating cells during CRC progression, we analyzed cell populations identified from AOM/DSS-induced colon tumors by scRNA-seq (Figure 2A). We obtained 14,736 cells and unsupervised graph clustering divided infiltrating cells into 24 groups based on gene expression pattern (Figure 2B,C). Furthermore, we labeled cell subsets with canonical markers and divided them into 6 groups including B cells, endothelial cells, cancer cells, fibroblast cells, myeloid cells, and T cells, which were plotted in t-SNE (Figure 2D-F, Supplementary Figure S2). A total of 4,898 cells were classified into myeloid populations, accounting for 33.23% of the total cells. B.a supplement obviously increased fibroblast cells (72.14%) while decreased B cells (30.22%; Figure 2G). Biological function and cell-cell interaction network in the main 6 cell types were shown in Supplementary Figure S3 by iTALK R packages, which demonstrated the microbiota might regulate the TME in CRC by regulating cell-cell interaction. These results indicated that fibroblast cells were involved in the effect of B.a in CRC.
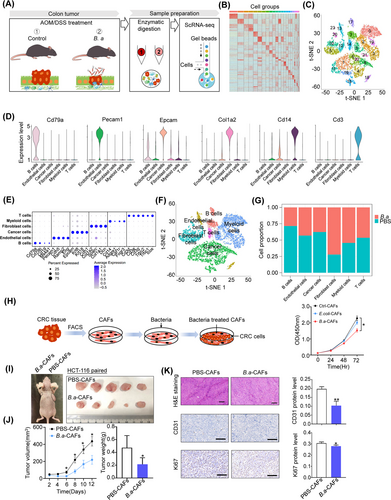
To confirm whether fibroblasts mediate the tumor suppressive effect of B.a in vitro, we identified CAFs separated from CRC patients by western blot, immunofluorescence, and flow cytometry (Supplementary Figure S4). CAFs were then incubated with B.a or E.coli for 48 h, and co-cultured with HCT-116 cells. We examined that the proliferation and apoptosis of CAFs was not influenced after co-culturing with B.a (Supplementary Figure S1D,E). We found that B.a-treated CAFs significantly inhibited CRC cell proliferation compared with the E.coli or PBS control groups (Figure 2H). To confirm whether B.a-treated CAFs suppressed the tumor growth in vivo, we mixed the HCT-116 CRC cells and CAFs with or without B.a treatment and co-injected into the nude mice. We observed that B.a-treated CAFs had an obvious growth inhibitory effect. The reduction of cell proliferative and angiogenesis ability was verified by the immunohistochemistry staining with Ki67 and CD31 (Figure 2I-K). Collectively, these data demonstrated that B.a-treated CAFs suppressed tumorigenesis in vivo and in vitro.
3.3 CD143+ CAFs was activated by B.a and then reshaped TME
As B.a treatment induced more functional CAFs in CRC progression, we proposed that these distinctive CAFs might present with specific molecular signatures. We further analyzed the CAFs subsets by scRNA-seq and found that unsupervised graph clustering divided CAFs into 12 groups (Figure 3A,B). Furthermore, we used conventional fibroblast markers and other surface markers to distinguish them and acquired 5 CAF subsets including C1 (PDGFRβ+ CAFs), C2 (collagen I+ CAFs), C3 (MYH11+ CAFs), C4 (CD143+ CAFs), and C5 (CD36+ CAFs) (Figure 3C, Supplementary Figure S5). Combining with the t-SNE result, we found that the subset C4 (CD143+ CAFs) was mainly located in the B.a-treated group while other subsets failed to distinguish them (Figure 3D,E). These results suggested that B.a could induce the functional CD143+ CAFs in vivo.
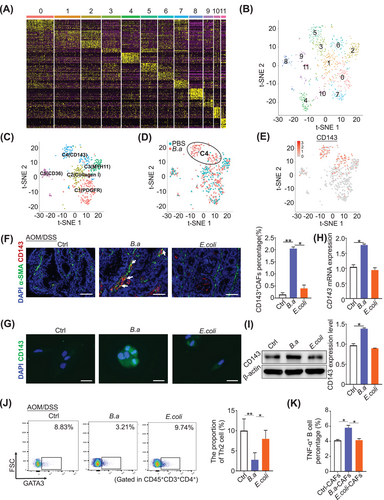
To confirm the existence of CD143+ CAFs, the dual positive of α-SMA and CD143 cells were stained by immunofluorescence assay in the tumor tissues from AOM/DSS model. We observed an increase of CD143+ CAFs in the B.a treated group compared to the E.coli or PBS control group (Figure 3F). We further explored the percentage of total CAFs (Epcam− CD31− FAP+) and CD143+ CAFs (Epcam− CD31− FAP+ CD143+) by flow cytometry. CRC tissues had more CAFs while less CD143+ CAFs than their paired normal tissues (Supplementary Figure S6A,B). In addition, the B.a-treated CAFs induced more CD143+ CAF cells in the tumor tissues from nude mice (Supplementary Figure S6C). To explore whether B.a could induce the CD143+ CAFs in vitro, we co-cultured the CAFs with B.a or E.coli for 48 h. We observed that B.a increased the expression level of CD143 in CAFs compared with E.coli or PBS control group by immunofluorescence, western blot, and qRT-PCR assays (Figure 3G-I). Taken together, these results revealed that B.a could recruit the subset CD143+ CAFs in vivo and in vitro.
There was crosstalk between CD143+ CAFs and T cells or B cells by scRNA-seq (Supplementary Figure S7). Furthermore, we found B.a inhibited the infiltration of Th2 cells in the tumor tissue of AMO/DSS model by flow cytometry in vivo, and promoted the proportion of TNF-α+ B cells compared to the E.coli or PBS-treated CAFs in vitro. These data indicated that B.a or CD143+ CAFs might reshape the tumor immune microenvironment to suppress CRC (Figure 3J,K).
3.4 CD143+ CAFs was highly expressed with GAS1 in response to B.a treatment
To explore how CD143+CAFs inhibit CRC progression, we performed differential gene analysis between the PBS and B.a groups in AOM/DSS-treated mice. We found that GAS1 increased in the B.a supplement group, and GAS1 mainly expressed in the CD143+CAFs subset (Figure 4A,B). The expression of GAS1 in CD143+ CAFs had 8-fold increase compared to the CD143−CAFs (Figure 4C, Supplementary Figure S7C-D). We also found the cytokines of Ccl2, Cxcl12, and Cxcl13 increased, while Il6, Il11, Ccl7, Ccl11, Cxcl1, and Cxcl14 decreased in the CD143+ CAFs (Supplementary Figure S7C). Furthermore, we observed more α-SMA+ GAS1+ cells in the B.a-treated group (Figure 4D).
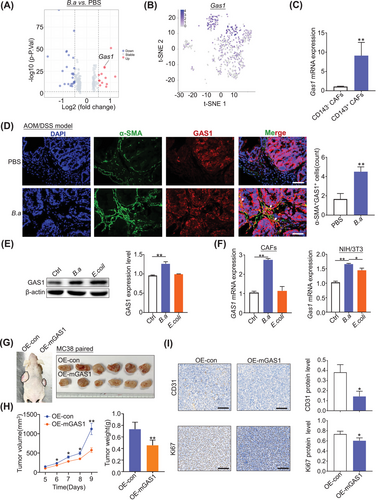
To confirm that B.a increased the expression of GAS1 in CAFs in vitro, we co-cultured CAFs with B.a or E.coli for 48 h. Results demonstrated that B.a upregulated the expression of GAS1both in the CAFs and NIH/3T3 cells (Figure 4E,F). These data suggested that B.a treatment induced CD143+ CAFs to highly express with GAS1. To investigate the suppressive function of GAS1 in CAFs on CRC, we acquired the GAS1-overexpressed NIH/3T3 cells (Supplementary Figure S8A). We found that overexpression of GAS1 in NIH/3T3 cells efficiently inhibited the growth of MC38 cells in the nude mice (Figure 4G-I), which suggest that GAS1+ CAFs existed a suppressive effect in CRC.
3.5 Wnt/β-catenin signaling was involved in the induction of CD143+ CAFs by B.a
To explore the regulatory mechanism of GAS1 expression, we analyzed the online transcription factor predictor datasets of UCSC and JASPAR. Fourteen transcription factors were collected according to these 2 datasets merged files (Figure 5A). We narrowly analyzed the transcription factors of the 5 CAFs subsets and found the expression of TCF4 and NFKB1wassignificantly increased in the group C4 (CD143+ CAFs) (Figure 5B). We found that the protein level of NF-κB pathway molecule p-p65 was not changed in B.a-treated CAFs but decreased in the AOM/DSS-induced tumor tissues treated by B.a (Supplementary Figure S8B,C). To investigate whether TCF4-binding domains was in GAS1 promoter regions, we performed the CHIP-qPCR in B.a-treated CAFs. GAS1signal was upregulated to 8-fold change compared to the IgG control (Figure 5C), which suggesting the enrichment of TCF4 binding to the GAS1 promoter regions in B.a-treated CAFs. The predictor of C4 subset by KEGG pathway also confirmed that Wnt pathway was activated in the CD143+ CAFs (Figure 5D). As the KEGG analyses indicating the transforming growth factor (TGF) pathway, we detected TGF-β pathway and found the expression of TGF-βhad no significant difference in the tumor tissues between PBS group and B.a group or between PBS and B.a-treated CAFs (Figure 5E, Supplementary Figure S8D).
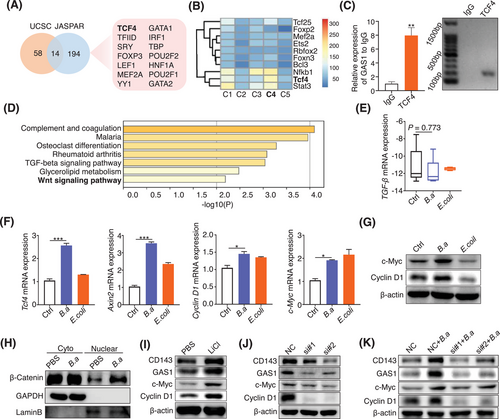
We found that the Wnt/β-catenin downstream genes of Tcf4, Axin2, Cyclin D1, and c-Myc increased in the B.a-treated CAFs (Figure 5F). The increased expression level of c-Myc and CyclinD1 was confirmed by western blot analysis in the B.a group (Figure 5G). In contrast, B.a did not influence the expression of cyclin D1 and AXIN2 on the HCT-116 CRC cells (Supplementary Figure S8E).
The induction of nuclear β-catenin translocation indicated that Wnt/β-catenin pathway was activated by B.a in the CAFs (Figure 5H). We proposed that GAS1 and CD143 are the downstream of the Wnt/β-catenin signaling. We found that LiCl (20 mmol/L), the Wnt signaling agonist, increased the expression level of GAS1, CD143, and Wnt downstream targets c-Myc and CyclinD1 (Figure 5I). To investigate whether Wnt/β-catenin signaling pathway was activated by TCF4 in B.a-treated CAFs, we performed the TCF4 deficient assay (Supplementary Figure S8F). We observed that knockdown of TCF4 obviously inhibited the expression of GAS1 and CD143 by western blot assay and attenuated the activation of Wnt/β-catenin pathway by B.a in CAFs (Figure 5J,K). These data indicated that Wnt/β-catenin signaling was involved in CD143+ CAFs induction by B.a in vitro.
To investigate the mechanism of how B.a regulate the CAFs, we co-cultured the live-B.a, heated-B.a (H-B.a) or pasteurized-B.a (P-B.a) with CAFs. We found that both live and pasteurized-B.a co-culture enhanced the expression of CD143, GAS1, and Wnt pathway protein of c-Myc, Cyclin D1 compared to the PBS control group. Meanwhile, administration with B.a CM did not affect the expression of above-mentioned proteins compared to the RCM control (Supplementary Figure S8G,H). These results suggested that the effect protein from B.a was the most likely composition responsible for the activated Wnt/β-catenin.
3.6 CD143+ CAFs predicated better survival in CRC patients and B.a abundance was correlated with the expression of CD143 and GAS1
We further evaluated clinical association between B.a, CD143, and GAS1. We defined 2 groups with low or high abundance of B.a in the CRC tissues of cohort 3 by the genome DNA level and found the abundance of B.a was related to the mRNA expression level of CD143 (Figure 6A). The high B.a abundance group enriched more percentage of CD143+ CAFs by flow cytometry assay (Figure 6B). CD143 level was decreased in the late-stage tumors of cohort 2 (Figure 6C). The relative expression of GAS1 was reduced in cancer tissues compared with the normal tissue (cohort 2 and TCGA dataset; Figure 6D,E). The high B.a abundance group had a relative high level of GAS1 mRNA expression (cohort 2 and cohort 3; Figure 6F,G). The abundance of B.a was associated with higher α-SMA+ CD143+ or α-SMA+ GAS1+ cells in cancer tissues, as determined by immunofluorescence staining (cohort 2; Figure 6H).
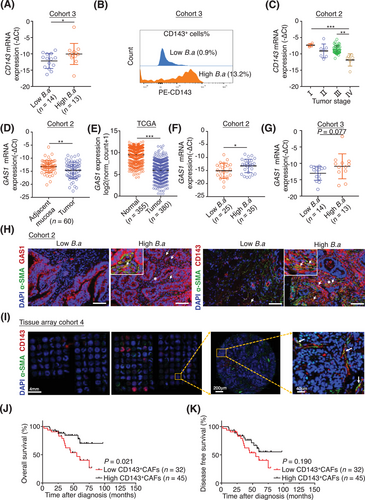
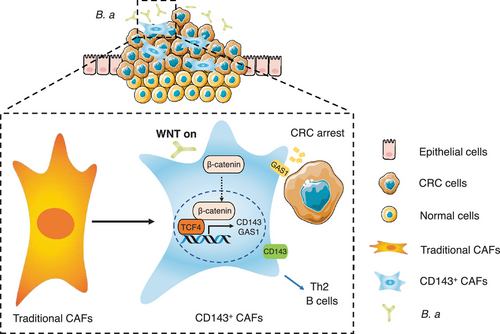
We examined the number of α-SMA+ CD143+ cells in 77 patients with CRC (cohort 4). Results showed that the overall survival percentage was increased in the high number of α-SMA+ CD143+ cells group (Figure 6I-K), which suggested the subset of CD143+ CAFs could be a promising marker to predicate a better survival outcome. Based on the collective data, we concluded that a new subset CD143+ CAFs induced by B.a highly expressed GAS1 to suppress CRC tumorigenesis in the TME, which was regulated by Wnt/β-catenin signaling (Figure 7).
4 DISCUSSION
Studies demonstrated that some specific bacteria regulated the TME in the progression of CRC and exerted a promising therapeutic function [35]. Herein, we identified that B.a suppressed colonic tumorigenesis and induced CD143+ CAFs with highly expressed GAS1 through Wnt/β-catenin pathway. scRNA-seq revealed that B.a treatment recruited more CAFs in the tumor tissues. Studies suggested that different fibroblast subsets exerted opposite functions in cancer progression [36]. CAFs can promote tumor progression through a variety of mechanisms, such as secreting cytokines and exosomes to mediate intercellular communication, inducing tumor cell epithelial-mesenchymal transition, promoting blood vessel formation, and immune escape [25]. However, certain CAFs subgroups inhibit tumorigenesis. Non-selective CAFs deletion in pancreatic tumor could promote cancer angiogenesis [37]. Meflin+ CAFs surrounded the pancreatic tumor inhibited the cancer progression [38]. The decreased CD68+ CAFs were related with the infiltration of regulatory T cells in oral carcinoma with poor prognosis [39].
Recent studies suggest that CAFs are heterogeneous and contain different subpopulations with distinct phenotypes and functions [40, 41]. The heterogeneity of CAF subsets is tumor-type dependent. Oral squamous cell carcinoma can be divided into normal fibroblasts (CAF-N) and divergent fibroblasts (CAF-D) [42]. The CAFs of breast cancer were divided into matrix CAFs (mCAF), developmental CAFs (dCAF), vascular CAFs (vCAF), and cycling CAFs (cCAF) by scRNA-seq [43]. The definition of CAFs is generally based on the markers of α-SMA, fibroblast activation protein (FAP), platelet-derived growth factor (PDGFRβ) and so on [25]. Cancer-restraining CAFs in CRC, such as Gli1+ and Islr+ CAFs, had been reported [44-46]. Recently, studies discovered new tumor defenders CAFs like Axin2+ CAFs, CD146+ CAFs, and CAV1+ CAFs [47, 48]. Our study discovered 5 subsets of CAFs, including C1(PDGFRβ+ CAFs), C2(collagen I+ CAFs), C3(MYH11+ CAFs), C4(CD143+ CAFs), C5(CD36+ CAFs). The new subset CAFs expressing CD143 was specifically activated by B.a in vivo and in vitro. CD143 is the angiotensinase, which is expressed in endothelial cells [49] and dendritic cells [50]. Whether CD143+ CAFs is similar with the traditional CAFs needs to be further explored.
GAS1 is located on the membrane of cells and belongs to the glial cell-derived neurotrophic factor ligand (GDNF) family α receptor (GFRα), expressed in a variety of epithelial cells and fibroblasts [51]. GAS1 was determined as a negative regulator of oncogenesis and metastasis in CRC. Mechanistically, GAS1 negatively regulated the aerobic glycolysis, a process that contributed to tumor progression and metastasis [52]. However, the role of GAS1 on CAFs is still unclear. Our study demonstrated that the CD143+ CAF subset highly expressed GAS1 compared with the CD143− CAF subset. Therefore, the GAS1 highly expressed CD143+ CAF subset might be a new predictive marker or a therapeutic target for CRC. The expression level of GAS1 was increased in the CD143+ CAFs compared to in the CD143− CAFs. The cytokines of Ccl2, Cxcl12, and Cxcl13 increased, while Il6, Il11, Ccl7, Ccl11, Cxcl1, and Cxcl14 decreased in the CD143+ CAFs (Supplementary Figure S7C). Whether these changed cytokines and chemokines mediated the suppressed effect of CD143+ CAFs on CRC need more experiment exploration. GAS1 was thought to be expressed on the cell membrane and released into the intercellular space. We supposed that GAS1+ CD143+ CAFs might directly contact CRC cells, thus inducing cancer cell growth arrest.
Recent studies have revealed a variety of upstream signals that regulate the CAFs differentiation [47]. Blocking the TGF-β signal in the breast cancer microenvironment could promote the formation of immunoregulatory fibroblast subpopulations [53]. The granular protein from liver macrophages activated liver fibroblasts [54]. A previous study showed that GAS1 is induced by WNTs [55]. Our study revealed that TCF4 might be the transcription factor to activate GAS1. Wnt/β-catenin signaling involves in the induction of CD143+ CAFs by B.a in vitro. Wnt signal in different cells plays completely different roles. Mutation-induced activation of Wnt/β-catenin signaling is a frequent driver event in human cancer [56]. Wnt signal activation in CAFs of colon cancer can promote the contact of CAFs with cancer cells and inhibit epithelial-mesenchymal transition [47]. Previous studies reported Wnt/β-catenin signaling could be regulated by different bacteria stimuli, such as Annexin A1, produced by Fusobacterium nucleatum [6] or TcdB secreted by Clostridium difficile [57]. Butyrate from bacteria were found suppressing CRC cells proliferation by autophagy-mediated degradation of β-catenin [58]. We observed that live-B.a and pasteurized-B.a groups increased the expression of CD143, GAS1, and Wnt pathway proteins compared to heated-B.a groups (Supplementary Figure S8G,H), indicated that the effect protein from B.a was the most likely composition responsible for the activated Wnt/β-catenin.
This study has some limitations. Firstly, we analyzed the different gene expression between CD143+ CAFs and CD143− CAFs and the efficient cytokines released by CD143+ CAFs were not well explored in the study. These two cell subsets were not well isolated by flow cytometry in vivo or in vitro. Thus, further studies are required to obtain a more comprehensive understanding. Secondly, we proposed the effect protein from B.a was the most likely composition responsible for the activated Wnt/β-catenin. However, the exact functional molecule which B.a activating Wnt/β-catenin need further exploration.
5 CONCLUSIONS
We found a new subset CD143+ CAFs with highly expressed GAS1in the TME induced by B.a, which was regulated by Wnt/β-catenin signaling. Our work provided evidence for a probiotic role of B.a in CRC, which could be harnessed to regulate TME homeostasis for CRC.
DECLARATIONS
AUTHOR CONTRIBUTIONS
Shujie Chen analyzed data, drafted, and revised the manuscript. Lina Fan performed the experiments, analyzed data, and drafted the manuscript. Yifeng Lin performed experiments and analyzed data. Yadong Qi performed the database analysis. Chaochao Xu, Lan Wang, and Qiwei Ge collected human samples. Ying Zhang, Qiwen Wang, and Dingjiacheng Jia collected the data. Jianmin Si revised and commented the manuscript. Liangjing Wang designed, supervised the study, and revised the manuscript. All authors read and approved the final manuscript.
ACKNOWLEDGMENTS
We are grateful to Dr. Wei Liu (Zhejiang Academy of Agricultural Sciences) for providing the culture method of B.a.
COMPETING INTERESTS
The authors declare that they have no competing interests.
FUNDING
This work was supported by the National Natural Science Foundation of China (82072623, 82270573, and 82203618), Zhejiang Province Natural Science Foundation (LZ22H160002), and Zhejiang Province Medicine and Health Science and Technology Project (2023KY722 and 2023KY785).
CONSENT FOR PUBLICATION
Not applicable.
ETHICS APPROVAL AND CONSENT TO PARTICIPATE
All samples were coded in accordance with local ethical guidelines, written informed consent was obtained, and Clinical Research Ethics Committee of the Sir Run Run Shaw Hospital and the Second Affiliated Hospital, Zhejiang University School of Medicine approved the protocol (20211103-35). All animal studies were approved by the Institutional Animal Care and Use Committee (IACUC) of Zhejiang University (ZJU; IACUC-02102214).
Open Research
AVAILABILITY OF DATA AND MATERIALS
The data generated in this study are publicly available in Genome Sequence Archive (GSA) at GSA: CRA008214.


