SDCBP-AS1 destabilizes β-catenin by regulating ubiquitination and SUMOylation of hnRNP K to suppress gastric tumorigenicity and metastasis
Jing Han, Menglin Nie and Cong Chen contributed equally to this work.
Abstract
Background
Gastric cancer (GC) is among the most malignant tumors, yet the pathogenesis is not fully understood, especially the lack of detailed information about the mechanisms underlying long non-coding RNA (lncRNA)-mediated post-translational modifications. Here, the molecular mechanisms and clinical significance of the novel lncRNA syndecan-binding protein 2-antisense RNA 1 (SDCBP2-AS1) in the tumorigenesis and progression of GC were investigated.
Methods
The expression levels of SDCBP2-AS1 in 132 pairs of GC and adjacent normal tissues were compared, and the biological functions were assessed in vitro and in vivo. RNA pull-down and immunoprecipitation assays were conducted to clarify the interactions of SDCBP2-AS1 and heterogeneous nuclear ribonucleoprotein (hnRNP) K. RNA-sequencing, immunoprecipitation, immunofluorescence, and luciferase analyses were performed to investigate the functions of SDCBP2-AS1.
Results
SDCBP2-AS1 was significantly downregulated in GC tissues and predictive of poor patient prognosis. Silencing of SDCBP2-AS1 promoted the proliferation and migration of GC cells both in vitro and in vivo. Mechanically, SDCBP2-AS1 physically bound to hnRNP K to repress SUMOylation of hnRNP K and facilitated ubiquitination of hnRNP K and β-catenin, thereby promoting the degradation of β-catenin in the cytoplasm. Silencing of SDCBP2-AS1 caused SUMOylation of hnRNP K and stabilized β-catenin activity, which altered transcription of downstream genes, resulting in tumorigenesis and metastasis of GC. Moreover, the knockdown of hnRNP K partially abrogated the effects of SDCBP2-AS1.
Conclusions
SDCBP2-AS1 interacts with hnRNP K to suppress tumorigenesis and metastasis of GC and regulates post-transcriptional modifications of hnRNP K to destabilize β-catenin. These findings suggest SDCBP2-AS1 as a potential target for the treatment of GC.
Abbreviations
-
- APC
-
- adenomatous polyposis coli
-
- β-TrCP
-
- β-transducin repeat-containing protein
-
- CHX
-
- cycloheximide
-
- CI
-
- confidence interval
-
- CTNNB1
-
- catenin beta 1
-
- DFS
-
- disease-free survival
-
- EPDR1
-
- ependymin-related 1
-
- FISH
-
- fluorescence in situ hybridization
-
- GAPDH
-
- glyceraldehyde 3-phosphate dehydrogenase
-
- GC
-
- gastric cancer
-
- TCGA
-
- Cancer Genome Atlas-Stomach Adenocarcinoma
-
- GEPIA
-
- gene expression profiling interactive analysis
-
- GSEA
-
- gene set enrichment analysis
-
- GSK3β
-
- glycogen synthase kinase 3 beta
-
- H3
-
- histone 3
-
- HA
-
- hemagglutinin
-
- H&E
-
- hematoxylin and eosin
-
- hFAST
-
- human Fas-activated serine/threonine kinase
-
- hnRNP K
-
- heterogeneous nuclear ribonucleoprotein K
-
- HOXA11-AS
-
- homeobox A11 antisense RNA
-
- HR
-
- hazard ratio
-
- IF
-
- immunofluorescence
-
- IgG
-
- immunoglobulin G
-
- IHC
-
- immunohistochemical
-
- IP
-
- immunoprecipitation
-
- lncRNA
-
- long non-coding RNA
-
- MMP7
-
- matrix metallopeptidase 7
-
- NT
-
- non-target
-
- OC
-
- ovarian cancer
-
- OS
-
- overall survival
-
- PVT-1
-
- Pvt1 oncogene
-
- RACE
-
- rapid amplification of cDNA ends;
-
- RIP
-
- RNA Immunoprecipitation
-
- RT-qPCR
-
- quantitative real-time polymerase chain reaction
-
- SDCBP2
-
- syndecan binding protein 2
-
- SDCBP2-AS1
-
- SDCBP2 antisense RNA 1
-
- SDS-PAGE
-
- sodium dodecyl sulfate-polyacrylamide gel electrophoresis
-
- SLCO4A1-AS1
-
- solute carrier organic anion transporter family member 4A1 antisense RNA 1
-
- SNHG5
-
- small nucleolar RNA host gene 5
-
- SUMO-1
-
- small ubiquitin-like modifier 1
-
- UCA1
-
- urothelial cancer associated 1
1 BACKGROUND
Gastric cancer (GC) is a major cause of cancer-related death worldwide, although its incidence varies across different geographical regions [1, 2]. Despite standardized treatments have improved patients survival in the last decade, the 5-year survival rate remains low [3]. Early detection can largely promote the 5-year survival rate; however, due to the lack of effective diagnostic and therapeutic strategies, more than 80% GC patients in China had advanced diseases at the time of diagnosis, and the 5-year survival rate is less than 20% [4, 5]. Hence, novel biomarkers and therapeutic targets are urgently needed for the diagnosis and prognosis prediction of GC to reduce mortality.
Long non-coding RNAs (lncRNAs) are important RNA transcripts longer than 200 nucleotides with limited or no protein-coding capacity [6, 7]. lncRNAs are crucial to various biological processes, especially tumorigenesis and metastasis [8-11]. However, the specific molecular pathogenic mechanisms of lncRNAs underlying the initiation and progression of GC remain unclear.
Wnt/β-catenin signaling controls several fundamental cell functions, such as proliferation, differentiation, migration, and stemness. It therefore plays a critical role in the gastrointestinal epithelial homeostasis. Even for GC, a highly heterogeneous disease with phenotypic diversity, the dysregulation of Wnt/β-catenin signaling pathway still has been observed in approximately 50% of GC patients [12, 13]. β-catenin, the prime effecter of canonical Wnt signaling, contributes to tumor progression by enhancing the proliferation and invasiveness of GC cells [14, 15]. Activation of the canonical Wnt/β-catenin signaling pathway is dependent on controlling the accumulation of β-catenin in the cytoplasm and its translocation into the nucleus to regulate the transcription of downstream genes. Regulation of cytoplasmic β-catenin is controlled by targeting phosphorylated β-catenin to the proteosomes for degradation via E3 ubiquitin ligase, resulting in low concentrations of cytoplasmic β-catenin [16]. However, the relative importance of temporal activation of β-catenin and its crosstalk with lncRNAs is not well understood.
Our group has previously identified a collection of candidate lncRNAs, including syndecan-binding protein 2-antisense RNA 1 (SDCBP2-AS1), involved in the GC progression [17]. In continuation, the present study aimed to investigate the molecular mechanism of SDCBP2-AS1 in mediating the transcription, stability, and transactivation of β-catenin in the development of GC and to explore potential prognostic implications.
2 MATERIALS AND METHODS
2.1 Clinical samples
A total of 132 GC tumor tissues and paired adjacent normal tissues were obtained from GC patients via radical resection conducted at the Peking University Cancer Hospital (Beijing, China) between January 2007 and December 2010. None of the patients received chemotherapy or radiotherapy before surgery, and all were followed up until March 2016. All subjects provided informed consent for the use of specimens in this study. The study protocol was approved by the Ethics Committee of Peking University Cancer Hospital (approval number: 2018KT07) and conducted in accordance with the ethical principles for medical research involving human subjects described in the Declaration of Helsinki. After resection, the tissues were snap-frozen in liquid nitrogen and then stored at −80°C prior to RNA extraction. Detailed information of the patients is provided in Table 1. The tumor-node-metastasis (TNM) stage of GC was determined in accordance with the Cancer Staging Manual of the American Joint Committee on Cancer (8th edition). Overall survival (OS) was calculated from the date of surgery to the date of death due to any reason, while disease-free survival (DFS) was defined as the duration from the date of surgery to the date of death or recurrence of any complications during follow-up. Patients without an endpoint (progression or death) were censored at the date of the last follow-up.
| Expression of SDCBP2-AS1 [cases (%)] | ||||
|---|---|---|---|---|
| Characteristic | Total [cases (%)] | Low | High | P |
| Total | 132 | 73 (55.3) | 59 (44.7) | |
| Gender | 0.019 | |||
| Male | 88 (66.7) | 55 (62.5) | 33 (37.5) | |
| Female | 44 (33.3) | 18 (40.9) | 26 (59.1) | |
| Age (years) | 0.145 | |||
| ≤60 | 69 (52.3) | 34 (49.3) | 35 (50.7) | |
| >60 | 63 (47.7) | 39 (61.9) | 24 (38.1) | |
| Tumor location | 0.748 | |||
| Cardiac | 34 (25.8) | 18 (52.9) | 16 (47.1) | |
| Non-cardiac | 98 (74.2) | 55 (56.1) | 43 (43.9) | |
| Tumor diameter | 0.016 | |||
| ≤4 cm | 63 (47.7) | 28 (44.4) | 35 (55.6) | |
| >4 cm | 69 (52.3) | 45 (65.2) | 24 (34.8) | |
| Pathological type | 0.033 | |||
| Adenocarcinoma | 103 (78.0) | 62 (60.2) | 41 (39.8) | |
| Signet-ring cell carcinoma and others | 29 (22.0) | 11 (37.9) | 18 (62.1) | |
| Histologic differentiation | 0.077 | |||
| Well or moderate | 67 (50.8) | 32 (47.8) | 35 (52.2) | |
| Poor | 65 (49.2) | 41 (63.1) | 24 (36.9) | |
| Vascular invasion | 0.293 | |||
| Absent | 56 (42.4) | 28 (50.0) | 28 (50.0) | |
| Present | 76 (57.6) | 45 (59.2) | 31 (40.8) | |
| Depth of invasion | 0.137 | |||
| T1-2 | 22 (16.7) | 9 (40.9) | 13 (59.1) | |
| T3-4 | 110 (83.3) | 64 (58.2) | 46 (41.8) | |
| Lymphatic metastasis | <0.001 | |||
| No | 31 (23.5) | 7 (22.6) | 24 (77.4) | |
| Yes | 101 (76.5) | 66 (65.3) | 35 (34.7) | |
| Distant metastasis | 0.036 | |||
| M0 | 123 (93.2) | 65 (52.8) | 58 (47.2) | |
| M1 | 9 (6.7) | 8 (88.9) | 1 (11.1) | |
| pTNM stage | <0.001 | |||
| I-II | 55 (41.7) | 20 (36.4) | 35 (63.6) | |
| III-IV | 77 (58.3) | 53 (68.8) | 24 (31.2) | |
- Abbreviations: SDCBP2-AS1, syndecan binding protein 2 antisense RNA 1; GC, gastric cancer.
2.2 Databases and bioinformatics analysis
The coding potential of SDCBP2-AS1 was analyzed using the online tools Open Reading Frame Finder (https://www.ncbi.nlm.nih.gov/orffinder/), Coding Potential Calculator 2 (http://cpc2.gao-lab.org/), Coding-Potential Assessment Tool (http://lilab.research.bcm.edu/cpat/), and LNCipedia (https://lncipedia.org/) [18-21]. Gene Expression Profiling Interactive Analysis (GEPIA) web tool (http://gepia.cancer-pku.cn/) and Asian Cancer Research Group databases (https://consortiapedia.fastercures.org/consortia/acrg/) were used to analyze the correlation between SDCBP2-AS1 and SDCBP2 expression in GC samples. Kaplan-Meier survival plot of DFS and OS of GC patients in the dataset GSE22377 (http://www.ncbi.nlm.nih.gov/geo/geo2r/?acc=GSE22377) was analyzed by the web tool Kaplan-Meier Plotter (http://kmplot.com/analysis/index.php?p=service&cancer=gastric) [22].
2.3 Cell cultures
Human embryonic kidney 293 (HEK293T) cells and human gastric adenocarcinoma hyperdiploid (AGS) cells were obtained from the American Type Culture Collection (Manassas, VA, USA). GC cells (BGC823, SGC7901, MGC803, HGC27, and N87) and normal gastric epithelial (GES-1) cells were obtained from the Shanghai Cell Research Institute (Chinese Academy of Sciences, Shanghai, China). Well-differentiated human gastric adenocarcinoma (MKN28) cells were obtained from the Japanese Collection of Research Bioresources Cell Bank (National Institutes of Biomedical Innovation, Health and Nutrition, Osaka, Japan). All cell lines, which were obtained between 2014 and 2015 and authenticated by short tandem repeat profiling, were cultured in Dulbecco's modified Eagle's medium (DMEM) (Gibco; Invitrogen Corporation, Carlsbad, CA, USA) supplemented with 10% fetal bovine serum (Gibco) and maintained at 37°C in 5% CO2 as previously described [23]. Cells were incubated in serum-free medium and treated with cycloheximide (CHX) (Sigma-Aldrich Pty. Ltd., Merck KGaA, Darmstadt, Germany) for 4 h or MG132 (Sigma-Aldrich) for 8 h as indicated. Routine testing for Mycoplasma contamination was performed using polymerase chain reaction (PCR). Cells were grown for no more than 20 passages prior to experimentation.
2.4 Plasmid construction and establishment of stable cell lines
Full-length cDNA of human SDCBP2-AS1 (2479 bp) was synthesized by Invitrogen Corporation and cloned into the expression vector pcDNA3.0. A series of SDCBP2-AS1 deletion mutants were designed according to the secondary structure of SDCBP2-AS1 predicted from the RNAfold Web Server (http://rna.tbi.univie.ac.at/). Truncations of SDCBP2-AS1 were amplified with appropriate primer sets and subcloned into plasmid pcDNA3.0. Human hnRNP K cDNA (1395 bp) was amplified from GC tissues and subcloned into plasmid p3XFLAG-CMV-10 (Sigma-Aldrich). Truncations of hnRNP K were amplified with appropriate primer sets and subcloned into plasmid p3XFLAG-CMV-10. The hnRNP K K422R mutant was created with the restriction enzyme DpnI and subcloned into plasmid p3XFLAG-CMV-10. Each mutation was verified against the whole hnRNP K cDNA sequence. Human small ubiquitin-like modifier 1 (SUMO-1) cDNA was amplified from GC tissues and subcloned into plasmid pCMV-HA. HA-catenin beta 1 (CTNNB1) was subcloned into vector GV366 (Shanghai Genechem Co., Ltd., Shanghai, China). The final construct was verified by sequencing. Stable SDCBP2-AS1-overexpressing SGC7901 cell line were generated and screened by administration of neomycin (Invitrogen Corporation). Small hairpin RNA (shRNA) against SDCBP2-AS1 was provided by Invitrogen Corporation, and shRNA against hnRNP K was obtained from Shanghai Genechem Co., Ltd. Stable SDCBP2-AS1-knockdown BGC823 and MKN28 cells and hnRNP K-knockdown SGC7901 cells were established with a lentiviral vector in accordance with the manufacturer's instructions. All primers and shRNA sequences are listed in Supplementary Table S1. GC cells were transfected with plasmid vectors or lentiviruses encoding shRNAs using DNA Miniprep Kits [Tiangen Biotech (Beijing) Co. Ltd., Beijing, China] and Lipofectamine 2000transfection reagent (Invitrogen Corporation) following the manufacturer's instructions and screened by administration of puromycin (Invitrogen Corporation). Plasmid p3XFLAG-CMV-10 or the empty vector pCMV-HA was used as an overexpression control (Con), while non-target (NT) shRNA was used as a knockdown control.
2.5 RNA extraction and quantitative real-time PCR (RT-qPCR)
Total RNA was extracted from the tissue samples and cell lines using TRIzol reagent (Invitrogen Corporation) in accordance with the manufacturer's instructions, and reversely transcribed into complementary DNA using a reverse transcription system kit (Invitrogen Corporation) with the ABI PRISM 7500 Sequence Detection System (Applied Biosystems, Foster City, CA, USA) and the SYBR Green method (amplification condition: 95°C for 10 min, followed by 40 cycles at 95°C for 15 s and 60°C for 1 min). For each sample, gene expression was normalized to glyceraldehyde 3-phosphate dehydrogenase (GAPDH) or U6. The primer sequences used for RT-qPCR are listed in Supplementary Table S1. Each RT-qPCR reaction was performed in triplicate, and relative RNA expression was calculated using the 2−ΔΔCt method.
2.6 Rapid amplification of cDNA ends (RACE)
RACE was performed using the SMARTer 5′/3′ RACE kit (Takara Bio Inc., Shiga, Japan) in accordance with the manufacturer's recommendations. Briefly, first-strand cDNA was synthesized with SMARTScribe™ Reverse Transcriptase (RT) and a modified oligo (dT) primer that contained an additional sequence as a primer binding site for downstream 3′ PCR reactions. The SMARTer II A Oligonucleotide, which contained several non-template residues, was annealed to the 5′-end as an additional template for SMARTScribe RT and as a primer binding site for downstream 5′ PCR reactions. The 5′ and 3′ RACE reactions were performed by PCR with the SDCBP2-AS1-specific primer pair SDC5′GSP1/SDC3′GSP1 and the universal primer UPM long (Supplementary Table S1).
2.7 Cell proliferation and colony formation assays
GC cells (3000 cells/well) with stable knockdown of endogenous SDCBP2-AS1 (BGC823 and MKN28) or stable ectopic expression of SDCBP2-AS1 (SGC7901) were seeded into 96-well plates, and cell proliferation was monitored with an IncuCyte® Live-Cell Analysis System (Essen BioScience, Ann Arbor, MI, USA). For the colony formation assay, the established stable cell lines were seeded into 6-well plates at 600 cells/well and incubated at 37°C in 5% CO2 for 14 days. Afterward, they were carefully washed twice with phosphate-buffered saline, fixed with 75% ethyl alcohol for 15 min at 21°C, and stained with 0.1% crystal violet. Washing out the dye and drying, the plates were photographed. The ImageJ software (National Institutes of Health, Bethesda, MD, USA) was used to quantify the colonies containing ≥50 cells objectively.
2.8 Migration and invasion assays and wound-healing assay
Transwell chambers with and without a Matrigel matrix (Corning Life Science, Woburn, MA, USA) were used to examine cell migration and invasion, respectively. Cells (3 × 10⁴) were suspended in 200 μL of serum-free DMEM and seeded onto polycarbonate filters, which were either pre-coated with 100 μL of Matrigel for the invasion assay or left uncoated for the migration assay. The lower chamber was loaded with 600 μL of DMEM containing 10% fetal bovine serum.
The wound-healing assay was performed to assess cell motility. Briefly, wounds were generated by scratching monolayers of cells at 100% confluence using a 200-μL plastic pipette tip. The growth medium was replaced with serum-free medium, and the wounds were monitored in real-time with an IncuCyte® Live-Cell Analysis System.
2.9 In vivo tumorigenicity and metastasis assays
Female BALB/c nude mice (age, 4-6 weeks; body weight, 18-20 g; Charles River, Beijing, China) were subcutaneously injected via the left and right flanks with 5 × 10⁶ SDCBP2-AS1-knockdown BGC823 cells or SDCBP2-AS1-overexpressing SGC79901 cells. NT BGC823 cells and Con SGC79901 cells were used as controls. Approximate tumor volume (mm3) was calculated according to the formula [(smallest diameter2 × widest diameter)/2] as previously described [24]. After 3 weeks, mice were euthanized by CO2 inhalation, and the tumors were harvested and immediatelyweighted.
A lung metastasis model was created using female BALB/c nude mice that were subcutaneously injected via the tail vein with 2 × 10⁶ SDCBP2-AS1-knockdown BGC823 cells or SDCBP2-AS1-overexpressing SGC7901 cells. At 4 weeks post-injection, all mice were euthanized by CO2 inhalation, and the lungs were collected and fixed with Bouin's solution via injection through the main bronchi. The tissue samples were photographed, and metastases were evaluated and finally embedded in paraffin.
Generally, body weight loss of more than 20% of the pre-procedural weight or the size of the subcutaneous tumors reaching 20 mm was considered as a humane endpoint. All animal procedures were conducted following the guidelines of the Laboratory Animal Ethics Committee of Beijing Cancer Hospital (EAEC 2019-03).
2.10 Immunohistochemical (IHC) analysis
Generally, all dissected tissues were formalin-fixed and paraffin-embedded for staining with hematoxylin and eosin (H&E) and IHC analysis. As previously described [19], the slides were dewaxed and gradually hydrated. After retrieving antigens by using citrate buffer (Sigma-Aldrich) at 120°C for 3 min and incubating within 3% H2O2 to eliminate endogenous enzymes, the slides were incubated overnight at 4°C with antibodies against Ki-67, hnRNP K, and β-catenin (Supplementary Table S2). Antigen visualization was performed with ImmPRESS Peroxidase Polymer Detection Reagent (Vector Laboratories, Burlingame, CA, USA) and 3,3′-diaminobenzidine, followed by counterstaining with Mayer's hematoxylin (Sigma-Aldrich). The stained specimens were viewed under a light microscope (Nikon Corporation, Tokyo, Japan). For Ki-67, the proportion of positively stained cells was calculated. For β-catenin, the scores of 0 (negative), 1 (weak), 2 (medium), and 3 (strong) were used for staining intensity quantification, while the scores of 0 (<5%), 1 (5%–25%), 2 (26%–50%), 3 (51%–75%) and 4 (>75%), which were based on the percentage of the positive staining areas in relation to the whole cancerous area, were used to evaluate the extent of staining. Then, the final IHC score was calculated by multiplying scores of staining intensity and percentage of positivity. Cases with a final staining score of ≤4 were deemed as low expression, and those with a score of >4 were reckoned as high expression. All slides were evaluated independently by two pathologists, who were blinded to the patients’ data and clinical outcomes.
2.11 RNA-fluorescence in situ hybridization (FISH) and subcellular fractionation
RNA-FISH with a digoxin-labeled RNA probe (Supplementary Table S3) was used to detect the subcellular location of SDCBP2-AS1 as previously described [24]. Briefly, the nuclei were labeled with 4′,6-diamidino-2-phenylindole (blue), and SDCBP2-AS1 was labeled with a cyanine 3-conjugated RNA probe (red). Images were captured using an LSM 800 confocal microscope (Carl Zeiss AG, Jena, Germany). To separate the nuclear and cytoplasmic fractions, RNA was isolated from BGC823 and SGC7901 cells using a PARIS™ kit (AM1921, Life Technologies, Carlsbad, CA, USA) in accordance with the manufacturer's instructions. SDCBP2-AS1 RNA expression levels in the nuclear and cytoplasmic fractions were determined by RT-qPCR. U6 and GAPDH were used as positive controls for the nuclear and cytoplasmic fractions, respectively. The primer sequences are listed in Supplementary Table S1.
2.12 RNA pull-down assay and mass spectrometry
The RNA pull-down assay was performed using the Pierce Magnetic RNA-Protein Pull-Down Kit (20164, Thermo Fisher Scientific, Rockford, IL, USA) in accordance with the manufacturer's instructions. Briefly, the sense or antisense SDCBP2-AS1 sequence was transcribed in vitro with a biotin RNA-labeling mix and T7 RNA polymerase (Invitrogen Corporation) in accordance with the manufacturer's instructions. The positive control, negative control, biotinylated SDCBP2-AS1 or antisense SDCBP2-AS1 was incubated with streptavidin-linked magnetic beads and total BGC823 cell lysates at 21°C for 2 h. After washing the bead-RNA-protein complexes four times with binding/washing buffer, the proteins were precipitated and diluted in the protein lysis buffer. The collected proteins were separated by electrophoresis for one-shot mass spectrometry or Western blotting analysis. Pull-down samples harvested from immunoprecipitation were separated with sodium dodecyl sulfate-polyacrylamide gel electrophoresis (SDS-PAGE) and stained with Pierce Silver Stain Kit (24612, Thermo Fisher Scientific) according to the instruction manual. The specific strip was cut for mass spectrometry. The primers used for in vitro transcription are listed in Supplementary Table S1 and the antibodies in Supplementary Table S2. Mass spectrometry was performed at the Institute of Biotechnology of the Peking University Health Science Center (Beijing, China).
2.13 RNA immunoprecipitation (RIP)
RIP assays were performed using the Magna RIP RNA-Binding Protein Immunoprecipitation Kit (17-700, EMD Millipore Corporation, Billerica, MA, USA), as previously described [24]. Briefly, 1 × 10⁷ GC cells were harvested and lysed with RIP lysis buffer, and the cell extract was incubated with magnetic beads conjugated with antibodies against hnRNP K or normal rabbit immunoglobulin G (IgG) as a control (Supplementary Table S2). Afterward, the beads were washed and then incubated with proteinase K (EO0491, Thermo Fisher Scientific) to remove proteins. The retrieved RNA was amplified by RT-qPCR using primers specific for SDCBP2-AS1 (Supplementary Table S1). Total RNA (as input controls) and normal IgG controls were assayed simultaneously to verify the RT-qPCR results.
2.14 Western blotting analysis
The proteins isolated from the tissue samples and cell lines were separated by electrophoresis and transferred to polyvinylidene fluoride membranes, which were probed with primary antibodies against matrix metallopeptidase 7 (MMP7), cyclin D1, c-Myc, β-catenin, phospho-β-catenin (Ser33/37/Thr41), glycogen synthase kinase 3 beta (GSK3β), Axin1, adenomatous polyposis coli (APC), histone 3 (H3), Wnt5a, hnRNP K, ubiquitin, Wnt3a, GAPDH, hemagglutinin (HA), and Flag. All antibodies are listed in Supplementary Table S2.
2.15 RNA-sequencing (RNA-seq)
Total RNA was isolated from 1 × 10⁶ BGC823 cells with or without stable SDCBP2-AS1 using the TRizol reagent. Sequence libraries were generated using the TruSeq® RNA Sample Preparation Kit (Illumina, Inc., San Diego, CA, USA) in accordance with the manufacturer's recommendations. Transcriptome sequencing was performed using an Illumina HiSeq X-Ten platform by Novogene Biotech Co., Ltd. (Beijing, China). Fragments per kilo-base of transcript per million fragments mapped of each gene were calculated, and differentially expressed genes (fold change > 2.0, P < 0.01, false discovery rate < 0.05) were selected for gene set enrichment analysis (GSEA), which was performed using GSEA software (v4.0.3; https://www.gsea-msigdb.org/gsea/index.jsp).
2.16 Immunofluorescence (IF) assay
The cells were fixed to the chamber slide with 4% formaldehyde solution, and the cell membranes were penetrated by the addition of 1% Triton X-100. Normal sheep serum (Dako A/S, Glostrup, Denmark) was used to block the cells at 21°C for 30 min. Afterward, the cells were probed with an antibody against β-catenin at 4°C for 12-16 h, followed by a secondary Alexa Fluor™ 594 antibody for IF staining. After Hoechst staining, the cells were observed with an LSM 800 confocal microscope.
2.17 TOP/FOP‑flash luciferase reporter analysis
As previously described [25], the TOP/FOP-flash luciferase reporter assay was applied to analyze the activity of the Wnt/β-catenin signaling pathway. GC cells were seeded into 48-well plates (6 × 10⁴ cells/well) and transiently co-transfected with 250 ng of TOP-FLASH or FOP-FLASH and 25 ng of the plasmid pRL-SV40. Luciferase activity was measured with the Dual-Luciferase Reporter Assay System (E1910, Promega Corporation, Madison, WI, USA) in accordance with the manufacturer's protocol. The TOP/FOP ratio was calculated as an indicator of β-catenin signaling activity. Each experiment was performed in triplicate and repeated at least three times.
2.18 Immunoprecipitation (IP)
IP was performed as previously described [26] with antibodies specific for hnRNP K, β-catenin, FLAG, or HA. The cells were transfected as indicated and harvested with IP lysis buffer (20 mmol/L Tris-HCl at pH 7.5, 150 mmol/L NaCl, 1 mmol/L ethylenediaminetetraacetic acid, 0.1% NP-40 nonionic detergent, 10% glycerol [vol/vol], 1 mmol/L dithiothreitol, protease inhibitor cocktail). The lysates were rotated at 4°C for 1 h and centrifuged at 12,000 rpm for 15 min. Then, the supernatants were collected and incubated overnight at 4°C with the appropriate antibody or an isotype-matched antibody against IgG. After washing once with lysis buffer and twice with lysis buffer without 1% NP-40 to remove all unbound proteins, the precipitants and lysates were subjected to Western blotting analysis with appropriate antibodies.
2.19 Statistical analysis
The cutoff value of RT-qPCR results was determined by survival significance analysis using the tool Cutoff Finder (http://molpath.charite.de/cutoff/) [27]. Kaplan-Meier curves were constructed to assess survival, and the log-rank test was used to compare survival rates between groups. The chi-square test was used to identify the association between SDCBP2-AS1 expression levels and clinicopathological features of GC patients. A multivariate Cox proportional hazards model was used to assess the effects of variables, including SDCBP2-AS1, on survival using IBM SPSS Statistics for Windows, version 22.0. (IBM Corporation, Armonk, NY, USA). The Pearson's correlation test was used to identify correlations between the expression levels of SDCBP2-AS1 and β-catenin. For functional analysis, data are presented as the mean ± standard deviation (SD). Comparisons between two and among three or more groups were conducted using the two-tailed Student's t-test and analysis of variance, respectively, with GraphPad Prism 7 software (GraphPad Software Inc., La Jolla, CA, USA). All experiments were performed at least three times. A P value of <0.05 was considered statistically significant.
3 RESULTS
3.1 Downregulation of SDCBP2-AS1 in GC tissues was indicative of poor outcomes
Based our previous study [17], several lncRNAs were found to be significantly related to the progression of GC, one of which was SDCBP2-AS1. SDCBP2-AS1 was identified as a novel gene, and therefore, was the focus of the present study. The results of 5′/3′ RACE identified the novel lncRNA transcript as SDCBP2-AS1 (NCBI reference sequence: NR_040047.1) (Supplementary Figure S1A). SDCBP2-AS1 was conserved among primates (Supplementary Figure S1B) and was confirmed as a non-coding gene using the online tools (Supplementary Figure S1C-F). SDCBP2-AS1 is located at chromosome 20p13 and overlaps with a short length of the 3’ untranslated regions of the gene encoding SDCBP2 on the opposite DNA strand (Supplementary Figure S1B). Searches of The Cancer Genome Atlas-Stomach Adenocarcinoma (TCGA) GC database from GEPIA web and Asian Cancer Research Group databases confirmed that there was no correlation between SDCBP2 and SDCBP2-AS1 at the post-transcriptional level (Supplementary Figure S1G). Hence, SDCBP2-AS1 was confirmed as a novel lncRNA.
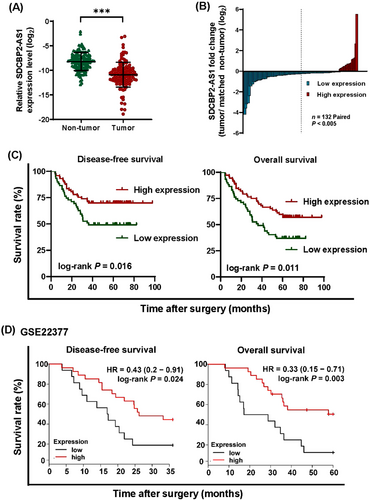
Next, potential associations between SDCBP2-AS1 expression and different clinicopathological features of our clinical samples were investigated. The results showed that SDCBP2-AS1 expression was significantly decreased in GC tissues as compared with the matched adjacent non-tumor tissues (Figure 1A-B). Based on the cutoff value of SDCBP2-AS1 (0.0058), obtained from the Cutoff Finder, the patients were divided into SDCBP2-AS1 high-expression (n = 59) and low-expression groups (n = 73). Notably, low expression of SDCBP2-AS1 was associated with adenocarcinoma (P = 0.033), larger tumor size (P = 0.016), lymph node metastasis (P < 0.001), distant metastasis (P = 0.036), and advanced pathological TNM (pTNM) stage (P < 0.001) in GC patients (Table 1). Kaplan-Meier survival analysis showed that the DFS and OS rates of the low SDCBP2-AS1 group were lower than those of the high SDCBP2-AS1 group (Figure 1C). Univariate and multivariate analyses indicated that SDCBP2-AS1 expression was an independent prognostic factor for GC (Table 2). To validate these findings, the Kaplan-Meier plotter was used to explore potential associations between SDCBP2-AS1 overexpression and survival using the dataset GSE22377. The results showed that lower expression of SDCBP2-AS1 was related to shorter OS and DFS (Figure 1D). These findings verified that low expression of SDCBP2-AS1 was predictive of a poor prognosis for GC patients. Further in vitro evaluation revealed that SDCBP2-AS1 expression was higher in normal GES-1 cells than in GC cell lines (Supplementary Figure S1H).
| Univariate analysis | Multivariate analysis | |||||
|---|---|---|---|---|---|---|
| Characteristic | HR | 95% CI | P | HR | 95% CI | P |
| Gender (male vs. female) | 1.326 | 0.780-2.253 | 0.298 | 0.792 | 0.469–1.160 | 0.248 |
| Age (≤60 vs. >60 years) | 1.036 | 0.644-1.666 | 0.885 | 1.092 | 0.371-3.820 | 0.646 |
| Tumor location (cardiac vs. noncardiac) | 0.713 | 0.426-1.193 | 0.198 | |||
| Tumor size (≤ 5cm vs. > 5cm) | 1.910 | 1.170-3.118 | 0.010 | 1.429 | 0.841-2.428 | 0.187 |
| Pathological types (adenocarcinoma vs. others) | 0.911 | 0.506-1.640 | 0.756 | |||
| pTNM stage (I-II vs. III-IV) | 1.907 | 1.139-3.192 | 0.014 | 1.172 | 0.416–1.785 | 0.046 |
| Histologic differentiation (well or moderate vs. poor) | 1.161 | 0.721-1.869 | 0.540 | |||
| Vascular invasion (absent vs. present) | 2.400 | 1.422-4.048 | 0.001 | 2.139 | 1.231-3.717 | 0.007 |
| Depth of invasion (T1-2 vs. T3-4) | 3.295 | 1.324-8.198 | 0.010 | |||
| Lymphatic metastasis (no vs. yes) | 2.155 | 1.100-4.221 | 0.025 | |||
| Distant metastasis (M0 vs. M1) | 6.951 | 3.365-14.359 | <0.001 | |||
| SDCBP2-AS1 expression (low vs. high) | 0.479 | 0.288-0.798 | 0.005 | 0.547 | 0.318–0.944 | 0.030 |
- Abbreviations: SDCBP2-AS1, syndecan binding protein 2 antisense RNA 1; GC, gastric cancer; HR, hazard ratio; CI, confidence interval.
3.2 SDCBP2-AS1 suppressed proliferation and metastasis of GC cells in vitro
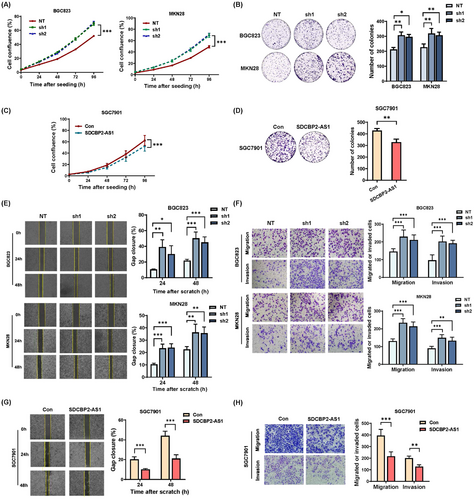
SDCBP2-AS1 was knocked-down in BGC823 and MKN28 cells using two shRNAs. SDCBP2-AS1 was overexpressed in SGC7901 cells. RT-qPCR analysis was used to determine the efficacy of transfection (Supplementary Figure S2A-B). Notably, SDCBP2 mRNA expression was independent of SDCBP2-AS1 expression in GC cell lines with SDCBP2 wild-type, knockdown or overexpression (Supplementary Figure S2C-E). The cell proliferation and colony formation assays demonstrated that knockdown of SDCBP2-AS1 significantly promoted the proliferation and colony formation in both cell lines (Figure 2A-B), whereas overexpression of SCBP2-AS1 had opposite effects (Figure 2C-D). Further, the effects of SDCBP2-AS1 on metastasis of GC cells were explored. The results of the transwell and wound-healing assays showed that silencing of SDCBP2-AS1 increased the migration and invasion of BGC823 and MKN28 cells (Figure 2E-F), while overexpression of SDCBP2-AS1 enhanced the mobility of SGC7901 cells (Figure 2G-H). These in vitro data indicate that knockdown of SDCBP2-AS1 aggressively promoted proliferation, migration, and invasion of GC cells.
3.3 SDCBP2-AS1 suppressed growth and metastasis of GC cells in vivo
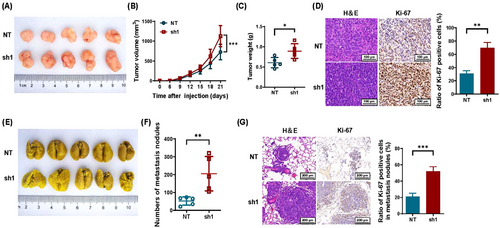
The influence of SDCBP2-AS1 on the tumorigenic and metastatic capacities of GC cells was determined using in vivo xenograft tumor and lung metastasis models in nude mice. The xenograft tumor model was established by subcutaneous injection of BGC823 cells stably transfected with shSDCBP2-AS1#1 (sh1) or the NT control. The resulting tumors were visibly larger and exhibited faster growth in the sh1 group than in the NT group (Figure 3A-C). This difference was further confirmed by staining with H&E and IHC analysis of Ki-67, which showed that Ki-67 expression in tumor tissues was significantly increased in the sh1 group as compared with the NT group (Figure 3D). Moreover, a lung metastasis model showed that the NT group had fewer metastatic lesions than the sh1 group (Figure 3E-F). This difference was further confirmed by staining the lung tissue sections with H&E and IHC analysis of Ki-67 (Figure 3G). Meanwhile, SDCBP2-AS1 overexpression decreased the tumorigenic and metastatic capacity of SGC7901 cells (Supplementary Figure S3). Taken together, these in vivo results support the tumor-suppressive role of SDCBP2-AS1 in GC.
3.4 SDCBP2-AS1 interacted with hnRNP K in the cytoplasm
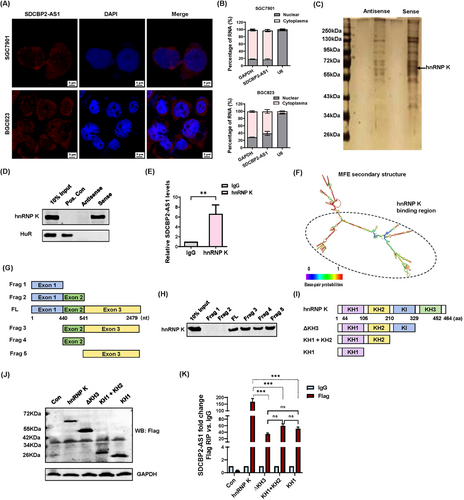
To identify potential mechanisms, the distribution of SDCBP2-AS1 in GC cells was investigated using RNA-FISH and RNA subcellular fractionation. The results showed that SDCBP2-AS1 was more prevalent in the cytoplasm (Figure 4A-B). Further, the RNA pull-down assay with biotinylated SDCBP2-AS1 was employed to identify the protein partner of SDCBP2-AS1. The retrieved proteins were separated by electrophoresis and subjected to silver staining. Finally, several differential bands were selected for mass spectrometry (Supplementary Table S4), which confirmed that hnRNP K interacted with SDCBP2-AS1 but not antisense SDCBP2-AS1 (Figure 4C-D). Next, in vivo RIP analysis showed that hnRNP K interacted with SDCBP2-AS1 in BGC823 cells (Figure 4E). Collectively, these findings demonstrated the interplay between SDCBP2-AS1 and hnRNP K. To determine which regions of SDCBP2-AS1 bind to hnRNP K, a series of SDCBP2-AS1 deletion mutants was constructed according to the predicted secondary structure of SDCBP2-AS1 (Figure 4F). RNA fragments were in vitro transcribed from the deletion constructs for the RNA pull-down assay (Figure 4G). Immunoblot analysis of hnRNP K in protein samples pulled down by different SDCBP2-AS1 RNA fragments showed that RNA fragments with deletions of nucleotide 541-2479 completely lost the ability to bind to hnRNP K (Figure 4H). The sequence of Exon 2 could interact with hnRNP K, its RNA secondary structure was totally different from the full-length sequence of SDCBP2-AS1 though (Supplementary Figure S4). Thus, the Exon 3 sequence was determined to be essential for the interaction between SDCBP2-AS1 and hnRNP K (Figure 4H). Furthermore, hnRNP K harbors several functional domains that participate in RNA-protein interactions, reportedly involving three K homology (KH) domains (KH1, KH2, and KH3). However, the KI domain, located between the KH2 and KH3 domains, mediates hnRNP K activity, although the underlying mechanism remains unclear [28]. The RIP assay with a series of Flag-tagged hnRNP K deletion mutants in BGC823 cells (Figure 4I-J) indicated that KH3 had the greatest ability to bind to SDCBP2-AS1, while there was no significant difference in the capacities of the other domains to interact with SDCBP2-AS1 (Figure 4K). These results identified the specific regions of SDCBP2-AS1 with the ability to bind to the hnRNP K protein domains in GC cells.
3.5 Silencing of SDCBP2-AS1 stabilized β-catenin and prohibited transcriptional activities
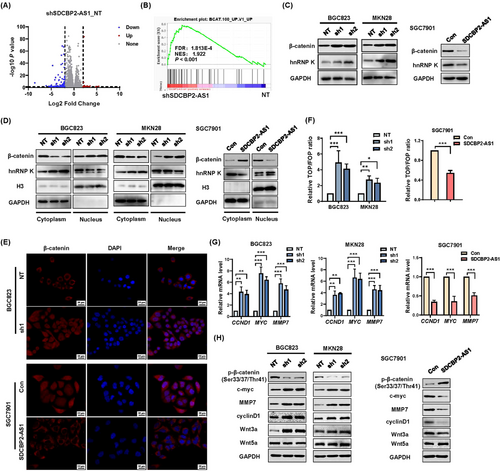
To identify the putative targets of SDCBP2-AS1, RNA-seq was performed to obtain the transcriptional profiles of BGC823 cells following knockdown of SDCBP2-AS1. Of 301 differentially expressed genes, 51 were upregulated and 250 were downregulated in the SDCBP2-AS1-knockdown group (Figure 5A). Furthermore, GSEA of the RNA-seq data indicated that knockdown of SDCBP2-AS1 was positively associated with overexpression of β-catenin (Figure 5B). The subcellular localization of lncRNAs is related to function [29]. SDCBP2-AS1 was mostly located in the cytoplasm and associated with β-catenin expression, suggesting that SDCBP2-AS1 interfered with the degradation of β-catenin [30]. For confirmation, Western blotting analysis showed that knockdown of SDCBP2-AS1 significantly increased the protein levels of β-catenin and hnRNP K in BGC823 and MKN28 cells, while SGC7901 cells overexpressing SDCBP2-AS1 had lower expression levels of β-catenin and hnRNP K (Figure 5C). Consistently, IHC staining showed that the expression of β-catenin was increased both in SDCBP2-AS1 low group of our patient cohort and in xenograft tumors formed by SDCBP2-AS1-knockdown BGC823 cells (Supplementary Figure S5A-C). Additionally, Western blotting analysis showed that knockdown of SDCBP2-AS1 resulted in lower expression of β-catenin in the cytoplasm and higher expression in the nucleus (Figure 5D). Opposite results were obtained for hnRNP K. The results of the IF assay demonstrated that SDCBP2-AS1 altered the shuttling of β-catenin between the nucleus and cytoplasm in GC cells (Figure 5E). The results of the TOP/FOP-flash luciferase assays showed that β-catenin signaling was activated in SDCBP2-AS1-knockdown cells (Figure 5F). In addition, the results of RT-qPCR and Western blotting analyses showed that stable overexpression or knockdown of SDCBP2-AS1 altered the expression patterns of genes downstream of β-catenin (i.e., CCND1, MYC, and MMP7). Translocation of β-catenin activated the Wnt signaling pathway, especially via Wnt3a, but not Wnt5a (Figure 5G-H). Also, the Akt and Erk signaling pathways were activated in SDCBP2-AS1-knockdown BGC823 cells, while the Erk pathway was repressed in SGC7901 cells overexpressing SDCBP2-AS1 (Supplementary Figure S5D-E). Taken together, these results demonstrate that the knockdown of SDCBP2-AS1 helped to stabilize β-catenin and activate the canonical Wnt signaling pathway.
3.6 SDCBP2-AS1 destabilized β-catenin by blocking SUMOylation of hnRNP K in GC cells
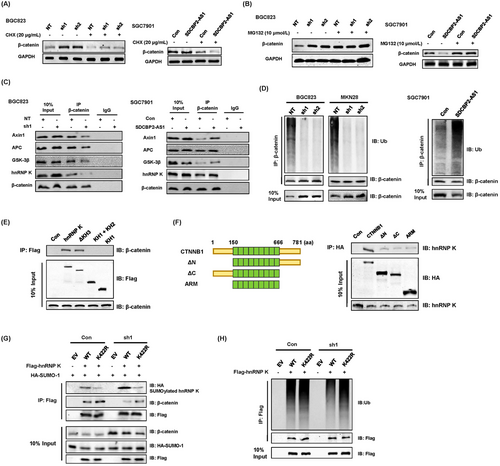
Since SDCBP2-AS1 was found to regulate the protein levels of β-catenin and hnRNP K in different directions, SDCBP2-AS1 might also regulate post-transcriptional modifications. Hence, the protein synthesis inhibitor CHX was used to evaluate the effect of SDCBP2-AS1 on the stability of β-catenin. After treatment with CHX, the protein synthesis of β-catenin decreased significantly in all groups, implying that knockdown of SDCBP2-AS1 or overexpression of SDCBP2-AS1 did not affect the protein synthesis of β-catenin (Figure 6A). In addition, after incubation with the proteasome inhibitor MG132, knockdown and overexpression of SDCBP2-AS1 had similar effects on the degradation of β-catenin in GC cells (Figure 6B). SDCBP2-AS1 regulated the degradation, but not synthesis, of β-catenin. IP analysis was performed to determine whether SDCBP2-AS1 is involved in forming a degradation complex targeting endogenous β-catenin. Since APC, Axin1, and GSK3β are the major components that induce the degradation of β-catenin, the interaction between β-catenin and the destruction complex decreased in the absence of SDCBP2-AS1 (Figure 6C), suggesting that SDCBP2-AS1 may interfere with degradation of β-catenin. Consistently, overexpression of SDCBP2-AS1 facilitated ubiquitination and degradation of β-catenin (Figure 6C) by binding to hnRNP K. In the absence of SDCBP2-AS1, ubiquitination of β-catenin was incomplete (Figure 6D). To further investigate the capacity of SDCBP2-AS1 to destabilize β-catenin and given that the RNA pull-down assay showed that SDCBP2-AS1 did not directly interact with β-catenin or β transducin repeat-containing protein (β-TrCP) (Supplementary Figure S6A), the ability of SDCBP2-AS1 to regulate interactions between β-catenin and hnRNP K was investigated. Hence, a series of Flag-tagged truncated hnRNP K protein was constructed as described in the preceding text, and the protein domain mapping study indicated that the KH3 and KI domains of hnRNP K were essential for its interactions with β-catenin (Figure 6E). Meanwhile, immunnoprecipitation of HA-tagged β-catenin truncation mutants showed all domains of β-catenin were involved in its interactions with hnRNP K, although the full length had the greatest binding ability (Figure 6F). In addition, SDCBP2-AS1 mainly interacted with the KH3 domain of hnRNP K. Several post-translational modification sites have been reported in the KH3 region, such as the lysine residue at position 422, which was identified as the major SUMOylation site of hnRNP K [31, 32]. Hence, the ability of SDCBP2-AS1 to regulate post-translational modifications of hnRNP K was investigated, especially SUMOylation and ubiquitination of the KH3 domain. Flag-tagged wild-type hnRNP K and the K422R mutant showed that the mutant interfered with SUMOylation of hnRNP K (Supplementary Figure S6B). Knockdown of SDCBP2-AS1 increased SUMOylation of the wild-type, but not the K422R mutant (Figure 6G), and decreased endogenous poly-ubiquitination of hnRNP K (Figure 6H). As compared with the K422R mutant, SDCBP2-AS1 altered SUMOylation by blocking the specific active site of the KH3 domain in the spatial structure. These results indicate that knockdown of SDCBP2-AS1 led to accumulation of β-catenin in the cytoplasm and subsequent nuclear translocation via stabilization of β-catenin in GC cells.
3.7 The tumor-suppressor functions of SDCBP2-AS1 were partially exerted through interplay with hnRNP K
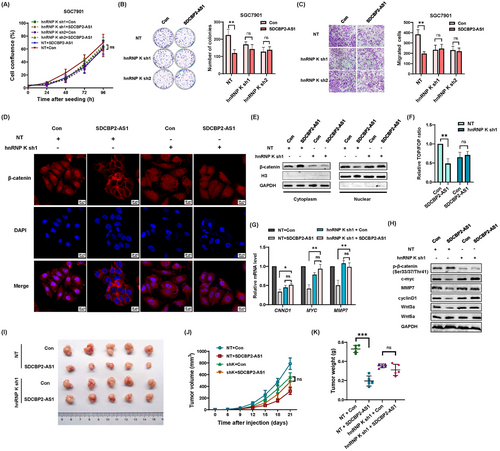
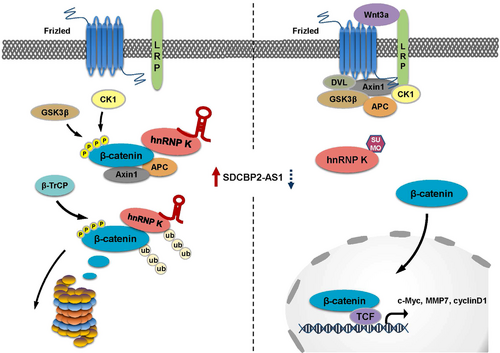
SGC7901 cells with stable knockdown of hnRNP K were established to assess the interactions between SDCBP2-AS1 and hnRNP K in GC cells (Supplementary Figure S7A). In addition, SDCBP2-AS1 was overexpressed to determine whether hnRNP K is a key mediator. Silencing of hnRNP K eliminated the tumor suppressor functions of SDCBP2-AS1, including cell proliferation and migration (Figure 7A-C). The results of the IF and Western blotting assays showed that without hnRNP K, SDCBP2-AS1 failed to facilitate nuclear translocation of β-catenin in GC cells (Figure 7D-E). In addition, the results of the TOP/FOP-flash luciferase, qPCR, and Western blotting assays showed that without hnRNP K, SDCBP2-AS1 could not activate transcription of downstream target genes and the Wnt/β-catenin pathway (Figure 7F-H). In xenograft tumor models, stable knockdown of hnRNP K in SGC7901 cells erased the differences in growth rate and tumor weight caused by overexpression of SDCBP2-AS1 (Figure 7I-K). In the lung metastasis model, knockdown of hnRNP K also attenuated the impacts of SDCBP2-AS1 overexpression on the metastatic potential of GC cells (Supplementary Figure S7B-C). These results demonstrated that SDCBP2-AS1 inhibited tumorigenicity via hnRNP K as shown in Figure 8.
4 DISCUSSION
Although many lncRNAs with altered expression have been reported in gastric tumorigenesis, the functional roles and molecular mechanisms of many GC-specific lncRNAs have not been determined. In this study, SDCBP2-AS1 was identified as a novel tumor suppressor in GC tumorigenesis and metastasis. Comparisons of the expression patterns of SDCBP2-AS1 in GC tissues and validation of the Gene Expression Omnibus data showed that low expression of SDCBP2-AS1 was associated with poor prognosis of GC patients. A series of in vitro and in vivo experiments showed that knockdown of SDCBP2-AS1 significantly promoted tumorigenesis and metastasis.
An analysis of public datasets showed that SDCBP2-AS1 was significantly associated with DFS in patients with thyroid cancer [33]. However, the biological functions of SDCBP2-AS1 were not investigated in that study. SDCBP2-AS1 was shown to regulate ependymin-related 1 (EPDR1) by competitively binding to miR-100-5p, which targets EPDR1, thereby inhibiting the progression of ovarian cancer [34]. Whether SDCBP2-AS1 also functions as a competing endogenous RNA in GC is worthy of future research. In the present study, we focused on identifying the protein partner and their post-transcriptional modifications pattern of SDCBP2-AS1.
The function of lncRNAs is largely determined by subcellular location [35, 36]. According to previous reports, lncRNAs located in the nucleus, such as Pvt1 oncogene (PVT-1) and homeobox A11 antisense RNA (HOXA11-AS), regulate transcription [37, 38], while those located in the cytoplasm, such as small nucleolar RNA host gene 5 (SNHG5) and urothelial cancer associated 1 (UCA1), act as sponges for microRNAs to regulate the expression of related mRNAs [39, 40] and others are involved in the regulation of cellular signaling pathways [41-43]. In the present study, RNA-FISH was conducted to determine the function of SDCBP2-AS1 and elucidate the molecular mechanisms in GC cells. Further, the RNA-seq results showed a significant connection between SDCBP2-AS1 and β-catenin, which was confirmed by the Western blotting and TOP/FOP-flash luciferase assay results. Knockdown of SDCBP2-AS1 stabilized β-catenin accumulation in the cytoplasm and its subsequent translocation into the nucleus, resulting in high expression of downstream target genes [15]. Moreover, cytoplasmic localization of SDCBP2-AS1 promoted the degradation of β-catenin in GC cells. The lncRNA pancEts-1 was reported to interact with both hnRNP K and β-catenin to activate transcription [44], and solute carrier organic anion transporter family member 4A1 antisense RNA 1 (SLCO4A1-AS1) bound to β-catenin was found to block the interaction between β-catenin and GSK3β [45]. However, the results of the RNA pull-down assay showed that SDCBP2-AS1 directly bound to hnRNP K, but not β-catenin. The IP assay showed that when SDCBP2-AS1 was silenced, hnRNP K was still able to directly interact with endogenous β-catenin, but not as strongly as in the presence of SDCBP2-AS1. Therefore, SDCBP2-AS1 assisted in the interaction between hnRNP K and β-catenin, thereby effectively regulating the degradation of β-catenin and achieving the effect of suppressing tumorigenesis. The novel lncRNA human Fas-activated serine/threonine kinase (hFAST), located in the cytoplasm of human embryonic stem cells, maintained pluripotency of the cells by disrupting the interaction between β-TrCP and β-catenin, resulting in reduced degradation of β-catenin [46]. In the present study, the RNA pull-down assay did not detect direct interactions between SDCBP2-AS1 and β-TrCP, suggesting that SDCBP2-AS1 promoted degradation of β-catenin via hnRNP K in GC cells.
The results of the RNA pull-down and RIP assays of different truncated mutants of SDCBP2-AS1 and hnRNP K showed that the secondary structures of RNAs were important for binding to proteins. As previously reported, the KH domain was the major RNA/DNA-binding domain of hnRNP K [47, 48]. In the present study, the KH3 domain of hnRNP K was most readily bound to SDCBP2-AS1, although the other domains also bound to SDCBP2-AS1, indicating strong binding capacity between SDCBP2-AS1 and hnRNP K. Previous studies have reported that lncRNA-OG, lncRNA-p21, lncRNA THRIL, and LINC01354 physically associate with other members of the hnRNP family to mediate transcriptional regulation [26, 49-51]. The present study demonstrated that SDCBP2-AS1 bound to the KH3 domain and blocked the major SUMOylation site of hnRNP K, thereby regulating SUMOylation and ubiquitination of hnRNP K to further facilitate ubiquitination of β-catenin. Furthermore, SDCBP2-AS1 was found to promote phosphorylation of cytosolic β-catenin (Ser33/37/Thr41) as a part of the degradation step. Moreover, ubiquitinated hnRNP K might spatiotemporally recruit other E3 ubiquitin ligases, such as β-TrCP, a major regulator of β-catenin degradation.
Silencing of hnRNP K almost completely abolished the biological function of SDCBP2-AS1, suggesting that the function of SDCBP2-AS1 is mediated by hnRNP K. hnRNP K is shuttled between the cytoplasm and nucleus and interacts with both nucleic acids and proteins, thereby participating in many cellular functions, including transcription, translation, mRNA splicing, and chromatin remodeling [52, 53]. Various post-translational modifications (i.e., phosphorylation, ubiquitination, SUMOylation, and methylation) determine the biological functions of hnRNP K [54, 55]. In the present study, knockdown of SDCBP2-AS1 increased the cytoplasmic fraction of hnRNP K and inhibited complex formation with β-catenin in the nucleus. This phenomenon of SDCBP2-AS1 in GC contradicts a previous report that hnRNP K and β-catenin were translocated to the nucleus simultaneously [44]. As a possible explanation for this discrepancy, SUMOylation and ubiquitination serve to rapidly change the activity and abundance of hnRNP K in response to different stress conditions in the cytoplasm [56]. Alternatively, β-catenin-induced massive abundance of pre-RNA requires the accumulation of hnRNP K in the cytoplasm to manage RNA processing.
Although the results of this study revealed that SDCBP2-AS1 could interact with hnRNP K and assist in the degradation of β-catenin, the precise site of hnRNP K binds to SDCBP2-AS1 remains unclear. A docking model of SDCBP2-AS1 and hnRNP K are needed in our future study, which will spatially demonstrate how the ubiquitinated β-catenin/hnRNP K complex regulates phosphorylation of β-catenin and other unknown proteins involved in the degradation process.
5 CONCLUSIONS
In summary, we reported SDCBP2-AS1 as a novel tumor suppressor lncRNA that inhibited proliferation and metastasis of GC cells. The tumor suppressor function of SDCBP2-AS1 via directly binding to hnRNP K regulated post-transcriptional modifications of hnRNP K and β-catenin, thereby promoting degradation of β-catenin. Consistently, stabilization of β-catenin via loss of SDCBP2-AS1 resulted in poor prognosis of GC patients, demonstrating that SDCBP2-AS1 may be a potential diagnostic and prognostic biomarker for GC patients.
AUTHOR CONTRIBUTIONS
Conceived the hypothesis, Jing Han and Menglin Nie; Performed the experiments, Jing Han, Menglin Nie and Cong Chen; Designed and interpreted the results, Jing Han, Menglin Nie, Cong Chen, Xiaojing Cheng, Ting Guo, Xiaomei Li, Longtao Huangfu, and Hong Du; Wrote the manuscript, Jing Han, Menglin Nie and Cong Chen; Supervised the study, Xiaofang Xing and Jiafu Ji. All authors read and approved the final version of the manuscript.
ACKNOWLEDGMENTS
This work was supported by the Third Round of Public Welfare Development and Reform Pilot Projects of the Beijing Municipal Medical Research Institutes (Beijing Medical Research Institute, grant no. 2019-1), the Joint Fund for the Key Projects of the National Natural Science Foundation of China (U20A20371), the National High Technology Research and Development Program of China (863 Program, grant no. 2014AA020603), the “Double First Class” Disciplinary Development Foundation of Peking University (grant no. BMU2019LCKXJ011), the National Natural Science Foundation of China (grant nos. 82103528, 81872502, 81802471, and 81972758), the Beijing Municipal Administration of Hospitals’ Youth Program (grant no. QML20181102), and the Clinical Medicine Plus X-Young Scholars Project of Peking University (grant no. PKU2020LCXQ001). J.H. gratefully acknowledges K.L.W. for spiritual support during this study.
CONFLICTS OF INTEREST
The authors declare no potential conflicts of interest.
ETHICS APPROVAL AND CONSENT TO PARTICIPATE
Informed consent was obtained from all patients. The study protocol was approved by the Ethics Committee of Peking University Cancer Hospital (approval no. 2018KT07).
CONSENT FOR PUBLICATION
Not applicable.
Open Research
DATA AVAILABILITY STATEMENT
Original RNA-sequencing data are available in the NCBI BioProject database (https://www.ncbi.nlm.nih.gov/bioproject/; BioProject ID: PRJNA832819). The datasets generated and/or analyzed during the current study are available from the corresponding author upon reasonable request.


