BRD2 induces drug resistance through activation of the RasGRP1/Ras/ERK signaling pathway in adult T-cell lymphoblastic lymphoma
Abstract
Background
Adult patients with T-cell lymphoblastic lymphoma (T-LBL) are treated with high-intensity chemotherapy regimens, but the response rate is still unsatisfactory because of frequent drug resistance. We aimed to investigate the potential mechanisms of drug resistance in adults with T-LBL.
Methods
Gene expression microarray was used to identify differential mRNA expression profiles between chemotherapy-resistant and chemotherapy-sensitive adult T-LBL tissues. Real-time PCR and immunohistochemistry were performed to detect the expression of bromodomain-containing protein 2 (BRD2) and c-Myc in fresh-frozen T-LBL tissues from 85 adult patients. The Ras pull-down assay was performed to monitor Ras activation. Chromatin immunoprecipitation assays were used to analyze the binding of E2F transcription factor 1 (E2F1)/BRD2 to the RAS guanyl releasing protein 1 (RasGRP1) promoter region. The drug resistance effect and mechanism of BRD2 were determined by both in vivo and in vitro studies.
Results
A total of 86 chemotherapy resistance-related genes in adult T-LBL were identified by gene expression microarray. Among them, BRD2 was upregulated in chemotherapy-resistant adult T-LBL tissues and associated with worse progression-free survival and overall survival of 85 adult T-LBL patients. Furthermore, BRD2 suppressed doxorubicin (Dox)-induced cell apoptosis both in vitro and in vivo. The activation of RasGRP1/Ras/ERK signaling might contribute to the Dox resistance effect of BRD2. Besides, OTX015, a bromodomain and extra-terminal (BET) inhibitor, reversed the Dox resistance effect of BRD2. Patient-derived tumor xenograft demonstrated that the sequential use of OTX015 after Dox showed superior therapeutic effects.
Conclusions
Our data showed that BRD2 promotes drug resistance in adult T-LBL through the RasGRP1/Ras/ERK signaling pathway. Targeting BRD2 may be a novel strategy to improve the therapeutic efficacy and prolong survival of adults with T-LBL.
Abbreviation
-
- ATCC
-
- American Type Culture Collection
-
- BBI
-
- BET bromodomain inhibitor
-
- BET
-
- bromodomain and extra-terminal
-
- BFM
-
- Berlin-Frankfurt-Muenster
-
- BM
-
- bone marrow
-
- ChIP
-
- chromatin immunoprecipitation
-
- CI
-
- confidence interval
-
- CNS
-
- central nervous system
-
- CR
-
- complete remission
-
- CR1
-
- first complete remission
-
- CT
-
- computed tomography
-
- CVAD
-
- cyclophosphamide, vincristine, doxorubicin, and dexamethasone
-
- DFS
-
- disease-free survival
-
- Dox
-
- doxorubicin
-
- ECOG-PS
-
- Eastern Cooperative Oncology Group performance status
-
- FFPE
-
- formalin-fixed, paraffin-embedded
-
- HD
-
- heterodimerization domain
-
- HR
-
- hazard ratio
-
- IHC
-
- immunohistochemistry
-
- LDH
-
- lactic dehydrogenase
-
- OS
-
- overall survival
-
- PDX
-
- patient-derived xenograft
-
- PET-CT
-
- positron emission tomography-computed tomography
-
- PFS
-
- progression-free survival
-
- RasGRP1
-
- Ras guanyl-releasing protein 1
-
- ROC
-
- receiver operating characteristic
-
- SAM
-
- significance analysis of microarray
-
- SCID
-
- severe combined immunodeficient
-
- TAF
-
- TATA-box-binding protein-associated factor
-
- T-ALL
-
- T-cell acute lymphoblastic leukemia
-
- T-LBL
-
- T-cell lymphoblastic lymphoma
-
- VDLP-CAM
-
- vincristine, daunorubicin, L-asparaginasum, prednisone, and cyclophosphamide, cytarabine, 6-mercaptopurine
-
- WHO
-
- World Health Organization
1 BACKGROUND
T-cell lymphoblastic lymphoma (T-LBL) is a rare type of aggressive non-Hodgkin's lymphoma [1, 2]. It develops from precursor T lymphoblasts and occurs mostly in adolescence and young adults [3, 4]. T-LBL and T-cell acute lymphoblastic leukemia (T-ALL) are morphologically and immunophentypically the same. According to the 2008 World Health Organization (WHO) classification, T-LBL is used when there is primarily a mass lesion with less than 20% blasts in the bone marrow (BM), whereas T-ALL is defined when there is extensive BM involvement [5]. However, cytogenetic analysis shows that T-LBL is quite different from T-ALL, suggesting that these two diseases stem from different biological bases [6].
To date, there is no definite standard treatment protocol for adult T-LBL [7]. Clinicians usually use ALL-type regimens, such as the Berlin-Frankfurt-Muenster (BFM) protocol or the fractionated cyclophosphamide, vincristine, doxorubicin (Dox), and dexamethasone (hyper-CVAD) regimen, to treat adult patients with T-LBL. ALL-type chemotherapy has improved the clinical outcomes of these adult patients, with a 3-year disease-free survival (DFS) rate of 75%-90% [3]. However, up to 40% of adult patients will relapse soon after an initial complete remission (CR) [1, 3, 7, 8]. Moreover, the T-LBL patients who fail to achieve CR or relapse after CR would have a poor prognosis, and drug resistance is the main reason of CR failure or relapse after CR [9]. Therefore, understanding the drug resistance mechanism of ALL-type chemotherapy could contribute to the development and implementation of standard treatment guidelines for adult patients with T-LBL.
The bromodomain and extra-terminal (BET) proteins are chromatin-associated proteins that regulate gene expression by recruiting different components of the transcription process [10]. BET proteins (including BRD2, BRD3, BRD4, and BRDT) recognize epigenetic markers, such as N-e-acetylated lysine residues in nucleosomal histones, and are associated with the occurrence and progression of various human cancers [11, 12]. Several studies have reported that BET proteins regulate cell cycle, proliferation, and metastasis through chromatin remodeling machines [13, 14]. Targeting BET proteins can offset therapy resistance, offering a novel strategy for treatment-resistant tumors [15]. BET proteins emerge as a promising therapeutic target, and competitive BET bromodomain inhibitors (BBIs) (e.g., OTX015, JQ1, and T-BET151) have showed an excellent anticancer effect in many malignancies [16, 17]. Some of these agents, such as OTX015, have already been tested in phase I clinical trials in acute leukemia [18], multiple myeloma [19], and other advanced solid tumors [20]. However, the molecular status and biofunctions of BET proteins when participating in the regulation of T-LBLs are still unknown.
In the present study, we identified BRD2 as a drug resistance-related gene by genome-wide gene expression microarray and explored its underlying molecular mechanisms in adult T-LBL. Furthermore, we demonstrated that OTX015 could be applied as a candidate component of standard treatment for adult T-LBL.
2 MATERIALS AND METHODS
2.1 Clinical specimens
Formalin-fixed, paraffin-embedded (FFPE) tissues of T-LBL from 6 adult patients (3 chemotherapy-resistant patients who failed to achieve CR after induction BFM chemotherapy and 3 chemotherapy-sensitive patients who achieved CR after induction BFM chemotherapy and without relapse within 5 years) were collected and analyzed by gene expression microarray to identify differentially expressed mRNAs. All these patients were treated at the Sun Yat-sen University Cancer Center (Guangzhou, Guangdong, China) between January 1, 2015 and December 30, 2015. All clinical specimens were obtained by resection or biopsy, fixed by formalin, and embedded by paraffin. The induction chemotherapy was defined as patients treated with vincristine, daunorubicin, L-asparaginasum, prednisone, and cyclophosphamide, cytarabine, 6-mercaptopurine (VDLP-CAM) therapy in BFM protocols, or 2–4 cycles of hyper-CVAD treatments.
Fresh-frozen tissues of T-LBL were obtained from 85 adult patients with pathologically diagnosed T-LBL treated at Sun Yat-sen University Cancer Center (Guangzhou, Guangdong, China) between January 1, 2010 and December 30, 2014. The age of them at diagnosis was between 18 and 65 years. The exclusion criteria were as follows: (1) the BM lymphoblast cells accounted for more than 20%; (2) no sample was collected at the time of initial diagnosis; (3) the sample contained less than 80% of tumor cells; (4) the patient did not achieve first CR (CR1); (5) the sample contained less than 5 ng/L of RNA; (6) the patient was not treated with hyper-CVAD or BFM protocol as the first-line therapy. The diagnosis of T-LBL depends on the 2008 WHO criteria [5] with independent verification by two physicians (Xiao-Peng Tian and Qing-Qing Cai). CR and relapse require confirmation by computed tomography (CT), positron emission tomography-computed tomography (PET-CT), and/or BM biopsy (using Cheson criteria [21]). The inclusion and exclusion criteria were also applicable to the 6 FFPE samples used for microarray. The clinicopathological characteristics of 85 participants are summarized in Table 1.
| BRD2 mRNA level [cases (%)] | ||||
|---|---|---|---|---|
| Characteristic | Total [cases (%)] | Low# | High† | P value* |
| Age (years) | 0.711 | |||
| ≤28.5 | 41 (48.2) | 24 (50.0) | 17 (45.9) | |
| >28.5 | 44 (51.8) | 24 (50.0) | 20 (54.1) | |
| Gender | 0.979 | |||
| Male | 55 (64.7) | 31 (64.6) | 24 (64.9) | |
| Female | 30 (35.3) | 17 (35.4) | 13 (35.1) | |
| ECOG-PS | 0.264 | |||
| <2 | 73 (85.9) | 43 (89.6) | 30 (81.1) | |
| ≥2 | 12 (14.1) | 5 (10.4) | 7 (18.9) | |
| Effusion, pleural, and/or pericardia | 0.271 | |||
| Present | 59 (69.4) | 31 (64.6) | 28 (75.7) | |
| Absent | 26 (30.6) | 17 (35.4) | 9 (24.3) | |
| CNS involvement | 0.718 | |||
| Present | 8 (9.4) | 5 (10.4) | 3 (8.1) | |
| Absent | 77 (90.6) | 43 (89.6) | 34 (91.9) | |
| Mediastinal involvement | 0.173 | |||
| Present | 76 (89.4) | 41 (85.4) | 35 (94.6) | |
| Absent | 9 (10.6) | 7 (14.6) | 2 (5.4) | |
| Bone marrow involvement | 0.138 | |||
| Present | 28 (32.9) | 19 (39.6) | 9 (24.3) | |
| Absent | 57 (67.1) | 29 (60.4) | 28 (75.7) | |
| LDH concentration | 0.532 | |||
| Normal (≤ 245 U/L) | 26 (30.6) | 16 (33.3) | 10 (27.0) | |
| Elevated (>245 U/L) | 59 (69.4) | 32 (66.7) | 27 (73.0) | |
| Ann-Arbor stage | 0.267 | |||
| ≤2 | 8 (9.4) | 6 (12.5) | 2 (5.4) | |
| >2 | 77 (90.6) | 42 (87.5) | 35 (94.6) | |
| NOTCH1 status | 0.006 | |||
| Mutation | 42 (49.4) | 30 (62.5) | 12 (32.4) | |
| Wild-type | 43 (50.6) | 18 (37.5) | 25 (67.6) | |
- Abbreviations: T-LBL, T-cell lymphoblastic lymphoma; CNS, central nervous system; ECOG-PS, Eastern Cooperative Oncology Group performance status; LDH, lactate dehydrogenase.
- † Relative BRD2 mRNA level > 3.3;
- # Relative BRD2 mRNA level ≤3.3.
- * P value was calculated by Pearson Chi-Square test.
All T-LBL tissue samples were obtained with informed consent under Institutional Review Board-approved protocols. This study was approved by the Institute Research Ethics Committee of the Sun Yat-sen University Cancer Center.
2.2 Cell cultures
Jurkat, SUP-T1, and MEK-293 cell lines were obtained from the American Type Culture Collection (ATCC; Manassas, VA, USA). They were cultured in RPMI-1640 media (Gibco Laboratories, Grand Island, NY, USA) supplemented with 10% fetal bovine serum (Gibco Laboratories) at 37°C with 5% CO2. The technology of short tandem repeat fingerprinting was applied to authenticate cells at the Medicine Lab of Forensic Medicine Department of Sun Yat-sen University (Guangzhou, Guangdong, China) on April 6, 2018.
2.3 Gene expression microarray
The QIAGEN FFPE RNeasy kit (QIAGEN, Hilden, Germany) was used to extract total RNA from 6 FFPE samples, and the cDNA was transcribed using the Ovation FFPE WTA system (NuGEN, San Carlos, CA, USA) according to the user manual. Subsequently, fragmentation and labeling were performed using an Encore Biotin Module (NuGEN). We then hybridized the labeled cDNAs to Affymetrix Human Gene 2.0 ST GeneChips (Affymetrix, Santa Clara, CA, USA) in hybridization Oven 645 (Affymetrix), washed in Fluidics Station 450 (Affymetrix), and scanned using GeneChip Scanner 3000 (Affymetrix). Raw data were analyzed using Command Console Software 3.1 (Affymetrix). The signal value was transformed to log2 formation. Differential expressions between BFM chemotherapy-resistant tumor samples and BFM thermotherapy-sensitive tumor tissues were determined by significant analysis of microarray (SAM) algorithm, and a fold-change > 1.5 and associated P < 0.05 were considered significant. The gene expression microarray data are available at the Gene Expression Omnibus (GSE143166).
2.4 Semi-quantitative real-time PCR
A total of 2 mg RNA was extracted from 85 fresh frozen tissues using TRIzol reagent (Invitrogen, Carlsbad, CA, USA) and reversely transcribed using the Advantage RT-PCR kit (Clontech, San Francisco, CA, USA) to synthesize the first-strand cDNA. Subsequently, gene-specific PCR products were continuously detected using the ABI 7900HT fast real-time PCR system (Applied Biosystems, Foster City, CA, USA) with SYBR (Applied Biosystems) and primers for BRD2, RAS guanyl releasing protein 1 (RasGRP1), and glyceraldehyde-3-phosphate dehydrogenase (GAPDH) following a standard quantitative PCR protocol. The incubation procedure in real-time PCR was as follow: 48°C for 2 min, 95°C for 15 s, and 60°C for 1 mi. The expression levels of the tested genes were normalized with GAPDH as internal controls. The following primer pairs were used in this study: 5′-GGCAGTACAGACCCCCTAGAAG-3′ (forward) and 5′-AGGCGGATGAACACGAAAAGT-3′ (reverse) for human BRD2, 5′-CCCAGGATACTCTATATGTGCTTC-3′ (forward) and 5′-CTTGTTAGGTAGGCAGTCTGAG-3′ (reverse) for human RasGRP1, and 5′-GAAGGTGAAGGTCGGAGTCA-3′ (forward) and 5′-GACAAGCTTCCCGTTCTCAG-3′ (reverse) for human GAPDH [22]. The relative levels of gene expression were represented as ΔCt = Ctgene - Ctreference, and the 2-ΔΔCt Method was used to estimate the fold change of gene expression [23]. Using receiver operating characteristic (ROC) curve analysis, the optimal cut-off value was determined under the closest to (1, 1) criteria.
2.5 Plasmid construction, lentivirus production, and infection
The sequences of the BRD2 were cloned into the pCDH-CMV-MSC-EF1-coGFP cDNA expression lentivector (System Biosciences, Palo Alto, CA, USA). Recombinant lentiviruses were obtained from HEK-293 cells co-transfected with lentiviral expression construct and packaging plasmid mix (Genechem, Shanghai, China). Then Jurkat and SUP-T1 cells were transfected with recombinant lentivirus in the presence of 8 mg/mL polybrene (Sigma, St. Louis, MI, USA). Finally, the expression level of BRD2 in transfected Jurkat and SUP-T1 cells was confirmed by Western blotting.
2.6 MTT assay
MTT assay (Sigma) was used to assess cell viability according to previous descriptions [24]. Briefly, cells were seeded in 96-well plates at a density of 1000 cells/well and subjected to the following treatments according to experimental requirements: 100 ng/mL Dox (Sigma), 10 µmol/L PD098059 (MedChemExpress, Shanghai, China), or 10 nmol/L OTX015 (Sigma). Cell viability was assessed at 12 h to 60 h. At 60 h post treatment, 200 µL MTT (5 mg/mL) was added in each plate well and incubated for 4 h. After that, the microplate reader (Molecular Devices, San Jose, CA, USA) was used to measure the absorbance value at 490 nm. All experiments were performed in triplicate.
2.7 Flow cytometry-based apoptosis detection
Percentage of apoptotic cells was determined by using Annexin V-APC and propidium iodide (PI) staining. Cells were routinely cultured in RPMI-1640 media for 36 h with 10% fetal bovine serum. Next, cells were treated with 100 ng/ml Dox and/or 10 nmol/L OTX015 for 24h. Apoptosis assay based on flow cytometry (Beckman Coulter, Kraemer Boulevard Brea, CA, USA) was performed to quantify the cell apoptosis in each sample according to the protocol provided by the manufacturer (BioVision, San Francisco Bay, CA, USA).
2.8 Western blotting
Western blotting was performed according to the standard protocol. Briefly, proteins were detected with antibodies specifically recognizing Bax (1:2000; sc-7480; Santa Cruz Biotechnology, Santa Cruz, CA, USA), Bcl-2 (1:2000; sc-509; Santa Cruz Biotechnology), P-ERKTyr204 (1:2000; sc-7383; Santa Cruz Biotechnology), ERK (1:2000; sc-514302; Santa Cruz Biotechnology), P-MEK-Ser298 (1:2000; sc-271914; Santa Cruz Biotechnology), MEK (1:2000; sc-6250; Santa Cruz Biotechnology), c-Myc (1:2000; sc-40; Santa Cruz Biotechnology), and RasGRP1 (1:2000; sc-365358; Santa Cruz Biotechnology). β-actin (1:2000; sc-47778; Santa Cruz Biotechnology) and GAPDH (1:2000; sc-47724; Santa Cruz Biotechnology) were used as normalized controls. Cells were lysed by RIPA lysis buffer (Beyotime, Shanghai, China). The cell lysates were centrifuged with 12000 × g at 4°C. The protein samples were obtained from the supernatant of cell lysates and quantified by the BCA protein assay kit (ThermoFisher Scientific, Waltham, MA, USA). The extracted protein was denatured in water bath with 95°C for 5 min. Then, the protein was separated using 10% SDS-PAGE gel and transferred onto polyvinylidene fluoride (PVDF) membranes (Millipore, Boston, MA, USA). The membranes were blocked with 10% non-fat milk and incubated with primary antibody at 4°C overnight. After washing with TBST (tris-buffered saline, 0.1% Tween 20) 10 min for 3 times, membranes were incubated with secondary antibody (1:8000; sc-516102; Santa Cruz Biotechnology) at room temperature for 2 h. The immunoblots were developed with the SuperSignal West Pico Chemiluminescent Substrate (Pierce, Waltham, MA, USA), scanned and quantified using the Quantity-One software from the Bio-Rad Image analysis systems (Bio-Rad Laboratories, Hercules, CA, USA).
2.9 Immunohistochemistry (IHC)
Sample preparation was accomplished following standard protocol. All prepared slides underwent deparaffinization and rehydration. Diluted hydrogen peroxide at a concentration of 0.3% was used for blocking endogenous peroxidase activity. Next, antigen retrieval, a step to unmask the antigen epitope, was carried out by boiling sections with 10 mmol/L citrate buffer (pH 6.0) for 15 min in a microwave oven. Protein blocking step with 10% bull serum albumin for 10 min was required for reducing non-specific binding. Then, the slides were incubated with primary antibodies against BRD2 (1:100; sc-393720; Santa Cruz Biotechnology) and c-Myc (1:200; sc-40; Santa Cruz Biotechnology) overnight at 4°C, and subsequently incubated with the secondary antibody mouse IgGκ binding protein-HRP (1:100; sc-393720; Santa Cruz Biotechnology) for 30 min at 37°C. The color development was performed employing a streptavidin-peroxidase conjugate reacting for 30 min at 37°C, and 30,30-diaminobenzidine was used as the chromogen substrate. The nucleus was counterstained using Meyer's hematoxylin (Sigma). As a negative control, normal non-specific IgG was applied instead of the primary antibody. Immune-positive cells in 5 fields per slide were counted, and proportion of immune-positive cells among all cells was calculated. Finally, the proportion of immune-positive cells was used to evaluate IHC staining of c-Myc and BRD2. The positive cells were calculated by using a score interval of 5% (such as 5%, 10%, 15%, 20%, etc.).
2.10 Chromatin immunoprecipitation (ChIP) assay
The Nuclear Extraction Kit (Active Motif, Carlsbad, CA, USA) was used for the preparation of nuclear extracts following the manufacturer's protocol. The nuclear lysate products were subjected to immunoprecipitation using a commercially available ChIP assay kit (Abcam, Cambridge, London, UK) with the following antigens: rabbit anti-BRD2 antibody (1:50; ab139690; Abcam) and non-specific IgG (1:200; ab108338; Abcam). The specific immunoprecipitated promoter fragments was amplified by PCR and visualized by agarose gel electrophoresis. The following primer pairs were used in ChIP: 5′-TGGTGTCGTGTGGTGCGACCACAT-3′ (forward) and 5′-CGCTGCTGAGCTGTCAGCGGAGGA-3′ (reverse). The putative binding site sequence of E2F-1/BRD2 complex in RasGRP1 promoter was projected by online PROMO algorithm analysis (http://alggen.lsi.upc.es/cgi-bin/promo_v3/promo/promoinit.cgi?dirDB=TF_8.3) [25, 26].
2.11 NOTCH1 mutation screening
NOTCH1 mutations in exons 26 (N-terminal region of the heterodimerization domain), 27 (C-terminal region of the heterodimerization domain), 28 (juxtamembrane domain), and 34 (transactivation domain and the proline-glutamine-serine-threonine domain) were sequenced [27]. The DNA samples to be tested were derived from fresh-frozen T-LBL tissues of 85 adult patients. Corresponding primer sequences are listed in Supplementary Table S1. PCR amplification in a 50-µL reaction unit containing 100 ng DNA, 20 µmol/L forward and reverse primers, and 0.25 µL Taq DNA polymerase (ThermoFisher Scientific) was performed using Bio-RAD PTC-200 PCR amplifier (Bio-RAD, Hercules, CA, USA). After the amplification products were separated on 1.5% agarose gels, the sequences was analyzed by ABI 3500XL system (Applied Biosystems) and classified as mutant or wild-type according to their NOTCH1 mutation status. NOTCH1 gene mutations were evaluated referring to NOCTH1 single nucleotide polymorphism (SNP) data from the NCBI SNP database (http://www.ncbi.nlm.nih.gov/projects/SNP/).
2.12 Ras pull-down assay
Ras pull-down assay was performed using an Active Ras Pull-Down and Detection Kit (ThermoFisher Scientific) according to manufacturer's instruction. Briefly, 1 × 10⁷ cells were lysed by lysis buffer. The supernatant of total lysate was incubated with guanosine triphosphate labeled on the gamma phosphate group with S (GTPγS) at 30°C for 15 min. After being resuspended with the agarose beads, GST-Raf1-RBD was added to the spin cup and incubated at 4°C for 1h. The agarose beads were washed with 400 µL washing buffer and centrifuged at 6000 × g for 10–30 sec. After washing for 3 times, protein samples were eluted from the agarose beads by heating the beads for 5 min at 95–100°C. Western blotting analysis was performed using anti-Ras antibody (1:200, ThermoFisher Scientific) and HRP-conjugated anti-mouse IgG (1:20,000, ThermoFisher Scientific).
2.13 In vivo tumor formation and patient-derived xenograft (PDX) assay
The in vivo study was approved by the Animal Care and Use Committee of Sun Yat-sen University Cancer Center (Guangzhou, Guangdong, China). All experiments were carried out in strict accordance with the established institutional guidelines and the USA National Institutes of Health (NIH) guidelines for the use of experimental animals.
In tumor formation assay, 5 × 10⁶ SUP-T1-BRD2-GFP cells that stably expressing BRD2 or SUP-T1-vector cells in 400µL PBS were injected subcutaneously into the back flanks of 4-week-old BALB/C-nu/nu athymic nude mice (Charles river, Beijing, China). Each group contained six mice. Tumor size was measured every four days. After 50 days, mice were euthanized, and tumors were dissected. Tumor volumes were calculated as follows: volume = 0.5 × L × W2, where L is the longest diameter and W is the shortest diameter.
In PDX assay, tumor cells were separated from 6 lymph node biopsies of Dox-resistant T-LBL patients. Tumor cells (5 × 10⁶) were injected into the back flanks of 4-week-old severe combined immunodeficient (SCID) mice (Charles river, Beijing, China) [28]. Each group contained six mice. Tumor size was measured every four days. After 36 days, mice were euthanized, and tumors were dissected. Tumor volume calculation method was the same as that of tumor formation assay.
2.14 Statistical analysis
Statistical analysis was carried out using SPSS (IBM Inc, Armonk, New York, USA). The Student t-test was used to analyze the continuous variables expressed as mean ± standard deviation. The Chi-square test was used to analyze the association between BRD2 expression and clinicopathological parameters. Univariate/multivariate analyses were used to analyse the correlation between variables and progression-free survival (PFS)/overall survival (OS). The survival curves were plotted by Kaplan-Meier analysis. Differences were considered significant when the P value was less than 0.05.
3 RESULTS
3.1 BRD2 is upregulated in drug-resistant T-LBL tissues
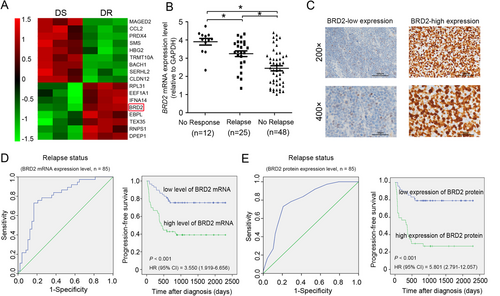
To identify drug resistance-related genes in adult T-LBL, we compared tumor samples from BFM chemotherapy-resistant patients with those from BFM chemotherapy-sensitive patients using gene expression microarray. With the 1.5-fold cut-off point (P < 0.001), 86 differentially expressed coding RNAs (65 upregulated and 21 downregulated in BFM chemotherapy-resistant tumor tissues) were detected (Figure 1A). Among them, BRD2 had higher expression level in BFM chemotherapy-resistant tumor tissues as compared to the BFM chemotherapy-sensitive counterparts. Additionally, it was one component indicator of the 11-gene-based classifier which could predict T-LBL prognosis [29]. Therefore, BRD2 was chosen for further validation. Semi-quantitative real-time PCR was used to detect the mRNA expression level of BRD2 in 85 fresh-frozen T-LBL samples. Consistent with the results of gene expression microarray, the mRNA levels of BRD2 were upregulated in T-LBL samples from patients who showed no response (no CR1) or relapse compared with those from patients without relapse (no relapse) (P < 0.05; Figure 1B).
3.2 Upregulation of BRD2 is correlated with short survival of adult T-LBL patients
To clarify the clinical significance of BRD2 expression in adult T-LBL, we examined the protein expression levels of BRD2 in 85 fresh-frozen T-LBL tissue samples by IHC (Figure 1C). The clinicopathological features of these 85 T-LBL patients are shown in Table 1. ROC curve analyses were applied to measure the relapse/survival prediction accuracy of BRD2 mRNA/protein expression level in T-LBL patients and chose the optimal cut-off for Kaplan-Meier analysis (Figure 1D and E and Supplementary Figure S1). By using the optimal cut-off value, Kaplan-Meier analysis revealed that high BRD2 mRNA/protein expression levels were associated with short progression-free survival (PFS) and overall survival (OS) of adult T-LBL patients (all P < 0.001; Figure 1D and E and Supplementary Figure S1). Additionally, in univariate analysis, lactic dehydrogenase (LDH) concentration, Eastern Cooperative Oncology Group performance status (ECOG-PS), NOTCH1 status, and BRD2 mRNA expression level showed significant impacts on PFS and OS in adult T-LBL patients (Supplementary Table S2). In multivariate analysis, after adjustment for these prognostic factors, BRD2 mRNA expression levels remained an independent prognostic factor for PFS and OS [PFS: hazard ratio (HR) = 3.758, 95% confidence interval (CI) = 1.284-8.911, P < 0.001; OS: HR = 3.168, 95% CI = 1.628-6.264, P < 0.001; Supplementary Table S2].
3.3 BRD2 induces drug resistance in T-LBL both in vitro and in vivo
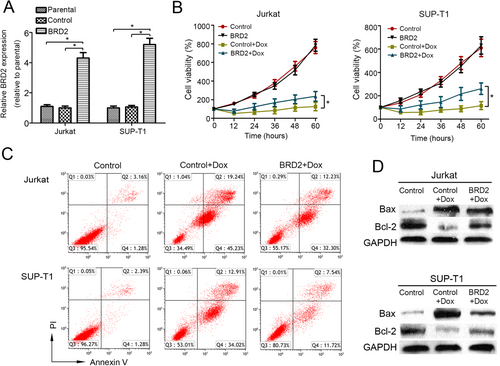
To explore the potential drug resistance-related effects of BRD2 in T-LBL, BRD2 was cloned and transfected into Jurkat and SUP-T1 cells. The stable overexpression of BRD2 was confirmed by semi-quantitative real-time PCR (Figure 2A) and Western blotting (Supplementary Figure S2). MTT assay showed that BRD2 overexpression didn't affect the proliferation but induced Dox resistance in both Jurkat and SUP-T1 cells (Figure 2B). Flow cytometry analysis also confirmed that the percentage of apoptosis cells induced by Dox was significantly decreased in the two cell lines that overexpressing BRD2 (Figure 2C and Supplementary Figure S3). To further assess apoptosis in response to different BRD2 expression levels, we examine the expression of apoptotic regulatory proteins (Bcl-2 and Bax) after Dox treatment. We found that Bax expression was downregulated and Bcl-2 expression was upregulated in BRD2-overexpressing cells as compared to their control counterparts after Dox treatment (Figure 2D). These results indicated that BRD2 induced drug resistance in T-LBL cells in vitro.
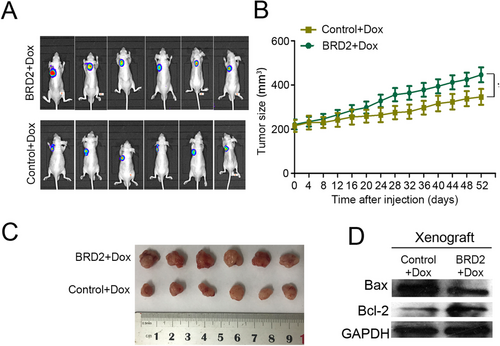
To verify whether BRD2 could also reduce Dox-induced cytotoxicity in vivo, SUP-T1-BRD2-GFP cells and control SUP-T1 cells were inoculated into female athymic nude mice, respectively. All mice were treated with Dox (1 mg/kg/time) 3 times a week. Consistent with in vitro study, the expression of BRD2 didn't affect the growth of T-LBL xenografts (Supplementary Figure S4), but suppressed the antitumor effect of Dox (Figure 3A and Supplementary Figure S5). Xenograft from nude mice injected with SUP-T1-BRD2-GFP cells grew much faster and gained more weight on day 52 (xenograft volume = 446 ± 43 mm3) compared with the xenografts from control SUP-T1 cells treated mice (xenograft volume = 338 ± 55 mm3, Figure 3B and C). The protein expression of Bax and Bcl-2 was examined to evaluate the apoptosis in xenografts tissues. As expected, the downregulation of Bax and upregulation of Bcl-2 were observed in xenografts formed by SUP-T1-BRD2-GFP cells than those formed by control SUP-T1 cells (Figure 3D).
3.4 BRD2 induces drug resistance of T-LBL by activating the MEK/ERK/c-Myc signaling pathway
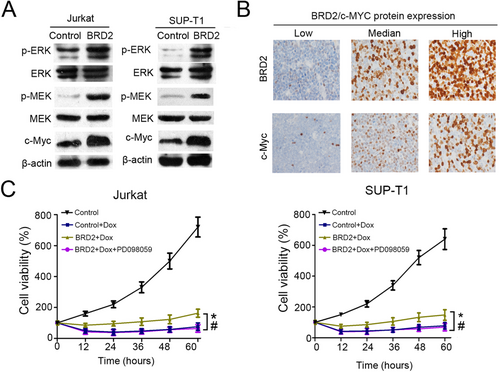
A previous study has shown that the upregulation of BRD2 led to an increase in ERK1/2 phosphorylation [30]. Therefore, we speculated that the activation of the ERK signaling pathway might be responsible for the Dox resistance effect of BRD2. Indeed, we found that the levels of p-ERK and p-MEK were significantly increased in BRD2-overexpressing cells compared with control cells (Figure 4A) [31]. As c-Myc is an important downstream effector of the ERK signaling pathway and closely related to drug resistance [32], we further examined c-Myc protein expression in 85 adult T-LBL tissues. As shown in Figure 4A, the expression of c-Myc was significantly increased in BRD2-overexpressing cells. Furthermore, IHC staining was performed to detect c-Myc-positive cells in 85 adult T-LBL tissues (Figure 4B). We found a positive relationship between the percentage of c-Myc-, p-ERK-, or p-MEK-positive cells and that of BRD2-positive cells by Pearson correlation analysis (all P < 0.001; Supplementary Figure S6). To confirm whether the drug-resistance effect of BRD2 depends on the MEK/ERK signaling pathway, we used PD098059, a MEK inhibitor, to block the MEK/ERK signaling pathway in BRD2-overexpressing cells. The MTT assay showed that PD098059 could reduce Dox resistance which was induced by BRD2 (Figure 4C). The above data demonstrated that BRD2 induces Dox resistance of T-LBL by activating the MEK/ERK/c-Myc signaling pathway.
3.5 BRD2 activates the MEK/ERK signaling pathway via upregulation of RasGRP1 expression directly in T-LBL
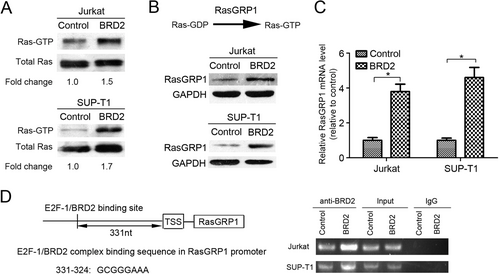
Ras is an upstream activator of the MEK/ERK kinase cascade [33]. To investigate how BRD2 activates the MEK/ERK signaling pathway, we examined the protein levels of RasGTP using RasGTP pull-down assay. We found that RasGTP/total Ras protein was enriched in BRD2-overexpressing cells as compared with control cells (Figure 5A). Since Ras guanyl-releasing protein 1 (RasGRP1) was reported as a vital mediator for conversion between RasGTP and RasGDP [34], we examined the protein and mRNA levels of RasGRP1 in BRD2-overexpressing cells. We found that both the protein and mRNA levels of RasGRP1 were increased in BRD2-overexpressing cells when compared with control cells (Figure 5B and C). As BRD2 is mainly expressed in nuclei, we speculated that BRD2 might promote the transcription of RasGRP1 gene by directly binding to its promoter region [12]. By using the online PROMO algorithm tool [26], we identified a putative E2F-1/BRD2 binding site on the promoter region of RasGRP1. Subsequently, ChIP assays proved that BRD2 bound directly to the promoter of RasGRP1 (Figure 5D).
3.6 OTX015 showed potential efficacy on T-LBL
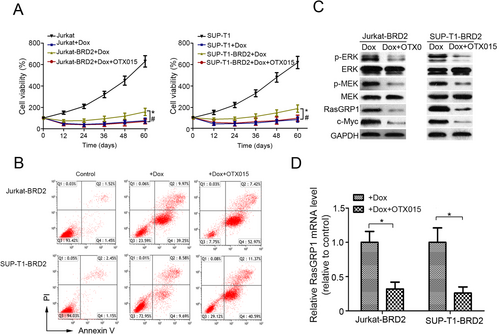
OTX015, an inhibitor of BET protein, has been shown to specifically inhibit BRD2 [16, 17]. In this study, we investigated whether it could suppress the Dox resistance induced by BRD2. MTT assay demonstrated that OTX015 significantly decreased the viability of BRD2-overexpressing cells under the treatment of Dox (Figure 6A). The flow cytometry analysis also showed that OTX015 obviously increased the percentage of apoptotic BRD2-overexpressing cells treated with Dox (Figure 6B and Supplementary Figure S7). Furthermore, we observed a noticeable protein level decline of p-ERK, p-MEK, RasGRP1, and c-Myc in both BRD2-overexpressing cell lines subjected to OTX015 (Figure 6C). In addition, the mRNA levels of RasGRP1 were also reduced in these cells (Figure 6D). The above data implied that OTX015 might be a candidate drug for the treatment of T-LBL.
3.7 The efficacy of sequential treatment is superior to simultaneous treatment when Dox are used in combination with OTX015 in adult T-LBL PDX-bearing mice
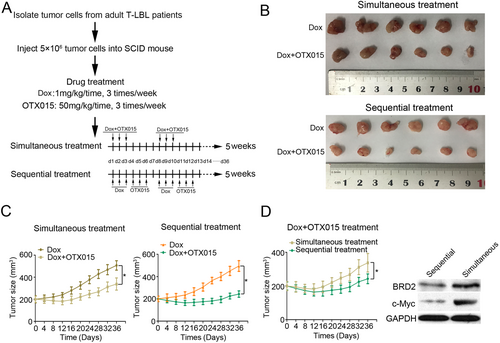
We used a PDX model to evaluate the efficacy of sequential and simultaneous treatment of Dox combined with OTX015, respectively. The treatment process is summarized in Figure 7A. Consistent with in vitro experiments, the drug combination in either sequential or simultaneous administration showed stronger therapeutic effect than Dox alone (Figure 7B and 7C). OTX015 enhanced the antitumor effect of Dox on T-LBL PDXs (Figure 7B and 7C). Furthermore, PDXs subjected to sequential treatment were measured to be obviously smaller (mean tumor volume = 243 ± 33 mm3) than those subjected to simultaneous treatment (mean tumor volume = 338 ± 48 mm3) on day 36 (Figure 7D). In addition, we found that the protein expression of BRD2 and c-Myc were decreased in the sequential treatment group (Figure 7D). The above data demonstrated that drug-resistant T-LBL patients might benefit from sequential use of OTX015 after Dox.
4 DISCUSSION
BRD2 was initially identified as a homologue of TATA box-binding protein-associated factor (TAF) II 250. It was proved to be a transcription mediator which functions as an essential component of transcription complexes, participating in interpreting the histone code and remodeling chromatin [35]. Some studies indicated that BRD2 could act as either transcriptional co-activator or co-repressor, which depends on the binding members of transcriptional complexes [36]. In this study, we observed that the expression of BRD2 was upregulated in chemotherapy-resistant T-LBL samples and was correlated with short PFS and OS of adult T-LBL patients. Furthermore, we discovered that the upregulation of BRD2 decreased the cytotoxicity of Dox both in vitro and in vivo. A large cohort study (n = 613) identified BRD2 as a component genetic indicator of the 11-gene-based classifier which could predict the PFS, DFS, and OS of adult T-LBL patients [29]. These data implied that BRD2 might play an important role in T-LBL drug resistance.
Several studies have demonstrated that BRD2 overexpression could activate the ERK signaling pathway and affect drug resistance [30, 37]. Additionally, c-Myc is an important downstream effector of the ERK signaling pathway [38]. Thus, we analyzed the phosphorylation status of MEK and ERK and the expression of c-Myc in T-LBL cells with BRD2 overexpression. The increased level of p-MEK, p-ERK, and c-Myc was convinced in BRD2-overexpressing cells. The correlation between c-Myc and BRD2 was further verified in tumor tissues from adult T-LBL patients. In addition, the cytotoxicity of Dox could be restored by using a MEK inhibitor in BRD2-overexpressing T-LBL cells. These results demonstrated that BRD2 might affect the cytotoxicity of Dox by activating the MEK/ERK/c-Myc signaling pathway.
The transformation from RasGDP to RasGTP activates MEK phosphorylation and thereby activates downstream p-ERK [34]. We found that the protein level of RasGTP was significantly increased in BRD2-overexpressing T-LBL cells. A previous study has reported that BRD2 bound to transcriptional activators E2F1 and that E2F1 was a component of the BRD2 nuclear complex [36]. E2F1 induces ERK activation via a transcriptional mechanism and upregulates the expression of guanine nucleotide exchange factor RasGRP1 [39]. Subsequently, we detected the protein expression and mRNA levels of RasGRP1, which promote Ras activation. The results showed that both protein expression and mRNA levels of RasGRP1 were increased in two BRD2-overexpressing T-LBL cell lines. Considering that BRD2 can function as either a transcriptional co-activator or co-repressor [36], we speculated that BRD2 could increase the transcription of RasGRP1. Given that, an online tool was first used to identify the putative binding site of BRD2/E2F1 in the RasGRP1 promoter sequence [25]. Then the ChIP assay was performed to confirm it. These data suggested that BRD2 increased the transcription level of RasGRP1, elevated RasGTP level, and thereby activated the MEK/ERK signaling.
BBIs targeting BET protein showed promising preclinical activities against many cancers [10]. Phase I clinical trials accessed the efficacy of OTX015 have been completed in some malignancies, such as acute leukemia, lymphoma, multiple myeloma, and non-small-cell lung cancer [18-20]. They showed inspiring therapeutic effect [16]. Therefore, we assumed that OTX015 could be used in developing the standard treatment for adult T-LBL patients. As expected, the combination of OTX015 and Dox showed a good anticancer effect in vitro. Furthermore, OTX015 reversed the Dox resistance induced by BRD2. The protein expression and mRNA level of RasGRP1, as well as the protein expression of c-Myc, were decreased after treated with OTX015. These data strongly implied that OTX015 could be used as a candidate component of standard treatment for adult T-LBL patients.
The drug combination strategy of chemotherapy and OTX015 needs further study. We applied the PDX model to investigate the priority between sequential and simultaneous treatments. In the PDX model, both sequential and simultaneous treatments showed good therapeutic effects than Dox alone. Furthermore, we found that the sequential treatment contributed to superior efficacy than simultaneous treatment. The protein expression of RasGRP1 and c-Myc decreased significantly in sequential treatment group. These results suggest that sequential treatment might be more effective in inhibiting the effects of BRD2 than simultaneous treatment. The drug-resistant T-LBL patients may benefit from sequential combination therapy clinically.
In summary, this study described the potential mechanism of drug resistance in adult T-LBL patients. We identified that the expression of BRD2 was upregulated in drug-resistant adult T-LBL samples. Functional studies of BRD2 further demonstrated the critical role of BRD2 in drug resistance for regulating the RasGRP1/MEK/ERK/c-Myc signaling pathway. Importantly, our results provided a basis for the clinical application of OTX015 in treating adult T-LBL. Targeting BRD2 may be a novel strategy to improve the therapeutic efficacy and prolong survival of adults with T-LBL.
DECLARATIONS
ETHICS APPROVAL AND CONSENT TO PARTICIPATE
This study was approved by the Institute Research Ethics Committee of the Sun Yat-sen University Cancer Center. Each participant signed an informed consent before participating to this study. All animal procedures were approved by the Sun Yat-sen University Cancer Center Committee.
CONSENT FOR PUBLICATION
Not applicable.
AVAILABILITY OF DATA AND MATERIALS
The key raw data have been uploaded onto the Research Data Deposit public platform with the approval RDD number of RDDB2020000795. The microarray data have been deposited in the Gene Expression Omnibus data base under accession number GSE143166.
COMPETING INTERESTS
The authors declare that they have no competing interests.
FUNDING
This work was supported by the grants from National Key R&D Program of China (2017YFC1309001 and 2016YFC1302305), National Natural Science Foundation of China (81603137, 81672686, and 81973384), and Special Support Program of Sun Yat-sen University Cancer Center (PT19020401).
AUTHORS' CONTRIBUTIONS
Q-QC, and X-PT designed the study. X-PT, JC, S-YM, H-QH, T-YL, H-LR, ML, Z-JX, T-BK, DX and Q-QC obtained and assembled the data. X-PT, JC, S-YM, YF and Q-QC analyzed and interpreted the data. X-PT, and Q-QC wrote the manuscript. X-PT, JC, S-YM and YF performed the statistical analysis. All authors reviewed the manuscript and approved the final version.
ACKNOWLEDGEMENTS
Not applicable.


