Effects of Fluorescent Tracer Additives on PET During Material Recycling
Funding: This work was supported by Ministerium für Wirtschaft, Arbeit und Tourismus Baden-Württemberg, BW1_2087/02.
ABSTRACT
The material properties and stable chemical structure of PET make it a frequently used polymer, for example, for packaging applications, and allow multiple recycling processes. Fluorescent tracer additives in polymer waste management may enhance the sorting quality of packaging waste streams by using the fluorescent signal of tracer additives introduced into the polymer matrix. Prior to field application of tracer additives, it is necessary to investigate tracer influence on the polymer matrix in general and, more specifically, in multiple recycling cycles. Therefore, PET with mineral tracer concentrations of 0, 10, 100, and 1000 ppm was extruded up to six times. To investigate changes in material properties, differential scanning calorimetry, intrinsic viscosity, spectroscopic analysis, tensile testing, and color measurements were performed. In parallel, the up-conversion photoluminescence of the tracer was quantified. Polymer degradation is generally induced by mechanical and thermal degradation during multiple processing cycles, leading to chain shortening, reduction of molecular weight, and the formation of new functional groups, as previously published in the literature. The results of the experiments indicate that tracer additives do not further affect the thermal, rheological, chemical, and optical polymer properties. Moreover, photoluminescent tracer properties are not affected by multiple polymer processing cycles.
1 Introduction
In 2021, global plastic production reached 390 Mio. t, with the European Union accounting for approximately 59 Mio. t [1]. Out of the European total, the packaging sector accounted for the largest proportion, representing approximately 21 Mio. t [1]. The most significant plastics within the packaging sector are the six thermoplastics low-density polyethylene (LDPE), polypropylene (PP), polyethylene terephthalate (PET), high-density polyethylene (HDPE), polystyrene (PS), and polyvinyl chloride (PVC) [1]. Among these, PET is particularly noteworthy due to the possibility of high-quality recycling [2]. Its stable chemical structure allows for multiple recycling cycles [3, 4], a quality that has contributed to its extensive use in both the food and non-food sectors over several decades [5-9].
One specific approach for PET beverage packaging recycling can be found with the German deposit system: A deposit is imposed on PET bottles filled with food content when they are purchased [10]. After usage, consumers can return the bottles to the point of sale, to reclaim their deposit. This system allows for a separate PET beverage bottle collection apart from public waste collection systems. This separate collection of PET bottles enables bottle-to-bottle recycling due to the high quality of the PET collected and European Food Safety Authority-approved recycling processes [9, 11, 12]. As a result, in Germany, a recycling rate for PET bottles of approximately 98% has been achieved, and in 2021, approximately 45% of newly produced PET bottles have been made from recycled PET [13].
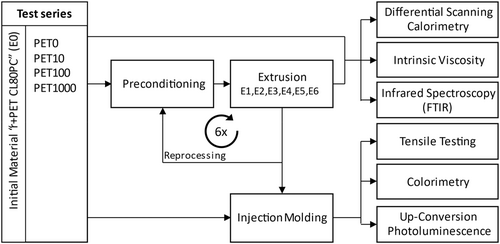
One innovative approach to identify and recycle PET packaging is the application of fluorescent tracer additives. This method enhances recovery and recycling, as already shown for PVC profile recycling [14]. Moreover, fluorescent tracer additives have the potential to be incorporated into the polymer to quantify its recycled content [15]. Prior to the utilization of tracer particles in packaging, it is essential to examine their impact on the polymer matrix and to ascertain that the fluorescence signal remains detectable even after multiple polymer processing cyles. The objective of this study is to examine the properties of tracer-added PET in recycling. The research question is which effects of fluorescent tracers can be observed and measured in multiple recycling cycles. Experiments aim to determine whether varying tracer concentrations affect the polymer properties and to determine the extent to which these concentrations influence the recyclability of the polymer. These investigations are completed with analyses of the up-conversion photoluminescence (UC PL) exhibited by the tracer additives. To this end, PET samples with tracer concentrations of 10, 100, and 1000 ppm and virgin PET were extruded and processed up to six times, after which they were examined regarding their thermal, rheological, chemical, mechanical, optical and photoluminescence properties (Figure 1).
2 State of Technology
The reprocessing of PET is typically accomplished through mechanical recycling, which involves sorting, shredding, solid-state condensation, melting, and extrusion [16]. However, with increasing processing cycles, these steps can lead to a deterioration of the product properties, mainly due to moisture and impurities [17, 18]. These trigger chain scission reactions in the material, which results in a reduction in the molecular weight of the recycled PET [8]. Deposit system PET collection results in a controlled quality with low contamination of collected PET bottles, while this is not the case for post-consumer PET packaging separated from curbside waste collection [9]. Here, the recycler has little or no control over the composition of the waste stream entering the recycling plant [19].
Packaging waste management is challenged by packaging design (e.g., packaging geometry, residual fill levels) [20, 21], the limitations of the identification methods available (e.g., contamination, separation of food, and non-food packaging), [20, 22-25] and the shortcomings of packaging items handling processes in sorting (e.g., geometries < 20 × 20 mm, rollable geometries) [20, 25-27]. In particular, the different PET types such as amorphous PET (PET-A), crystalline PET (PET-C), glycol-modified PET (PET-G), or PET multilayer cannot be separated by NIR-sorting technology [27], and hence, the high recycling potential cannot be fully exploited. First manufacturers offer sorting technologies that combine NIR technology with image recognition systems, enabling the differentiation of PET bottles and trays as well as the classification of different PET types.
The use of fluorescent additives and their spectral analysis could provide an additional means of polymer identification in recycling. Both organic molecules [28-30] and inorganic mineral-based materials [29, 31-33] can be used, which exhibit luminescence when exposed to specific irradiation. The excitation varies depending on the fluorescent additive from UV [28, 29, 31, 32], to VIS [30] or NIR [33] irradiation, whereas the fluorescence emission is mostly present in the VIS [28-32] or VIS–NIR [33, 34] spectrum. Concentrations from 0.1 [35] up to 6000 ppm [34] are being either incorporated into the polymer matrix [29-33] itself or on the packaging labels [28, 33]. The excitation and recognition require milliseconds only, and simple charge-coupled device (CCD) camera chips [36] are often sufficient as detector technology. In contrast to conventional spectroscopic methods such as NIR or color detection, which use direct material properties, fluorescent additives introduce an additional distinguishing feature for material-independent identification and sorting. This feature may be used for allocation of preferred technical and/or economic recycling paths, such as the separation of multilayer packaging, the separation of certain polymer types, or even food or non-food packaging [28, 36, 37].
Numerous researchers, corporations, and institutions have been researching fluorescent additives for polymer recycling since the 1990s [38]. Experiments of inorganic fluorescent tracers incorporated at a concentration of 25 up to 250 ppm into PP and ABS did not alter the mechanical properties (impact strength, tensile strength, flexure) [32]. Massardier et al. [31] used inorganic fluorescent additives at a concentration of 1000 ppm in PP. They examined the mechanical and thermal properties depending on the dispersion of the fluorescent additive in the polymer matrix, simulated by increasing extruder screw speeds, showing a homogeneous dispersion contributes to maintaining mechanical properties. The thermal properties (melting and crystallization temperature) remained mainly unchanged, and only the crystallinity degree increased slightly with a more homogeneous dispersion. The multiple processing (2-times) of PP, LDPE, PLA (polylactic acid), and PMMA (poly(methyl methacrylate)) with 10–20 ppm organic fluorescent tracers has been described by Kuřitka et al. [30]. The authors reported that the carbonyl groups remained unchanged for all four polymers during reprocessing.
Other publications [29, 32, 39] described the aging test of polymers with fluorescent additives incorporated but evaluated the alteration of the fluorescence signal only. Ahmad [29] has shown that fluorescent additives can be incorporated into PET and that they are chemically stable at PET processing temperatures, but no further experiments have been conducted. Pilon et al. [28] use fluorescent additives to differentiate PET bottles for food and non-food applications, but they place the organic fluorescent additive on the bottle as part of a water-based varnish.
3 Experimental
Preforms made of industrial-quality recycled PET, labeled as r + PET CL 80PC (PET Recycling Team GmbH, Germany), were provided by an industrial research partner with 10, 100, and 1000 ppm of fluorescent tracer additive and as a reference without any tracer (0 ppm). The test series are labeled PET10, PET100, and PET1000 and the reference sample as PET0 respectively, in accordance with their respective tracer concentration. The preforms are reground using a cutting mill SM 200 (Retsch, Germany) and a 4 mm bottom sieve.
The fluorescent tracer additive used is comercially available up-conversion micro-crystals with a volume-based mean particle size of 7.6 μm, made of gadolinium oxysulfide doped with ytterbium and erbium (Gd2O2S:Yb3+, Er3+) [40]. The tracer additive shows UC PL peaks in red (660 nm) and green (525 and 540 nm) color when excited with a 980 nm NIR light source [33, 40].
Mechanical recycling (Figure 1) was simulated by subjecting all test series (with and without tracer) to multiple processing (up to six times) in a co-rotating twin-screw extruder (barrel length 40 L/D) Process 11 (Thermo Scientific, USA). The extruder maintained a temperature profile of 300°C–290°C–280°C from the feeder to the die with a screw speed of 100 rpm. No additives were introduced during processing between reprocessing cycles. Finally, the extrudate underwent cooling in a water bath before granulation using Process 11 VariCut (Thermo Scientific, USA). The samples are named according to the extrusion cycle (e.g., E1, E2) with E0 being compounded but not reprocessed PET.
Before and after each processing step, the material was dried in a vacuum dryer VT 6025 (Thermo Scientific, USA) at a temperature of 140°C for 4 h under a pressure of 300 mbar to eliminate hygroscopic water and for solid-state condensation. The material was then stored in a desiccator.
For tensile testing, type 1BA test specimens [41] were produced through injection molding using the piston injection molding machine MCP 30 KSA machine (HEK, Germany). The material was processed at a temperature of 260°C and subjected to a pressure hold for 15 s.
3.1 Differential Scanning Calorimetry
Differential scanning calorimetry (DSC) was utilized to assess the impact of reprocessing on melting behavior and crystallinity. DSC experiments were performed using a DSC 200 (Netzsch, Germany) under an air atmosphere. The aluminum pans were sealed with 10 mg samples, and triplicate measurements were taken for each sample to calculate the mean values. The samples were heated from a temperature of 25°C above the equilibrium temperature (300°C) at a heating and cooling rate of 20 K min−1, using a heating/cooling/heating program. The initial heating procedure is proceeded by a 5-min isothermal hold to eliminate thermal history. Prior to the second heating, the temperature is sustained isothermally at 25°C for 5 min.
From DSC thermograms, glass transition temperature (T g ), peak temperature of cold crystallization (T cc ), cold crystallization enthalpy (ΔH cc ), peak melting temperature (T m ), and melting enthalpy (ΔH m ) were recorded for the first and second heating scans. The glass transition temperature was determined according to ISO 11357-2:2020 [42] using the half-step height method. In the cooling scan, the peak crystallization temperature (T c ), crystallization enthalpy (ΔH c ), and the crystallization rate using the full-width half maximum (FWHM) [43] were recorded. The enthalpy was determined using a sigmoidal baseline.
3.2 Intrinsic Viscosity
The intrinsic viscosity (IV) of PET was determined by a subcontractor in accordance with ISO 1628-5:2015 [47]. To prepare the samples, they underwent conditioning in a vacuum oven at 400 mbar at 120°C for 3 h. Afterward, the samples were dissolved in a phenol/1,2-dichlorobenzene mixture at 90°C for 30 min with a concentration of 0.005 g/mL. An Ubbelohde viscometer with capillary ion chromatography was employed for measuring the IV. Each sample was measured twice, and the mean value was calculated.
3.3 Infrared Spectroscopy
The spectroscopic analysis was conducted using the spectrometer Alpha FTIR-ATR-Platinum (Bruker, USA) with its software OPUS (Version 7.5). For each reprocessing cycle, 11 granule samples were measured with 10 scans each and a resolution of 4 cm−1 from 4000 to 400 cm−1 wavenumber.
3.4 Tensile Testing
The tensile modulus E t , tensile strength σ m , tensile strength at break σ b , and elongation at break ε tb were determined by tensile tests in accordance with ISO 527-1:2019 [53]. The tests were carried out using the universal testing machine 112.20kN (TesT, Germany) with TesTWinner 922 software version 5.1.5 at a test speed of 5 mm/min and a gauge length of 55 mm. The injection molded standard specimen of type 1BA was used [41]. All specimens were pre-conditioned for a minimum of 16 h in a vacuum drying oven at 60°C and 300 mbar absolute pressure, followed by storage in a desiccator. Five specimens of each sample were measured, and the mean value was calculated.
3.5 Colorimetry
For colorimetry measurements, the CM-700d spectrophotometer (Konica Minolta Sensing, Japan) was used. The measurements are executed using the D65 standard illuminant and 10° standard observer in the CIELAB color space as outlined in ISO/CIE 11664–4:2019 [54]. Injection-molded specimens of type 1BA [41] are consistently used for all test series. For each test series and reprocessing cycle, six different specimens are tested three times on both sides of the part away from the sprue. Subsequently, the mean value for L (black-white), a* (green-red), and b* (blue-yellow) is determined, which tracks changes in sample yellowness. As PET samples are translucent, a uniform black background was used.
3.6 Up-Conversion Photoluminescence
A measurement setup employing a 980 nm line laser (FC-W-980A-25 W, CNI Laser, China) with an output power of 15.5 W and silicon photo detectors (Polysecure, Germany) for the green, red, and infrared color channels is utilized to record the up-conversion photoluminescence. The individual color channels record the spectrum of each individual pixel. The green channel integrates the area from 538 to 562 nm, the red channel from 635 to 693 nm, and the infrared channel from 780 to 820 nm. As samples, injection-molded tensile bars of type 1BA [41] are used. For each test series and each reprocessing cycle, five tensile bars are measured five times each, resulting in a arithmetic mean fluorescence value derived from 25 measurements each. The emission signal is determined by passing the samples completely through a laser curtain and subsequently calculating the sum of the fluorescence observed across the entire sample area for both the green and red channels. As a constant laser power was selected for all test series, the values for PET samples with 1000 ppm are found just below the saturation point of the detectors, whereas the PET samples' signals with 10 ppm test series are at the lower detection limit. To compare the fluorescence values between the test series, the recorded signals are normalized with the fluorescent tracer additive concentration.
4 Results and Discussion
4.1 Differential Scanning Calorimetry
4.1.1 First Heating Scan
The first heating scan reveals a reduction in glass transition temperature T g across all test series (e.g., T g,PET10,E0 = 84.0 ± 2.4°C, T g,PET10,E6 = 80.0 ± 0.9°C), with the lowest T g (T g,PET0,E6 = 78.9 ± 0.7°C) in the PET0 test series (Table 1). The reduced T g can be attributed to either thermal and mechanical degradation, which leads to chain scission, increased chain mobility, and a reduction in molecular weight [55], or the heightened presence of moisture at a hygroscopic level due to incomplete drying [48].
| E | First heating scan | Second heating scan | |||||||
|---|---|---|---|---|---|---|---|---|---|
| PET0 | PET10 | PET100 | PET1000 | PET0 | PET10 | PET100 | PET1000 | ||
| T g [°C] | 0 | 82.3 ± 2.3 | 84.0 ± 2.4 | 84.5 ± 1.2 | 82.7 ± 1.3 | 79.1 ± 1.2 | 78.9 ± 1.2 | 79.5 ± 1.3 | 79.3 ± 0.7 |
| 1 | 82.4 ± 0.6 | 82.5 ± 0.8 | 82.5 ± 0.1 | 81.5 ± 1.0 | 79.3 ± 1.8 | 79.4 ± 2.1 | 78.9 ± 1.3 | 79.4 ± 2.3 | |
| 2 | 79.6 ± 0.5 | 82.5 ± 0.8 | 83.6 ± 0.3 | 82.3 ± 0.2 | 79.0 ± 2.4 | 78.6 ± 1.5 | 79.5 ± 1.2 | 79.1 ± 0.7 | |
| 3 | 79.1 ± 0.4 | 83.0 ± 0.5 | 82.6 ± 0.3 | 81.6 ± 0.3 | 79.4 ± 1.3 | 79.9 ± 0.9 | 79.6 ± 0.9 | 79.8 ± 0.8 | |
| 4 | 80.7 ± 3.5 | 82.2 ± 0.2 | 82.7 ± 0.5 | 82.1 ± 0.5 | 79.5 ± 2.5 | 79.2 ± 2.2 | 78.9 ± 2.1 | 79.5 ± 0.7 | |
| 5 | 79.7 ± 0.7 | 80.9 ± 1.1 | 81.3 ± 0.6 | 81.4 ± 0.6 | 79.4 ± 1.8 | 79.6 ± 1.1 | 79.1 ± 0.8 | 79.7 ± 0.7 | |
| 6 | 78.9 ± 0.7 | 80.0 ± 0.9 | 81.9 ± 0.4 | 81.4 ± 0.3 | 79.8 ± 1.0 | 79.7 ± 1.1 | 79.3 ± 0.8 | 79.5 ± 0.9 | |
| T cc [°C] | 0 | 140.4 ± 1.5 | 139.9 ± 0.8 | 140.5 ± 0.2 | 139.7 ± 0.4 | ||||
| 1 | 136.8 ± 1.5 | 133.9 ± 0.4 | 136.4 ± 0.3 | 136.6 ± 0.5 | |||||
| 2 | 133.7 ± 0.4 | 135.9 ± 0.5 | 136.9 ± 0.1 | 135.7 ± 0.2 | |||||
| 3 | 132.8 ± 0.5 | 135.2 ± 0.3 | 134.9 ± 0.1 | 133.7 ± 0.2 | |||||
| 4 | 134.0 ± 7.0 | 134.4 ± 0.2 | 134.4 ± 0.2 | 133.0 ± 0.2 | |||||
| 5 | 129.4 ± 0.6 | 132.6 ± 0.4 | 132.9 ± 0.8 | 132.5 ± 0.5 | |||||
| 6 | 127.4 ± 0.4 | 132.1 ± 0.8 | 132.2 ± 0.2 | 131.6 ± 0.1 | |||||
| T m [°C] | 0 | 252.8 ± 0.4 | 252.8 ± 0.4 | 252.2 ± 0.8 | 252.2 ± 0.3 | 250.6 ± 0.8 | 251.4 ± 0.2 | 251.3 ± 0.0 | 251.3 ± 0.1 |
| 1 | 251.9 ± 0.5 | 251.2 ± 0.2 | 250.9 ± 0.2 | 250.4 ± 0.5 | 249.6 ± 0.3 | 249.4 ± 0.1 | 250.2 ± 1.0 | 250.9 ± 0.2 | |
| 2 | 251.0 ± 0.3 | 252.7 ± 0.3 | 252.2 ± 0.1 | 252.9 ± 0.5 | 250.3 ± 0.5 | 250.1 ± 0.9 | 249.5 ± 0.5 | 249.9 ± 0.5 | |
| 3 | 251.5 ± 0.1 | 252.9 ± 0.3 | 252.7 ± 0.2 | 252.9 ± 0.5 | 250.0 ± 0.4 | 250.8 ± 0.7 | 250.5 ± 0.8 | 250.3 ± 0.9 | |
| 4 | 252.8 ± 1.0 | 253.6 ± 0.4 | 252.9 ± 0.1 | 253.8 ± 0.2 | 250.2 ± 0.4 | 250.8 ± 0.6 | 251.0 ± 0.2 | 250.5 ± 0.9 | |
| 5 | 253.5 ± 0.6 | 253.2 ± 0.3 | 254.1 ± 0.8 | 253.5 ± 0.1 | 250.2 ± 0.4 | 250.4 ± 0.5 | 250.0 ± 0.7 | 250.2 ± 0.8 | |
| 6 | 254.0 ± 0.1 | 253.4 ± 0.3 | 254.3 ± 0.1 | 254.1 ± 0.4 | 249.8 ± 0.4 | 249.7 ± 0.5 | 250.2 ± 0.5 | 250.0 ± 0.6 | |
| ΔH cc [J g−1] | 0 | −10.4 ± 6.5 | −4.9 ± 2.4 | −9.8 ± 2.2 | −7.4 ± 2.1 | ||||
| 1 | −26.3 ± 0.3 | −25.9 ± 0.5 | −26.4 ± 0.5 | −27.9 ± 0.4 | |||||
| 2 | −28.7 ± 1.2 | −28.3 ± 0.9 | −28.0 ± 0.9 | −28.9 ± 0.2 | |||||
| 3 | −31.1 ± 2.0 | −29.2 ± 0.7 | −28.7 ± 0.5 | −29.4 ± 0.4 | |||||
| 4 | −26.7 ± 9.2 | −29.6 ± 0.7 | −30.2 ± 0.6 | −29.7 ± 2.2 | |||||
| 5 | −32.1 ± 1.3 | −30.6 ± 1.0 | −31.1 ± 0.6 | −30.4 ± 0.7 | |||||
| 6 | −34.0 ± 1.7 | −30.5 ± 1.1 | −31.2 ± 0.6 | −31.4 ± 0.3 | |||||
| ΔH m [J g−1] | 0 | 40.9 ± 3.7 | 44.9 ± 3.9 | 40.1 ± 0.5 | 45.1 ± 1.4 | 41.5 ± 4.6 | 43.1 ± 2.9 | 41.4 ± 3.0 | 44.8 ± 0.2 |
| 1 | 36.4 ± 0.5 | 38.8 ± 0.6 | 39.1 ± 2.8 | 43.6 ± 2.7 | 36.4 ± 0.5 | 35.2 ± 0.8 | 38.3 ± 4.3 | 44.5 ± 1.2 | |
| 2 | 44.6 ± 4.5 | 41.7 ± 1.4 | 40.4 ± 1.1 | 42.0 ± 1.0 | 42.3 ± 5.7 | 39.1 ± 4.7 | 38.0 ± 1.7 | 36.5 ± 3.2 | |
| 3 | 44.6 ± 3.0 | 42.3 ± 0.7 | 45.5 ± 4.1 | 47.5 ± 4.2 | 43.7 ± 7.5 | 40.5 ± 3.3 | 42.2 ± 3.8 | 43.7 ± 4.6 | |
| 4 | 45.1 ± 4.2 | 46.9 ± 4.1 | 47.1 ± 0.5 | 48.6 ± 6.3 | 44.6 ± 4.0 | 41.4 ± 4.0 | 45.3 ± 1.0 | 40.3 ± 6.0 | |
| 5 | 47.8 ± 2.3 | 46.7 ± 2.9 | 47.3 ± 2.4 | 44.0 ± 4.1 | 39.7 ± 2.9 | 42.3 ± 4.7 | 43.6 ± 3.1 | 39.1 ± 3.9 | |
| 6 | 54.2 ± 2.1 | 45.6 ± 1.7 | 48.2 ± 2.5 | 49.2 ± 3.0 | 48.5 ± 2.5 | 39.7 ± 3.6 | 40.5 ± 4.5 | 40.9 ± 3.3 | |
| Χ C [%] | 0 | 21.8 ± 3.9 | 28.6 ± 3.5 | 21.6 ± 1.2 | 27.0 ± 2.5 | 29.7 ± 3.3 | 30.8 ± 2.1 | 29.6 ± 2.1 | 32.0 ± 0.1 |
| 1 | 7.2 ± 0.4 | 9.2 ± 0.2 | 9.1 ± 1.7 | 11.2 ± 1.6 | 26.0 ± 0.3 | 25.1 ± 0.5 | 27.4 ± 3.1 | 31.8 ± 0.9 | |
| 2 | 11.4 ± 2.4 | 9.6 ± 0.5 | 8.9 ± 0.5 | 9.3 ± 0.7 | 30.2 ± 4.1 | 27.9 ± 3.3 | 27.2 ± 1.2 | 26.1 ± 2.3 | |
| 3 | 9.6 ± 0.8 | 9.3 ± 0.2 | 12.0 ± 2.8 | 12.9 ± 2.7 | 31.2 ± 5.4 | 29.0 ± 2.3 | 30.1 ± 2.7 | 31.2 ± 3.3 | |
| 4 | 13.1 ± 3.7 | 12.3 ± 2.8 | 12.1 ± 0.7 | 13.4 ± 3.0 | 31.9 ± 2.8 | 29.6 ± 2.9 | 32.3 ± 0.7 | 28.8 ± 4.3 | |
| 5 | 11.2 ± 0.7 | 11.5 ± 1.4 | 11.6 ± 1.4 | 9.7 ± 2.4 | 28.3 ± 2.1 | 30.2 ± 3.4 | 31.1 ± 2.2 | 27.9 ± 2.8 | |
| 6 | 14.5 ± 0.3 | 10.8 ± 0.5 | 12.2 ± 1.4 | 12.7 ± 1.9 | 34.7 ± 1.8 | 28.4 ± 2.6 | 28.9 ± 3.2 | 29.2 ± 2.4 | |
The DSC thermograms (Figure 2a,c) demonstrate the presence of both an exotherm and an endotherm peak. The exotherm peak, defined as cold crystallization, arises from the crystallization of the amorphous phase [17]. The temperature of the cold crystallization T cc decreases continuously in the first heating scan (T cc,PET10,E0 = 139.9 ± 0.8°C, T cc,PET10,E6 = 132.1 ± 0.8°C). This indicates that with increasing reprocessing cycles, crystallization becomes easier and therefore starts at lower temperatures [56]. This phenomenon is favored by shorter polymer chains [57]. Concurrently, the cold crystallization enthalpy ΔH cc increases with multiple reprocessing cycles. The virgin material hardly shows any cold crystallization (ΔH cc,PET10,E0 = −4.9 ± 2.4 J g−1) but has the highest T cc . The observed cold crystallization is a typical phenomenon for semi-crystalline polymers that have undergone quenching [17, 58], a process that is consistent with the cooling method employed for the samples, which were water-cooled after extrusion.
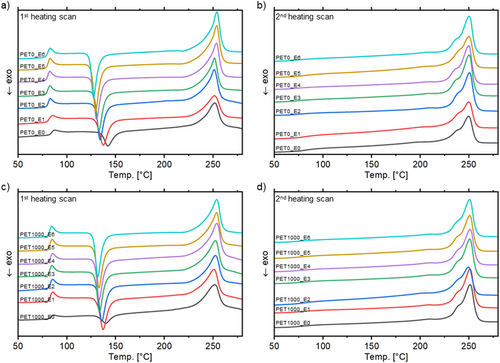
Melting temperature T m and melting enthalpy ΔH m initially decrease slightly in all test series (cf. Table 1) and then rise above the original value (T m,PET0,E0 = 252.8 ± 0.4°C, ΔH m.PET0,E0 = 40.9 ± 3.7 j g−1). This initial decrease can be attributed to chain degradation subsequent to the first mechanical processing, as shorter chains have lower thermal stability [45]. The subsequent increase in T m and ΔH m (T m,PET0,E6 = 254.0 ± 0.1°C, ΔH m.PET0,E6 = 54.2 ± 2.1 j g−1) is due to increasing crystallization and the formation of more stable crystalline structures [17].
The degree of polymer crystallization Χ C also declines strongly after the first reprocessing (Χ C,PET0,E0 = 21.8 ± 3.9%, Χ C,PET0,E1 = 7.2 ± 0.4%) and increases afterward slightly (Χ C,PET0,E6 = 14.5 ± 0.3%), but does not reach the original value. Multiple reprocessing cycles result in chain scission and a reduction of molecular weight, initially leading to a higher amorphous content. With subsequent reprocessing, the crystallinity increases but the original value of the virgin material is not regained, as degradation and the altered chain structure impose limits on the maximum achievable crystallinity.
4.1.2 Cooling Scan
In the cooling scans, the crystallization temperature (T c,PET0,E0 = 196.4°C ± 3.5°C, T c,PET10,E0 = 199. 4°C ± 0.2°C, T c,PET100,E0 = 199.3°C ± 0.2°C, T c,PET1000,E0 = 197.8°C ± 2.8°C), crystallization enthalpy (ΔH c,PET0.E0 = −51.2 ± 6.3 j g−1, ΔH c,PET10.E0 = −54.6 ± 4.4 j g−1, ΔH c,PET100.E0 = −52.1 ± 4.2 j g−1, ΔH c,PET1000.E0 = −53.8 ± 4.9 j g−1) and crystallization rate (FWHM PET0,E0 = 9.2 ± 2.0, FWHM PET10,E0 = 7.9 ± 0.1, FWHM PET100,E0 = 7.7 ± 0.0, FWHM PET1000,E0 = 9.6 ± 3.0) remain unchanged for both the test series and the reprocessing cycles. This indicates that the crystalline areas of the polymer remain thermally stable over multiple reprocessing cycles and exhibit high resistance to thermal decomposition. These results are in contrast to other studies in which T c and FWHM increase with multiple reprocessing, indicating earlier and faster crystallization [43, 46].
4.1.3 Second Heating Scan
In the second heating cycle, the glass transition step was significantly reduced and barely present in the majority of DSC thermograms (Figure 2b,d). The glass transition temperature in the second heating cycle was lower than that in the first heating cycle and does not change notably during multiple processing [45, 59]. The low visibility of the glass transition step may be attributed to a high degree of crystallization, indicating that only a few amorphous areas are present [55]. Additionally, no cold crystallization is observed, which corroborates the observations from T g that complete crystallization is present [52].
Compared to the first heating scan, T m is consistently lower. This phenomenon may be attributed to an enhanced contact between the sample and the crucible bottom, which may be caused by irregular geometries of the scraps. In contrast to the first heating scan, T m decreases slightly with each reprocessing cycle (T m,PET0,E0 = 250.6 ± 0.8°C, T m,PET0,E6 = 249.8 ± 0.4°C). The melting peak also shows a step-like shoulder in all test series and in each reprocessing cycle. During the cooling scan, primary and secondary crystals of varying stability and size are formed, which melt at different temperatures [45, 60, 61]. The observed step-like increase can be attributed to an overlap of individual melting peaks [46, 61]. At the same time, the onset melt temperature is decreased by about 10 K compared to the first heating scan, as small crystallized chains melt first [17, 59]. ΔH m exhibits a slight increase with an increasing number of reprocessing cycles, as the polymer is already highly crystalline. This is also reflected in the degree of crystallization, which also decreases slightly after the first reprocessing cycle and exceeds its original value after the sixth reprocessing cycle (Χ C,PET0,E0 = 29.7 ± 3.3%, Χ C,PET0,E1 = 26.0 ± 0.3%, Χ C,PET0,E6 = 34.7 ± 1.8%). A possible explanation for the increase in crystallinity could be the decrease in molecular weight induced by chain shortening during repeated thermo-mechanical stress [62-64].
Both heating scans demonstrate that regardless of their concentration the addition of tracer additives does not result in any alteration in the crystallinity between the test series. Consequently, the tracers do not act as nucleating agents and do not lead to increased crystallization in PET.
4.2 Intrinsic Viscosity
Based on IV measurements, assessments of the average molecular weight of the sample can be made. The results of the tests indicate a tendency for the IV to decrease as the number of reprocessing cycles increases (Figure 3). This indicates a decrease in average molecular weight [57, 65] of PET due to multiple processing [43, 45, 59]. This reduction in IV can be attributed to thermal and mechanical degradation during processing, leading to polymer chain scission [45, 59, 66, 67]. No discernable difference was observed between the individual test series (Figure 3). This implies that multiple reprocessing affects the IV and average molecular weight of PET, but not the addition of tracer additives.
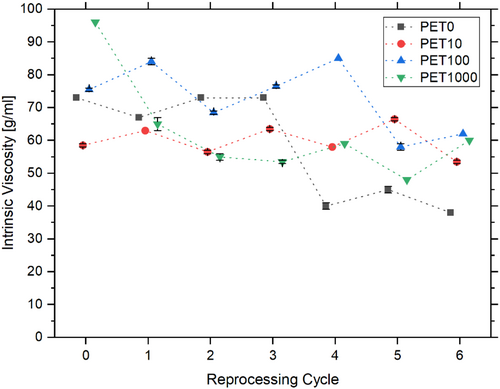
One notable observation is the significant decline in IV of the PET0 reference sample test series following the third reprocessing cycle (η PET0,E3 = 73.0 ± 0.0 g ml−1, η PET0,E4 = 40.0 ± 1.4 g ml−1). This deviation is attributable to process-related errors. Generally, the IV curves of all test series demonstrate abrupt changes, rather than a continuous decline as described by other authors [43, 59]. These fluctuations could be attributed to inconsistent process conditions, different mechanical loads experienced by the material during the individual reprocessing cycles, or handling errors in the measurement of the IV.
4.3 Infrared Spectroscopy
Infrared spectroscopy provides data to calculate the CI of the samples. This CI exhibits an increase in all test series following initial processing (Figure 4). Following the first processing cycle (CI PET0,E0 = 12.0 ± 2.1), the CI of the reference sample stagnates (CI PET0,E1 = 15.7 ± 1.1, CI PET0,E6 = 13.7 ± 1.6). No discernible difference is evident between the individual test series. The observed increase in the CI after the initial processing cycle indicates that oxidation of the polymer has occurred as a consequence of the reprocessing, resulting in the formation of additional carbonyl groups (C=O) [45, 57]. This process is particularly relevant when polymer chains are degraded and shortened [52]. The thermal and mechanical influences of extrusion facilitate this process. In addition to an increase in the carbonyl groups, no change could be detected in the other functional groups, such as the hydroxyl group (3030–2500 cm−1).
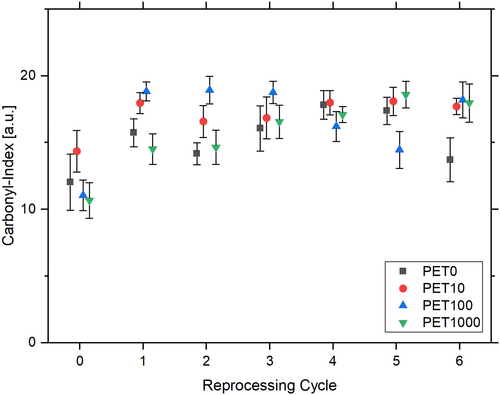
The observed stagnation of the CI is atypical for multiple processing and has been described as contradictory in various studies [45, 57]. These studies demonstrate an increase in carbonyl end groups due to multiple processing.
4.4 Tensile Testing
The multiple reprocessing of PET induces minimal changes of tensile modules E t and tensile strength σ m and slight declines compared to the virgin material (E t,PET10,E0 = 661.3 ± 31.8 MPa, σ m,PET10,E0 = 53.3 ± 2.0 MPa) to the sixth reprocessing cycle (E t,PET10,E6 = 558.2 ± 106.9 MPa, σ m,PET10,E6 = 51.6 ± 4.4 MPa) throughout all test series (Figure 5a,b). This is in line with findings of other researchers [45, 57, 59]. However, for the PET0 test series, a clear decrease in σ m can be observed after the third reprocessing cycle (σ m,PET0,E3 = 57.3 ± 1.2 MPa, σ m,PET0,E4 = 46.8 ± 5.9 MPa). This reduction may be attributed to processing issues, namely an increase in extrusion backpressure, which resulted in a chain shortening.
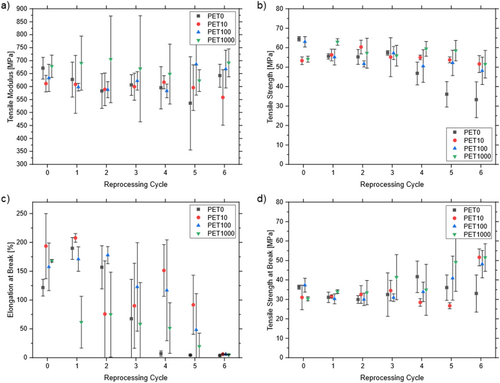
The elongation at break ε tb is influenced by the number of reprocessing cycles. As the number of reprocessing cycles increases, the specimens break before reaching their elastic limit (Figure 5c). For the PET1000 test series, the specimen exhibited a notable increase in brittleness following the first reprocessing cycle. The elongation at break for the PET0 test series exhibited a pronounced decline, reaching approximately 7% at the fourth reprocessing cycle. Following six reprocessing cycles, all test series exhibited brittleness, as evidenced by ε tb of 4% to 6%. The stress–strain diagrams corroborate this finding, demonstrating a progressive decline in the area under the stress–strain curve with each reprocessing cycle. This indicates a decline in the ductility of the polymer [68] The tensile strength at break σ b demonstrated minimal variation until the second reprocessing cycle (σ b,PET10,E0 = 30.1 ± 6.3 MPa), after which it showed a slight increase (σ b,PET10,E6 = 51.6 ± 4.4 MPa, Figure 5d). After the sixth reprocessing cycle, σ m and σ b exhibited identical values, indicating that PET had lost its plastic properties. Similar results were previously reported by other authors [45, 52, 56].
The observed results may be attributed to a reduction in molecular weight caused by chain scissions and a decrease in chain entanglements, which is induced by mechanical reprocessing [52, 56, 59]. Between the test series, significant differences were observed only for ductility (elongation at break) and for the PET0 reference sample test series after the third reprocessing cycle, after which the polymer properties underwent a sudden and unexpected change. No unexpected findings that could be related to tracer additive effects have been observed here.
4.5 Colorimetry
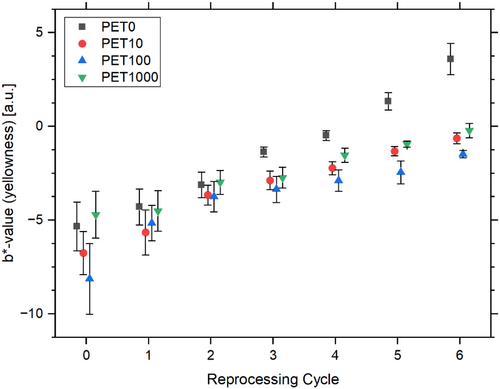
Colorimetry may quantify the visible effects of the polymer processing. Changes in color due to multiple reprocessing are particularly evident in the b* value, indicating a shift from a blue tone (negative b*) to a yellowish tone (positive b*) in all samples. A discernible shift in the yellow value can be observed between the first and second reprocessing cycles. This shift can be attributed to the consumption of the anti-yellowing additive [18]. The largest color change is observed for PET0 (b* PET0,E0 = −5.3 ± 1.3, b* PET0,E6 = 3.6 ± 0.8), while the values for PET10, PET100, and PET1000 are similar and show little variation between the sample series across all reprocessing cycles (Figure 6). The yellowing of PET is attributed to the formation of chromophoric substances, which is favored by chain scissions [45]. Additionally, thermo-oxidative degradation processes in the polymer may have been induced by repeated thermal processing under oxygen presence, resulting in yellowing [18, 69]. The a* and L values remain unaltered between the test series and the processing cycles, as well as the transparency properties. With regard to the yellowness, tracer additive use seems to have a rather minimizing effect on the colorimetry results.
4.6 Up-Conversion Photoluminescence
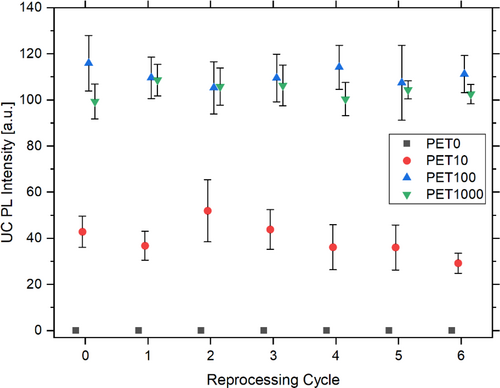
Fluorescence measurements were employed to detect the UC PL of the additive over each test series and reprocessing cycle. As anticipated, the PET0 test series exhibited no fluorescence signal (Figure 7). The PET10 (UC PLPET10,E0 = 42.8 ± 6.8, UC PLPET10,E6 = 29.3 ± 4.4), PET100 (UC PLPET100,E0 = 116.0 ± 12.0, UC PLPET100,E6 = 111.2 ± 8.1), and PET1000 (UC PLPET1000,E0 = 99.4 ± 7.6, UC PLPET1000,E6 = 102.6 ± 4.2) test series exhibit discernible fluorescence across all reprocessing cycles. It can be concluded that multiple reprocessing cycles have no impact on the fluorescent tracer additives whatsoever. In the PET100 and PET1000 test series, the UC PL signal is observed to scale linearly with the concentration of the fluorescence additives. Consequently, a 10-fold higher concentration results in a 10-fold stronger UC PL signal [33]. Along with the number of reprocessing cycles, a slight decrease in UC PL can be observed, which is mainly due to the yellowing of the samples [33, 70]. However, the UC PL signal remains clearly measurable. In practice, the measurement setup with a constant laser power has minimal relevance, as the additive is typically incorporated at a constant concentration, and the laser power is set for this specific additive concentration.
5 Conclusion
PET is one of the most relevant packaging materials used worldwide. As the use phase lengths of packaging are comparatively short, PET recycling is a pressing issue, and mechanical recycling is a relevant technology for PET. In mechanical recycling, material sorting is a key step to provide high-quality material flows. One innovative means to improve sorting quality can be seen in the use of fluorescent tracer additives. Consequently, the interaction of fluorescent additives with the PET matrix is the research subject. The research question is which effects of fluorescent tracers can be observed and measured in multiple recycling cycles. Furthermore, the objective is to investigate whether the fluorescence signal can still be detected after multiple reprocessing.
Fluorescent tracer additives in concentrations of 10, 100, and 1000 ppm were added to industrial standard packaging PET, and recycling was simulated by multiple reprocessing in a twin-screw extruder. While the degradation mechanisms of PET have yet been extensively discussed in the literature, there has been a research gap on the interaction between rare earth oxide-based tracer additives and PET during multiple recycling cycles. To fill this research gap, the effects on material properties were evaluated during six extrusion cycles by DSC measurements, IV measurements, infrared spectroscopy (FTIR), tensile tests, color measurements, and up-conversion photoluminescence.
The findings of the research indicate that tracer additives have no negative effects on the thermal, rheological, chemical, mechanical, and optical properties of PET. Moreover, the fluorescent signal remained detectable and practically unchanged regardless of the number of polymer reprocessing cycles. After the third processing cycle, the processing additives are nearly depleted, notable in a shift of the material properties. The DSC measurements indicate a decline in crystallinity over the recycling cycles. Comparison with the reference material shows that there is a change in the crystalline structure of the PET due to multiple processing only, but not due to the tracer additive. The IV values decrease with each recycling cycle. The CI investigation of the functional end groups reveals an initial increase in the carbonyl groups in all test series after the first processing, with minimal changes for all subsequent recycling cycles. Tensile testing reveals a slight decrease in tensile modulus and tensile strength. Elongation at break decreases strongly, reaching the point where no plastic properties after the sixth processing cycle at the latest can be observed. Furthermore, multiple recycling cycles result in a continuous increase in yellowness value.
The observed effects can be attributed to multiple processing of PET, as it has previously been published by other authors. Extrusion is associated with mechanical and thermal degradation processes, which leads to chain shortening and the formation of new functional groups (carbonyl groups), which in turn results in a decrease in molecular weight. In this study, for research reasons, the tests were conducted without the addition of additives. In industrial practice, due to the use of stabilizing additives, it can be anticipated that fewer polymer degradation processes may occur.
Consequently, these research results on the use of fluorescent tracer additives in PET packaging materials do not suggest any negative effects on key material properties in material recycling, even in multiple cycles. Detailed identification of the underlying mechanisms of these findings is still open though. Moreover, there is a possibility that the fluorescent tracers in other polymer matrices besides PET may create unwanted interactions with the polymer matrix. Consequently, further research on the detailed mechanisms and with other relevant polymers especially for packaging materials is regarded as necessary.
Author Contributions
Maximilian Auer: conceptualization (lead), data curation (lead), formal analysis (lead), methodology (lead), validation (lead), visualization (lead), writing – original draft (lead), writing – review and editing (equal). Jannick Schmidt: conceptualization (supporting), methodology (supporting), writing – review and editing (equal). Jörg Woidasky: conceptualization (supporting), funding acquisition (lead), methodology (supporting), writing – review and editing (equal).
Acknowledgments
The research presented here was made possible by a grant from the Ministry of Economic Affairs, Labor and Tourism Baden-Württemberg for the promotion of innovation and technology projects as part of the program “lnvest BW” with grants no. BW1_2087/02 under the supervision of the project executing organization VDI/VDE Innovation + Technik GmbH. The authors are thankful to Polysecure GmbH/Freiburg for the fruitful cooperation, the provision of tracer additive samples, and the experimental support for the measurenent of the up-conversion photoluminescence. The sole responsibility for this text is with the authors. Open access funding enabled and organized by Projekt DEAL.
Conflicts of Interest
The authors declare no conflicts of interest.
Open Research
Data Availability Statement
Data will be made available upon request.


