The effect of iron oxide nanoparticles on the mechanical relaxation of magnetic polymer hybrid films composed of a polystyrene matrix, a fractional calculus approach
ABSTRACT
A magnetic polymer hybrid film (MPHF) with a thickness of ~80 μm, composed of iron oxide nanoparticles (IONPs) in a polystyrene (PS) matrix, was successfully prepared. Its structure and morphology were analyzed by HRTEM, XRD, and FTIR. The optical and magnetic behaviors were studied by UV–Vis spectroscopy and VSM, respectively. The main relaxation of the MPHF was characterized by dynamic mechanical analysis (DMA), and the molecular mobility was analyzed by a fractional Zener model (FZM). Results obtained by DMA reveal the mechanical manifestation of the α-relaxation for both, PS and MPHF, and how this process is modified by IONPs into MPHFs. Good agreement between experimental DMA spectra and the theoretical results calculated from the FZM was obtained. Fractional parameters a and b characterize the molecular mobility at low and high temperatures, respectively. These results show that at low temperatures ( a parameter), molecular mobility is slightly affected by the presence of IONPs, while at high temperatures ( b parameter), molecular mobility is affected in a greater degree. IONPs decrease the molecular mobility of PS matrix; this effect is more pronounced at temperatures above the glass transition temperature. These results validate the effect of IONPs on PS matrix considering future applications of the MPHFs. © 2019 Wiley Periodicals, Inc. J. Appl. Polym. Sci. 2019, 136, 47840.
INTRODUCTION
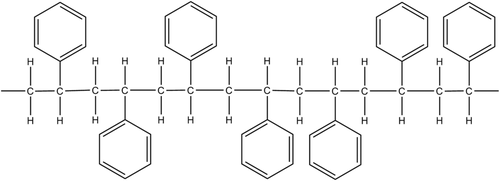
Magnetic polymer hybrid films (MPHFs), composed of iron oxide nanoparticles (IONPs) and polymer matrices, are of great interest to carry out functions as actuators or sensors in electronic or mechatronic devices.1-7 However, structural relaxations of the polymeric matrix must be studied to optimize the potential applications of these MPHFs. Several thermoplastic polymers can be used as the matrix, and polystyrene (PS) is one of the most important thermoplastic polymers in several areas of industry. PS macromolecules are synthesized by free radical vinyl polymerization, from the monomer styrene, in bulk and suspension processes, although solution and emulsion methods are also employed.8, 9 The relevance of PS in industry stems from the fact that it can be produced at low cost and it possesses many unique properties, such as good processability, stiffness or flexibility (with plasticizers), transparency, low water absorbability, and light weight.10, 11 From a scientific point of view, N. S. Perov,11 proposed the PS like a convenient and model polymer for the study of the effect of filler nanoparticles on the structural relaxation phenomena. According to him, the presence of phenyl group is sensitive to molecular packing and it can move as an independent unit (no cooperativity motions) and/or as the part of segment groups of PS chains (cooperative motions). Each group of chain segments must move simultaneously to participate in the relaxation process (cooperative segmental mobility). Figure 1 is a schema that shows how phenyl groups are the part of the atactic structure of a polystyrene chain segment.
The addition of IONPs into a PS matrix produces a synergy among them, such that the obtained MPHF responds to an external magnetic field with fast reaction and contactless control.1, 2, 7 Additional applications could also be obtained for MPHFs considering that the magnetic properties of IONPs are very important due to their potential integration into a broad range of technological applications, extending from magnetic fluids,12, 13 catalysis,14 ultrahigh-density magnetic storage media,15 biotechnology and biomedicine,13 and magnetic resonance imaging.16
IONPs could have a single magnetic domain structure, consisting of spins groups all pointing in the same direction and acting cooperatively.17, 18 By contrast, larger particles possess a multidomain structure consisting of many single domains separated by domain walls, which produce magnetic flux closures rendering the bulk material macroscopically as nonmagnetic.19 However, in these large particles under the action of an external magnetic field, the magnetic moments corresponding to domains are aligned with the external field, showing a magnetization process, which is known as paramagnetic behavior. For materials with a single magnetic domain, their magnetization process has no hysteresis loop, which means they are presenting a superparamagnetic behavior. Therefore, for IONPs smaller than 20 nm, they often display a superparamagnetic behavior at room temperature.18, 19
The strategic spatial dispersion of IONPs into PS matrix also modifies its structural relaxations. A relaxation process is related to molecular mobility leading to a new structural equilibrium with low-energy content, because the amorphous structure of PS is far from the thermodynamic equilibrium. The spectra of the molecular mobility of the PS matrix reflect the information about fine changes in its amorphous structure: the packing and conformational states of macromolecules.11, 20 In this sense, experimental measurements of the relaxation processes of MPHFs and its relationship with the corresponding molecular mobility is very important to optimize their potential applications. PS matrix can display three relaxation phenomena: the main relaxation (
α), associated to the glass transition process, and two secondary relaxations (
β and
γ).11 The
β-relaxation appears at lower temperatures
T than
T
α, and
γ-relaxation at lower temperatures than
T
β. The phenyl groups of PS take part in all relaxation processes above nitrogen liquid temperature. The
γ-relaxation is associated to the localized rotation of the phenyl group in the perpendicular direction of the chain axis, as noncooperative movements, with an activation energy of  . The
β-relaxation is a process associated to a volume fragment of an elementary unit (a segment chain) that includes one or several CH3 − CH − C6H5 repeat units, with an activation energy around
  . The
α-relaxation or glass transition process is associated to cooperative movements of several chain segments, with an activation energy of
  . Molecular mobility associated to secondary relaxations is less cooperative than molecular mobility associated to the main relaxation because the molecular motions of secondary relaxations are more localized than those corresponding to α-relaxation.11, 20, 22 In polymeric macromolecules, cooperative behavior of α-relaxation corresponds to simultaneous motions of chain segments due to the interference of neighboring chain segments. The cooperative segmental chain mobility is a phenomenon associated with mobility from tens to few hundreds of polymer repeat units and it is important to define the α-relaxation (glass transition). Conversely, a noncooperative behavior corresponds to localized movements, and the chain segments can move without being interfered by their neighbors, this scenario is achieved at temperatures above
T
α = T
g.
Relaxation phenomena in polymers are manifested by the evolution of thermodynamic or physical variables such as specific volume, enthalpy, mechanical modulus or loss tangent, dielectric permittivity, refractive index. One of the characterization techniques more frequently used to study relaxation phenomena in polymers is the dynamic mechanical analysis (DMA), since this can follow the evolution of the complex modulus (E* = E′ + iE′′) during the relaxation processes.
In this work, the DMA was used for the study of the effect of IONPs on the α-relaxation process of the PS matrix in the MPHF. The molecular mobility associated to experimental measurements of E* was analyzed by a fractional calculus approach, using a fractional Zener model (FZM). Fractional calculus is the branch of mathematics that deals with the generalization of integrals and derivatives of arbitrary (real and complex) orders.21 The application of fractional calculus to the study of structural relaxation of polymers is done by replacing two spring-pot elements instead of the dashpot element on the classical Zener model.21, 23 The spring pot combines the solid behavior (Hooke's law) with fluid behavior (Newton's law) by a differential operator of fractional order. In Ref. (21), this fractional order parameter has been related to cooperative molecular mobility of α-relaxation of poly(ethylene-2,6-napthalene dicarboxylate). Figure 2 shows the rheological elements of FZM and their corresponding constitutive equations that relates stress (σ) to deformation (γ). The constitutive equations of the two spring pots ( a and b) are characterized by differential operators of fractional order (between 0 and 1). The first spring pot ( a) has characteristically short relaxation times ( τ a) associated with rheological behavior in the region at high frequency (or low temperature). The second spring pot ( b) has characteristically long relaxation times ( τ b) associated with rheological behavior in the region at low frequency (or high temperature), and the springs represent the elastic behavior of the polymers. From these fractional parameters a and b, E* can be related to cooperative molecular mobility, and a better description of the main relaxation (glass transition) of polymers can be obtained.21

 and
and  are the fractional order derivative of the deformation with respect to time,
t, defined for the spring-pots
a and
b, respectively.
are the fractional order derivative of the deformation with respect to time,
t, defined for the spring-pots
a and
b, respectively.This work deals first with the experimental procedure (preparation of the MPHFs and the characterization techniques). After that, the results of the structural, morphological, optical, and magnetic characterizations of the MPHFs are described. Then, α-relaxation for both PS matrix and MPHFs samples were analyzed by DMA. Finally, the molecular mobility associated to experimental measurements of E* was analyzed using the FZM. These results will validate the effect of IONPs on PS matrix for future applications of MPHFs.
EXPERIMENTAL
Materials
All the chemicals reagents were used as received. An atactic PS was supplied by BASF (143E) with an average molecular weight of 250 000 g·mol−1. Ferrous chloride tetrahydrate (FeCl2·4H2O 99%) and tetrahydrofuran (THF ≥99%) were supplied from Fisher Co. Sodium hydroxide (NaOH 97%) and hydrogen peroxide (H2O2 3%) were supplied by Fermont and Zuum, respectively.
Preparation of MPHF
The preparation process to obtain the MPHF was performed in two stages. In the first one, a precursor hybrid film Fe(II)-PS was developed. In the second stage, Fe(II)-PS was used to prepare IONPs into PS matrix. Both stages are described in the next paragraphs.
Stage 1: The PS was dissolved in THF (PS/THF 15:85wt %) at 75 °C (348.15 K) and the FeCl2·4H2O was dissolved in THF (FeCl2·4H2O/THF 5:95wt %) at 45 °C (318.15 K). Both solutions were stirred separately for 45 min at 700 rpm. Subsequently, the precursor salt solution was slowly added to the polymer solution and the mix was stirred at 700 rpm and 45 °C (318.15 K) for 45 min. From the final solution, thin films were prepared by casting, separating solvent by natural convection process at room temperature for 24 h. The obtained films are the precursor material denominated by Fe(II)-PS.
Stage 2: The films obtained in stage 1 were immersed in an aqueous NaOH solution (6.7 M) at 45 °C (318.15 K) and then 30 mL of H2O2 was added dropwise. Finally, the obtained MPHF (IONPs/PS) was washed several times with deionized water to reduce residual products from the preparation process followed by being left in an atmosphere environment to dry.
Structural and Morphological Characterization
Transmission Electron Microscopy Testing
For the structural and morphological characterization, a Titan FEI transmission electron microscope was used in high-resolution mode (HRTEM). The samples were prepared by dispersing MPHF powder in water using an ultrasonic bath and placing an aliquot of the dispersion onto a copper grid.
X-Ray Diffraction Testing
To confirm the presence of crystallinity of the IONPs into MPHF samples, X-ray diffraction analysis (XRD) was carried out on a Bruker D8 Advance diffractometer using CuKα radiation at wavelength λ = 0.154 nm. Diffraction patterns were measured in 35 kV and 25 mA with 4.8 min−1 scan speed.
Fourier Transform Infrared Spectroscopy Testing
Fourier transform infrared spectroscopy (FTIR) was used to investigate the interfacial region between the IONP surfaces and the matrix. FTIR spectra were obtained using a Nicolet FTIR 6700 spectrometer in transmittance mode, using a wave number range from 4000 to 400 cm−1, 32 scans, and a resolution of 4 cm−1 for each spectrum. All samples were studied with thin film geometry.
UV–Vis Spectroscopy Testing
For the study of the optical properties, the UV–Vis absorption spectra were obtained by a Cary Series UV–Vis–NIR Spectrophotometer using an incident radiation wavelength between 200 and 700 nm. All samples were studied in a thin film form.
Vibrating Sample Magnetometer Testing
The magnetization behavior of the MPHF was carried out by a quantum design SQUID-VSM magnetometer at fields ranging from −70 to 70 kOe and for temperatures ranging from 4.2 to 300 K. The samples were analyzed in a pulverized form.
Dynamic Mechanical Analysis
All samples studied by DMA were analyzed by a Perkin Elmer DMA 8000, in tension mode, with a frequency range from 0.1 to 100 Hz. The sample was subjected to a controlled strain with an amplitude of 0.01 mm, a temperature range from 293 to 433 K was selected, using a heating ramp of 2 K·min−1. By isochronal conditions at several constant frequencies (0.1, 1, 10, and 100 Hz), the storage modulus (E’) and tan δ were registered for both PS matrix and MPHF samples. The dimensions of these film specimens were 21 mm in length, 7 mm in width, and 80 μm in thickness. The molecular mobility associated to experimental results of E* was analyzed by a fractional calculus approach, using the FZM.
RESULTS AND DISCUSSION
Results of the Structural and Morphological Characterization
Structural and morphological characterizations of MPHFs were developed using HRTEM, XRD, UV–Vis, and FTIR analysis.
Morphology and Crystallinity Characterization
Figure 3(a) is an HRTEM image, which allows to identify IONPs embedded into the PS matrix with a characteristic size of approximately 5.6 nm with a standard deviation of 0.72 nm. The average size of 5.6 nm was determined by a frequency histogram of the size distribution obtained by measuring 150 particles in different zones of the sample, Figure 3(c). Some aggregates, presumably of iron oxyhydroxide crystals, have been also presented with a flake-like shape with ∼26 nm size. The presence of these aggregates has been reported24-27 and associated to the effect of the aqueous ambient and the reaction temperature on the ions of the precursor salt, FeCl2·4H2O. Figure 3(b) shows the crystalline structure of the IONPs, presenting planes with interplanar distances of 0.2515 nm and 0.2957 nm, which correspond to planes (311) and (220), respectively; they are associated with a crystalline structure identified as maghemite.1
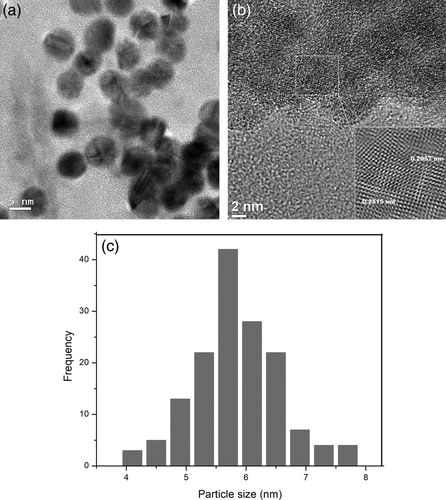
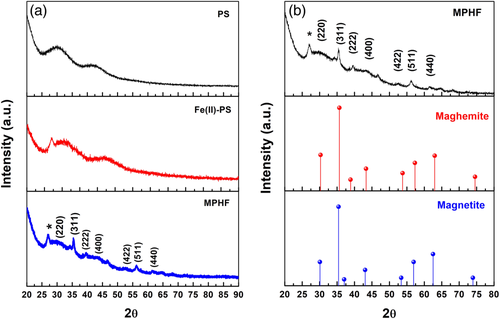
Figure 4(a) corresponds to the X-ray diffraction patterns obtained for PS-matrix, Fe(II)-PS, and MPHF samples, and Figure 4(b) is matching between diffractograms of MPHF sample and two standard iron oxide phases, maghemite and magnetite. From the PS matrix diffractogram, two scattered peaks associated to long-range order (without crystallization) are observed. They are produced due to the biorientation generated by the film's manufacturing process.1 These scattered peaks are characteristic of amorphous polymers diffractograms. In the X-ray diffraction pattern obtained for the Fe(II)-PS sample, it was corroborated by the absence of Fe crystals, confirming that the Fe ions were solvated by segment chains of PS matrix. However, the diffractogram of Fe(II)-PS sample also shows a peak at 27°; this peak was related to goethite phase (α-FeOOH) due to formation of iron oxyhydroxides.1, 26 These results suggest that the FeCl2·4H2O salt was dissolved into PS matrix. The same peak at 27° was also observed in the diffractogram of the MPHF sample. In addition, other diffraction peaks were identified at 30.23°, 35.67°, 39.7°, 43.25°, 52.94°, 56.25°, and 62.95° which correspond to planes (220), (311), (222), (400), (422), (511), and (440), respectively. Figure 3(d) shows that these diffraction peaks are related with maghemite or magnetite crystalline structures.27, 28
Infrared Spectra
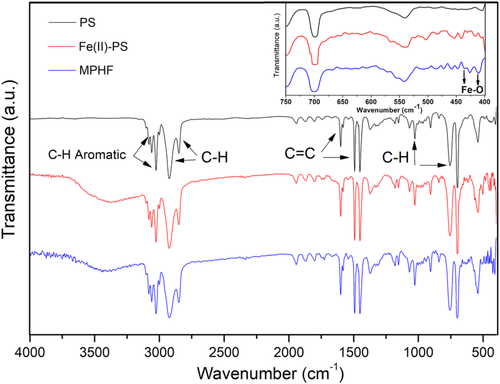
The infrared spectra for all the studied samples (PS-matrix, Fe(II)-PS, and MPHF) were obtained for wave numbers from 4000 to 400 cm−1 and are shown in Figure 5. For PS matrix, the infrared peaks at 3025 and 3061 cm−1 are related to absorption from C − H stretching vibrations into phenyl ring of PS macromolecules. Besides, the peaks at 2921 and 2853 cm−1 correspond, respectively, to asymmetric and symmetric stretching vibrations of methylene groups −CH2. In this regard, Olmos et al.29 established that for this material (PS) the part of infrared spectrum ranging from 3200 to 2800 cm−1 represents the region of the C − H stretching vibrations. Additionally, in the range from 2000 to 1665 cm−1, a pattern of the overtone and combination bands was also identified; according with Refs. 29, 30, this pattern is associated to mobility of mono-substituted aromatic rings. Besides, the next three peaks identified at 1601, 1493, and 1452 cm−1 are related to aromatic C = C bond stretching vibration. Continuing with the infrared spectrum of PS matrix, the peaks observed at 1027, 756, and 700 cm−1 correspond to the out-of-plane bending vibrations of C − H from the monoreplacement in the phenyl ring group. The intermediate part of the spectrum of PS, from 1300 to 900 cm−1 approximately, is referred as the fingerprint region,29 and for the three infrared spectra shown on Figure 5, no differences were identified within this wave number range. However, for a low frequency region from 670 to 400 cm−1, the infrared spectra for the three samples show differences between them (see insert on Figure 5), which are related to Fe(II) and IONPs contents into Fe(II)-PS and MPHF samples, respectively. The differences between Fe(II)-PS and PS samples are mainly associated with Fe ions into PS matrix, and differences between MPHF and PS are related with IONPs. Additionally, other differences were also identified for Fe(II)-PS and MPHF samples: an infrared band was identified between 3200 and 3500 cm−1, which, according to Ref. 25, is due to absorbed H2O. The main difference was that at low frequencies, for infrared spectrum of MPHF sample, several bands were identified at 484, 472, 458, 446, 435, 426, and 410 cm−1. Similar to Refs. 31, 32, infrared bands at 435 and 410 cm−1 correspond to vibration modes of FeO, and the other bands below 670 cm−1 are associated to H-type interaction between IONPs and polymer. This corroborates that IONPs interact with PS matrix25; consequently, the relaxation phenomena of PS matrix must be modified. Table 1 resumes the results obtained from FTIR analysis for the three samples studied.
| Assignments | Wavenumber (cm−1) | ||
|---|---|---|---|
| PS | Fe(II)-PS | MPHF | |
| Absorbed H2O | — | 3200 to 3500 | 3200 to 3500 |
| C − H stretching | 3025, 3061 | 3025, 3061 | 3025, 3061 |
| −CH2 asymmetric and symmetric stretching | 2921, 2853 | 2921, 2853 | 2921, 2853 |
| C − H stretching | 3200 to 2800 | 3200 to 2800 | 3200 to 2800 |
| Aromatic rings mobility | 2000 to 1665 | 2000 to 1665 | 2000 to 1665 |
| C = C stretching | 1601, 1493, 1452 | 1601, 1493, 1452 | 1601, 1493, 1452 |
| C − H bending | 1027, 756, 700 cm−1 | 1027, 756, 700 cm−1 | 1027, 756, 700 cm−1 |
| Fingerprint region | 1300 to 900 | 1300 to 900 | 1300 to 900 |
| Fe-ions | — | 670 to 400 | 670 to 400 |
| Fe-O | — | — | 435 and 410 |
UV–Vis Characterization
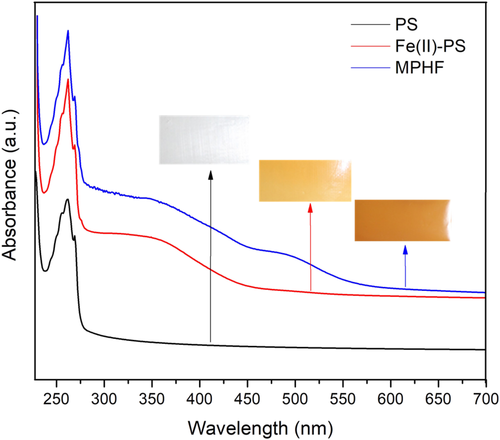
Figure 6 shows the UV–Vis absorption spectra for the three samples studied (PS matrix, Fe(II)-PS, and MPHF). The transparency of the PS matrix allows light to pass easily, but it was found that it absorbs below a wavelength of 300 nm with a maximum at 260 nm due to the interaction of their phenyls groups; this result is in accordance with Ref. 33. Besides, the spectra for Fe(II)-PS and MPHF samples display broad peaks. For Fe(II)-PS, the absorption between 300 and 450 nm can be mainly attributed to Fe ions.34 A similar behavior is observed for MPHF, but in this case, IONPs exhibit strong absorption in the range of 200–400 nm in the UV region and weak absorption at 400–700 nm of the visible region. The two types of optical absorptions, in the UV and visible regions, are mainly attributed to the two kinds of electronic transition mechanisms. The former is due to the contribution of the direct charge transition of O2 −2p → Fe3+ 3d (UV absorption), and the latter originates from the indirect charge transition of Fe3+ 3d → 3d (visible absorption).24, 35
 (1)
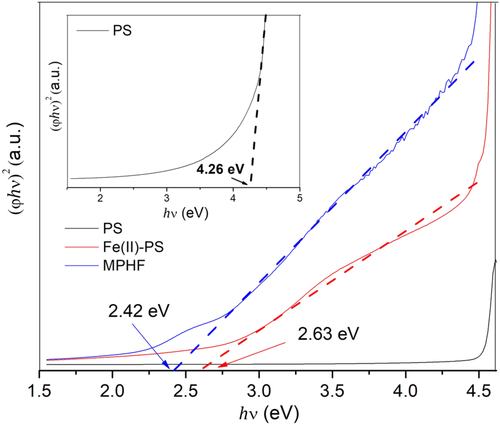
(1) and 2 for allowed direct and indirect transitions, respectively. By extrapolation of the linear region in the graphs (φhν)
n versus
hν, the energy values of the band gap were measured for the three samples studied. Figure 7 shows the exponential curve at low energy values due to the presence of IONPs, where the measured band gap energy value for the MPHF was 2.42 eV. This result is close to the reported band gap for maghemite phase, 2.3 eV, which is considered as a semiconductor material.36 Similar calculations were made for PS matrix and Fe(II)-PS samples, observing that E
bg for Fe(II)-PS increases slightly with respect to that obtained for MPHF. However, in the case of PS matrix, the E
bg computed was above 4 eV, a typical value for a polymer insulator.
Results for Magnetic Characterization
The magnetization curves  for MPHF were obtained at 300 and 5 K; they are shown in Figure 8(a) and (b), respectively. From these experimental curves, the magnitude of saturation magnetization, remnant magnetization, and coercive field were estimated. At 5 K, the saturation magnetization was about 1.84 emu·g−1, and the magnetization curve displays a slender hysteresis where the estimated coercivity field and remnant magnetization have values of 1.13 kOe and 0.13 emu·g−1, respectively. These magnetization curves correspond to a ferromagnetic behavior, which appears when the magnetic analysis is performed below the blocking temperature, approximately 40 K, see Figure 8(c). For the MPHF sample at 300 K, the saturation magnetization estimated was about 0.92 emu·g−1, and the magnetization curve shows an extreme small hysteresis loop where the remnant magnetization and coercive field were about 0.001 emu·g−1and 32 Oe, respectively. The small hysteresis and low magnitudes of both remnant magnetization and coercive field of IONPs correspond to a superparamagnetic state.1, 22
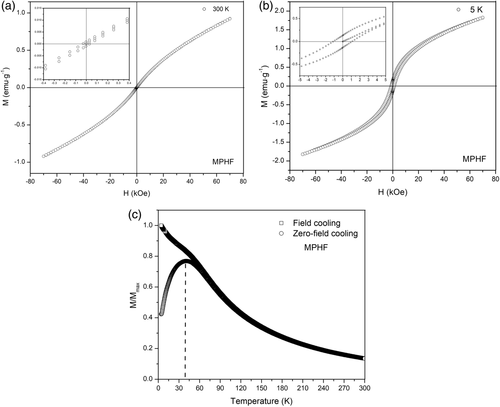
The temperature dependence of the magnetization was measured with the use of zero-field cooling (ZFC) and field cooling (FC) procedures in an applied magnetic field of 100 Oe between 4.2 and 300 K, Figure 8(c). Above 40 K, the magnetization decreases with increasing temperature in both ZFC and FC cases. At lower temperatures, the magnetization increases monotonically with decreasing temperature for the FC, whereas the ZFC magnetization passes through a maximum at 40 K, which can be associated with the blocking temperature.
At the blocking temperature, transition from ferromagnetic to superparamagnetic behavior, the thermal energy becomes comparable to the energy obtained by aligning the magnetic vector of the nanoparticle in the weak field. When all the nanoparticles are in the superparamagnetic state, above the blocking temperature, their magnetization decreases with the increase in temperature. In the case of FC, the magnetization increases monotonically as the temperature decreases because the nanoparticles are cooled from room temperature under a magnetic field.1, 24
The DMA Results
By DMA, both E′ and tan δ were registered for the two samples studied, PS matrix and MPHF. These experimental results were measured under isochronal conditions, at four different frequencies: 0.1, 1, 10, and 100 Hz, in a temperature range from 293 to 433 K and using a temperature ramp of 2 K·min−1. In this section, results are presented in four sections. In the first one, to determine the effect of IONPs on the PS matrix, the corresponding results to MPHF were compared with results of the PS matrix. In the second one, the theoretical results obtained from FZM are presented and discussed. In the third one, the effect of frequency on E′ and tan δ is discussed, which is essential to estimate the temperature dependence of parameters τ a and τ b of the FZM. Finally, a matching between theoretical results of FZM and experimental curves is presented.
The Effect of IONPs on PS Matrix
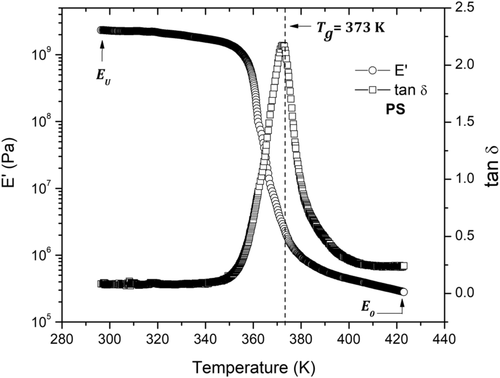
Figure 9 shows the temperature dependence for E′ and tan δ at a frequency of 1 Hz for the PS matrix. At low temperatures (between 293 and 353 K) both experimental curves display an elastic behavior. Actually, both experimental curves are independent of temperature in the aforementioned temperature range with values of E′≈ 2.3 x 10⁹ Pa and tan δ very close to zero, which indicates that energy dissipation is minimal. For the temperature range from 353 to 378 K, E′ decays significantly when the temperature increases, and tan δ presents a maximum in the region where E′(T) has the higher rate of decay. The temperature at which the maximum of tan δ is manifested corresponds to the glass transition temperature, T g, which takes a value of 373 K for PS matrix. The energy dissipation at T g is related to the cooperative mobility of segmental PS chains. Finally, at temperatures above 378 K, tan δ has values close to zero, and E′≈ 2.8 × 10⁵ Pa, with a minimal dependence on temperature. Experimental curves of Figure 9 represent an α-relaxation of PS matrix. At temperatures above T g, the mobility of segmental PS chains is less cooperative; according to Refs. 21, 23, 37, polymer chains are free to take the conformations allowed by the rotation around single bonds. Besides, as the temperature decreases below T g − 50 K, the cooperativity of mobility of segmental PS chains must be increased. This means that, in α-relaxation, when temperature decreases the cooperativity of the chain segments increases, but molecular mobility decreases, in according with Ref. 21.
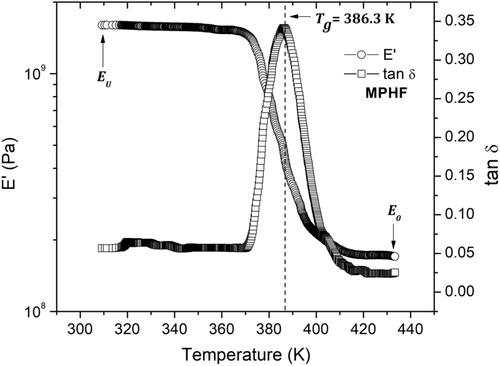
To identify the effect of IONPs on PS matrix, MPHF samples also were analyzed by DMA. Figure 10 shows the isochronal curves obtained for E′ and tan δ at a frequency of 1 Hz. Some differences were identified between experimental curves of MPHF and PS matrix. These differences (see Table 2) are due to the effect of IONPs on PS matrix, which means that the cooperative mobility of segment chains associated to α-relaxation process of PS matrix has been modified. The three temperature ranges identified for experimental curves of the PS matrix sample have been also identified for the MPHF sample, with a shift toward high temperatures, which is clearly manifested for the estimated T g values, see Table 2. For MPHF sample, a greater overall increase of the E′(T) curve is found in comparison with sample of PS matrix, and it can be established that IONPs improve the mechanical properties of PS matrix. Regarding the estimated values of glass transition temperatures, T g for the MPHF sample is greater than the estimated T g for the PS matrix.
| Sample | Experimental parameters | |||
|---|---|---|---|---|
| PS | Temperature range (K) 293-353 |
Temperature range (K) 353-378 |
Temperature range (K) 378-423 |
Temperature range (K) 293-423 |
| E U = 2.3 × 10⁹ Pa | T g = 373 K tan δ = 2.19 | E0 = 2.8 × 10⁵ Pa | E u − E0 = 2.29972 × 10⁹ Pa | |
| MPHF | Temperature range (K) 303-368 |
Temperature range (K) 368-408 |
Temperature range (K) 408-433 |
Temperature range (K) 303-433 |
| E U = 2.6 × 10⁹ Pa | T g = 386.3 K tan δ = 0.34 |
E0 = 1.7 × 10⁸ Pa | E u − E0 = 2.43 × 10⁹ Pa | |
Table 2 summarizes the differences between MPHF and PS matrix samples. In this table, it is also observed a slight increase in parameter E U (E′ at low temperatures) for the MPHF sample compared to E U value of the PS matrix. Meanwhile, for the case of E0, an increase of three orders of magnitude is observed.
The shift of the T g peak toward high temperature values is related to the restricted movements of the segmental PS chains localized between IONPs; so higher temperatures are required to activate the mobility associated to the α-relaxation process. To confirm the relation between experimental curves (Figures 9 and 10) and molecular mobility of the α-relaxation process, isochronal theoretical curves for E′ and tan δ were computed from FZM. After that, a matching between theoretical and experimental results were obtained. Next section presents these theoretical curves of E′ and tan δ calculated from the FZM.
The Theoretical Results of FZM
 (2)
(2) and
and  are the fractional integral of the strain with respect to time with a fractional orders
a and
b, respectively,
τ
a and
τ
b characterize the time associated to molecular cooperative movements to a new structural equilibrium state at temperatures lower and higher than
T
g, respectively. The fractional integral defined between 0 and
t is obtained by eq. (3). In this case, the fractional order of a fractional integral (parameters
a and
b in eq. (2)) reflects the rate at which a portion of the energy is stored in the viscoelastic system. Additionally, fractional derivative represents the rate at which a portion of energy is lost in the viscoelastic system (eq. (4)).
 (3)
(3) (4)
(4) (5)
(5) (6)
(6) (7)
(7) for noncooperative movements (or an elementary movement of simultaneous movements);
Z can be considered as the temperature dependent number of elementary movements participating on the cooperative processes, being
Z = 1 for noncooperative movements, and increasing when cooperativity increases.21, 23 Therefore, relaxation times verify the next power law:
 (8)
(8) (9)
(9) (10)
(10)Figure 11(a) and (b) show, for a frequency of 1 Hz, the isochronal diagrams obtained from the FZM. In order to obtain these theoretical curves, the fractional orders of spring pots a and b, that constitutes the FZM, were varied systematically. It is important to point out that these parameters can only take values between 0 and 1. The other parameters were selected by using a heuristic way.21, 23, 38 Figure 11(a) corresponds to temperature dependence of E′ and tan δ, and Figure 11(b) shows the corresponding Cole-Cole diagram. The theoretical curves of Figure 11(a) and (b) correspond to typical curves of α-relaxation of polymeric materials, consequently FZM parameters can be calculated from experimental results. From Figure 11(a) and (b), at very low temperatures, E′ is equal to the global nonrelaxed modulus (E U). At higher temperatures, E′ is equal to the global relaxed modulus (E0). In the intermediate region, between E′ = E U and E′ = E0, E′ is dependent on T and parameters a and b; in addition, the relaxation peak associated to the glass transition process can be identified.
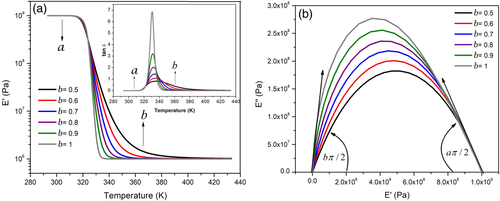
Parameters E u, E0, a, b and ω of FZM can be calculated from the experimental curve of E′. However, to calculate parameters τ a and τ b it was necessary to determine the effect of frequency on isochronal curves of tan δ. Next section describes results obtained by DMA under isochronal conditions at several frequencies for the two samples, PS matrix and MPHF.
The Effect of Frequency on DMA Measurements
 (11)
(11)
| Sample | Frequency (Hz) | |||
|---|---|---|---|---|
| 0.1 | 1 | 10 | 100 | |
| PS | 369.71 K | 373.39 K | 378.26 K | 385.34 K |
| MPHF | 382.85 K | 386.95 K | 392.65 K | — |
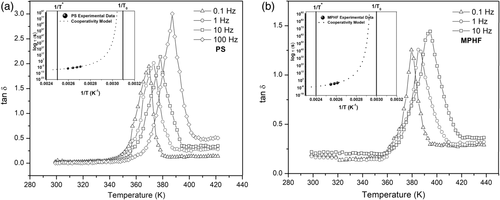
From data of Table 3, τ was calculated and then τ and T were used to build an Arrhenius diagram, see insertions on Figure 12(a) and (b). The experimental data of Arrhenius diagrams were matched with τ(T) defined by eq. (5). Parameters used to define τ(T) for each sample ( τ0, E a, T* and T0) were defined as described in Refs. 21, 23, and they are shown in Table 4. As observed in Figure 12(a) and (b), the well-fitting between experimental results (τ, T) and the theoretical curves, defined by parameters of Table 4, confirms that molecular mobility in the α-relaxation process has a cooperative nature.
| Parameters | T* (K) | T0 (K) | E a (eV) | τ0 (s) |
|---|---|---|---|---|
| PS | 403.80 | 323.15 | 0.48 | 4.0 x 10⁻¹³ |
| MPHF | 420.05 | 336.15 | 0.55 | 5.5 x 10⁻¹³ |
In Table 4, the magnitude of parameters
T* and
T0 are consistent with values calculated for other polymeric materials.23, 37 In addition,  is an empirical relation slightly greater than unity (~1.1) and
T0 ≈ T
g − 50 K. The parameter E
a, the activation energy of conformers that move independently, also corresponds to that calculated for other polymers (0.4–0.7 eV). The preexponential factor,
τ0, has the same magnitude order of the inverse value of the atomic vibration frequency.21, 23
Every FZM was calculated from the experimental curves, the calculation of the isochronal theoretical curves of E′ and tan δ was carried out. The resulting curves are compared with experimental curves in the following section.
Comparison between Experimental and Theoretical Results
To validate the theoretical results of the FZM, the comparison with the experimental results is presented below. Tables 4 and 5 show the FZM parameters used for the calculation of theoretical curves as shown in Figure 13. This figure corresponds to a comparison between theoretical and experimental results of E′(T), tan δ, and Cole-Cole diagrams for the two samples, PS matrix, and MPHF.
| Parameters | E U (Pa) | E0 (Pa) | a | b |
|---|---|---|---|---|
| PS | 2.3 x 10⁹ | 2.8 x 10⁵ | 0.21 | 0.53 |
| MPHF | 2.6 x 10⁹ | 1.7 x 10⁸ | 0.20 | 0.48 |
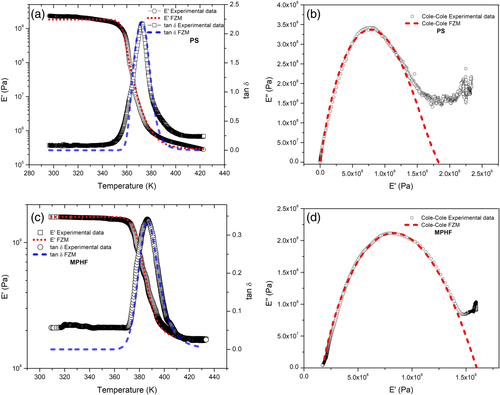
Figure 13 shows good agreement between the experimental isochronous spectra and the theoretical results calculated from the FZM. It can be observed that theoretical and experimental slopes of E′ are similar over the temperature range analyzed. Concerning tan δ, the FZM perfectly follows the peak, even if at low temperatures and high temperatures, experimental and theoretical results did not match. It could be explained because others relaxation phenomena, at lower and higher temperatures, are not taken into account in the FZM.
The Cole-Cole diagrams confirm that fractional parameters a and b characterize the molecular mobility at low and high temperatures, respectively. At low temperatures, the cooperative molecular mobility of segmental chains ( a parameter) is slightly affected by the presence of IONPs. For b parameter (high temperatures), the presence of IONPs affects to a greater degree the cooperative molecular mobility of segmental chains. Finally, for each sample b > a, which means that when temperature increases, the cooperative decreases but molecular mobility (energy dissipation) increases. However, IONPs decrease molecular mobility of PS matrix. This effect is more pronounced at temperatures above T g, consequently the corresponding T g value increases.
CONCLUSIONS
A MPHF consisting of IONPs into a PS matrix was obtained. The preparation of IONPs from the precursor material Fe(II)-PS was confirmed by HRTEM, XRD, UV–Vis, and FTIR analysis. IONPs are embedded in the PS matrix, and their measured size was about 5.6 nm, having a nearly spherical morphology. The infrared spectrum of MPHF shows bands associated to the interaction between IONPs and polymer. This confirm that IONPs interact with PS matrix, and consequently the α-relaxation process of the PS matrix is modified. The UV–Vis spectrum shows that IONPs exhibit strong absorption in the range of 200-400 nm, in the UV region, and weak absorption at 400-700 nm of the visible region. The analysis of the magnetic properties of the MPHF shows a superparamagnetic behavior. By DMA, the effect of IONPs on PS matrix was identified. The experimental curves of E′ and tan δ reveal an improvement of the mechanical properties and consequently the cooperative mobility of the segmental chains associated to the α-relaxation was modified. By fractional calculus approach, PS and MPHF samples presented a lower difference between a-parameters than the b-parameters. These differences can be considered as a quantitative measure of the change produced in α-relaxation. Fractional parameter a is related to molecular mobility of segmental chains at lower temperature and b-parameter is related to high temperatures. Consequently, at low temperatures molecular mobility is slightly affected by the presence of IONPs. But at high temperatures, the presence of IONPs affects to a greater degree the molecular mobility. When temperature increases, the molecular mobility also increases but motions are less cooperatives. IONPs decreases molecular mobility of PS matrix; this effect is more pronounced at temperatures above the glass transition temperature. These results will allow a better optimization of potential applications of MPHFs.
ACKNOWLEDGMENTS
This project was financially supported by the Consejo Nacional de Ciencia y Tecnología (CONACYT) through scholarship number 300705.
Biographies

Flor Yanhira Rentería-Baltiérrez is an associate professor in the Chemical Science Department at the Universidad Autónoma de Nuevo León. She received her B.S. degree in Industrial Engineering from Instituto Tecnológico de Delicias, México; her M.Sc. degree in Materials Science from Centro de Investigación en Materiales Avanzados, S.C., México; and her Ph.D. degree in Materials Engineering from the Universidad Autónoma de Nuevo León, México.

Martín Edgar Reyes-Melo is a professor in the Doctoral Program in Materials Science at the Universidad Autónoma de Nuevo León. He received his B.S. degree in Food Industry Engineering from Universidad Autónoma de Nuevo León, México; his M.Sc. degree in Mechanical Engineering (Materials Science) from Universidad Autónoma de Nuevo León, México; and his Ph.D. degree in Materials Science (Materials, Technology, and Components of Electronics) from Université Paul Sabatier (Toulouse III), Toulouse, France. His research interests involve rheology, electric, and magnetic properties of polymer systems, application of fractional calculus to modelling of polymeric hybrid materials.

Beatriz López-Walle is an associate professor in the Doctoral Program in Materials Science at the Universidad Autónoma de Nuevo León, México. She received her B.S. degree in Mechanical Engineering from Universidad Nacional Autónoma de México, and her Ph.D. degree in Micromechatronics from Université de Franche-Comté, France. Her research interests involve study, simulation, modelling, and application of smart materials (magnetic polymers and shape memory alloys) into functional micromechatronics devices.

Antonio Francisco García-Loera is a professor in the Doctoral Program in Materials Science at the Universidad Autónoma de Nuevo León, México. He received his B.S. degree in Mechanical and Management Engineering; a Master of Science in Mechanical Engineering (Materials Science) from Universidad Autónoma de Nuevo León, México; a Master of Science in Materials Science at the INSA of Lyon, France; and his Ph.D. degree in Materials Science at the INSA of Lyon, France. His research interests involve physicochemical of polymer blends and polymeric composite materials.


