Cytotoxicity studies, DNA interaction and protein binding of new Al (III), Ga (III) and In (III) complexes with 5-hydroxyflavone
Abstract
We report the synthesis and characterization of three new complexes of the natural flavonoid 5-hydroxyflavone (primuletin) and Al (III), Ga (III), In (III), respectively. The physico-chemical properties and structural features of these three novel compounds have been investigated by elemental and thermogravimetric analysis, molar conductance and several spectroscopic techniques, including FT-IR, UV–Vis and mass spectra. Based on the experimental data, the general chemical formula of the complexes is [M (C15H9O3)3] · nH2O, where M is the cation and n = 2 for Al (III), n = 0 for Ga (III), n = 1, for In (III); each one of the three 5-hydoxyflavone molecules acts as a monoanionic bidentate chelate ligand in the complexes. DFT calculations further sustain the proposed structures of the complexes. Cytotoxicity was studied using MTS assay on cervical, breast, colon and ovary adenocarcinoma cell lines. The central metal ions exert cytotoxic effects in a disparate manner: Al (III) enhances, while Ga (III) and In (III) decrease the cytotoxicity of the ligand. As a means to investigate the mechanism underlying the cytotoxic effects of the complexes, interactions with calf thymus DNA, human serum albumin and transferrin were also carried out.
1 INTRODUCTION
Due to their unique physico-chemical properties and relevant biological activities, an increasing interest can be observed for the development of new anticancer flavonoid-based drugs. Flavonoids are a naturally occurring subclass of polyphenols based on a C6-C3-C6 phenyl-benzopyran backbone.1 The high versatility of the flavonoid scaffold provides them with promiscuous affinity towards a plethora of biological targets,2-6 which in turn influence a number of cancer-related processes, such as cellular proliferation, differentiation, apoptosis, metastasis and reversal of multidrug-resistance.7 Flavopiridol (Alvocidib) and P276–00 are two new antitumour agents bearing a flavonoid scaffold undergoing clinical development. Flavopiridol has been designated as an orphan drug for the treatment of relapsed or refractory chronic lymphocytic leukemia and is currently undergoing phase II clinical studies for non-Hodgkin's lymphoma, renal, prostate, colon and gastric carcinomas.8, 9 In many cases, the anticancer activity of the flavonoid metal complexes has been reported to be superior to that of the free corresponding flavonoids.10 Also, the Ga (III)-morin complex was investigated as a new radiopharmaceutical for kidney cancer cells labeling.11
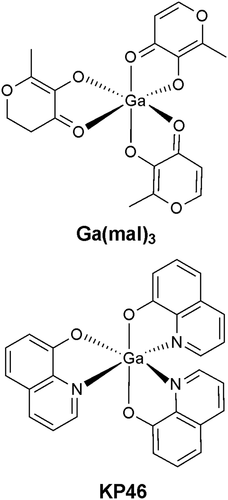
Trivalent group 13 metal ions have attracted much interest as coordination centers in medicinal inorganic chemistry. For the treatment of cancer, this culminated with several inorganic salts and complexes with lipophilic ligands of Ga (III) emerging as promising anticancer drug candidates. Two Ga (III) compounds have reached phase I/II clinical studies, namely gallium (III) maltolate (Ga (mal)3; Figure 1)12 and tris (8-quinolinato) gallium (III) (KP46)13 (Figure 1), with the outcome of promising tolerability and activity against several cancer types. In addition, the literature cites several anti-metastatic or cytotoxic Al (III)14-17 and In (III)18, 19 complexes. One of the most attractive features of these metal ions is their high cellular uptake, due to their specific transport inside cells by serum proteins, the most important being transferrin. Drug binding to serum proteins (e.g. human serum albumin, transferrin, lipoprotein, glycoprotein, globulins) plays a very important role in drug pharmacokinetics and pharmacology, with strong impact on absorption, distribution, metabolism, and excretion. Moreover, unfavourable protein-binding can be correlated in some cases with poor cytotoxic activity and lack of clinical efficacy.20
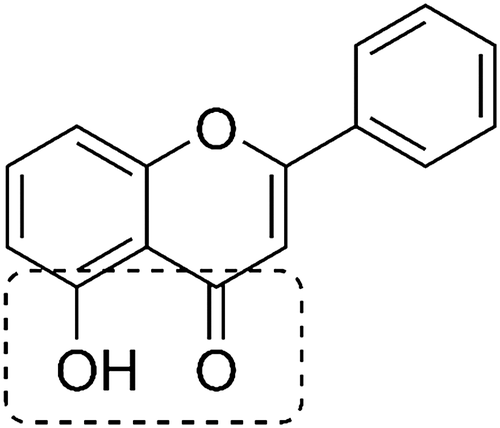
To date, synthesis, spectral, electrochemical, antioxidant properties and/or protein interactions have been published for several complexes of Al (III), Ga (III) and In (III) with various flavonoid derivatives.21-28 However, the cytotoxic activity of Al (III)/Ga (III)/In (III) - flavonoid complexes has only been marginally studied.17, 29 In this context and in relation to the structural similarity of 5-hydroxyflavone (Figure 2) and maltol in terms of the donor set, we report the synthesis and structural investigation of three new complexes of Al (III), Ga (III), In (III) and 5-hydroxyflavone. A thorough investigation of the interactions of the complexes with CT-DNA, Tf and HSA has also been performed and molecular docking studies have been carried out to validate the results of the protein binding studies. The in vitro cytotoxic activity was assessed by MTS assay and impedance measurements (xCELLigence RTCA) against HeLa (human epitheloid cervix adenocarcinoma), MCF-7 (human breast adenocarcinoma), LoVo (human colon adenocarcinoma) and Sk-Ov-3 (human ovary adenocarcinoma) cell lines.
2 EXPERIMENTAL SECTION
2.1 Materials and instrumentation
All reagents and solvents were of analytical reagent grade and were used without further purification. 5-hydroxyflavone, AlCl3·6H2O, Ga2O3, InCl3·6H2O, cisplatin, human serum transferrin and albumin were purchased from Sigma Aldrich Chemical Co., Schnelldorf, Germany.
Elemental analyses were performed using a Perkin Elmer PE 2400 analyser (for C, H, N, S). The conductivity was measured with a Consort C830 (Turnhout, Belgium) conductimeter with an SK10T platinum electrode embedded in glass (cell constant 1.0 cm−1) for 10−3 M solutions in DMSO. IR spectra were recorded using KBr pellets on a FT-IR VERTEX 70 (Bruker) spectrometer in the range 400–4,000 cm−1. Electronic spectra by diffuse reflectance technique were recorded on a Jasco V 650 spectrophotometer in the range 200–800 nm, with spectralon as reference sample. Fluorescence spectra were recorded on a Jasco FP 6500 spectrofluorometer.
Mass spectra were recorded with an API 5000 (SCIEX- Canada) triple quadrupole mass spectrometer equipped with a pneumatically assisted electrospray (ESI) source (Turbo spray model from SCIEX) in positive mode scanning over a range m/z 100–1000. Samples were dissolved in methanol at 10 μg mL−1 and infused in the ESI source at 7 μL min−1. Collision spectra (MS/MS), from protonated pseudomolecular ions, were acquired on the same instrument employing nitrogen as collision gas.
The heating curves (TG, DTG and DTA) were recorded using a Labsys 1200 SETARAM instrument with a sample weight between 10–14 mg over the temperature range of 30–900 °C and a heating rate of 10 °C min−1. The measurements were carried out in synthetic air atmosphere (flow rate 17 mL min−1), using alumina crucible. Sample masses were weighed on a microbalance with a resolution of 0.1 mg.
2.2 General procedure for the synthesis of the complexes
Syntheses of the Al (III) and In (III) complexes were carried out using the following general procedure: in a round bottomed flask provided with an electromagnetic stirrer, ethanolic solutions (5 ml) of metal salts (0.5 mmol) were added to an ethanolic solution (25 ml) of 5-hydroxyflavone (~ 1.7 mmol). To promote the deprotonation of the ligand, the pH of the reaction mixtures was adjusted to pH = 6 by dropwise addition of an aqueous solution of NaOH (0.1 M). For the synthesis of the Ga (III) complex, Ga2O3 (0.5 mmol) was dissolved in a concentrated solution of HCl and was added to the ethanolic solution of the deprotonated flavone (pH = 6). The reaction mixtures were heated under reflux for 3 hr for both methods. The yellow products formed were filtered off, washed several times with small amounts of a hot mixture of ethanol:water (1:1, v/v), and dried in an dessicator.
Al (III) complex - Molecular formula: AlC45H31O11, molecular weight: 774.63 g/mol. Element. anal. Found (calc.): %C 69.44 (69.77) and %H 4.08 (4.04); Molar conductance (Ω−1·cm2·mol−1): 20; IR (cm−1): 3551, 3412, 3050 (ν(O-H)); 1630 (ν(C=O)); 1358 (ν(C-O) + δ(O-H)); 1228 (ν(C-O-C)).
Ga (III) complex - Molecular formula: GaC45H27O9, molecular weight: 781.44 g/mol. Element. anal. Found (calc.): %C 67.07 (67.61) and %H 3.49 (3.66); Molar conductance (Ω−1·cm2·mol−1): 22; IR (cm−1): 3400, 3060 (ν(O-H)); 1642 (ν(C=O)); 1399 (ν(C-O) + δ(O-H)); 1219 (ν(C-O-C)).
In (III) complex -Molecular formula: InC45H29O10, molecular weight: 844.46 g/mol. Element. anal. Found (calc.): %C 63.30 (63.99) and %H 3.98 (3.47); Molar conductance (Ω−1·cm2·mol−1): 21; IR (cm−1): 3553, 3479, 3413 (ν(O-H)); 1641 (ν(C=O)); 1399 (ν(C-O) + δ(O-H)); 1221 (ν(C-O-C)).
2.3 Molar ratio method
For the molar ratio method, 9 samples were prepared for each metal ion, in which the concentration of 5-hydroxyflavone was kept constant (4·10−5 M) and the concentration of the metal salt (AlCl3·6H2O, GaCl3, InCl3·6H2O) was varied (in molar ratios of 1:7 to 3:1). The total volume of 5.0 ml was obtained by adding distilled water and ethanol in amounts that preserved the 50/50 v/v ratio. The samples were brought to pH = 7.4 with a 0.1 M NaOH solution and were kept at 50 °C for 3 hours. The absorbance was monitored at a wavelength where only the metal–ligand complex absorbs (400 nm) and the obtained absorbance values were plotted against the metal ion:ligand ratio.
2.4 Geometry optimization study
Full geometry optimizations of the ligand and the complexes were carried out using the DFT method in Gaussian09 software package,30 with Becke-3-Lee-Yang-Parr (B3LYP) supplemented with the standard 6-31G(d) (for H, C, O atoms) and LANL2DZ (for the metal atom) basis sets.31 Self-consistent field (SCF) method was used to obtain the optimized geometries, corresponding to the minimum on the potential energy surface. The optimizations were employed under no symmetry restrictions and vibrational frequencies were additionally calculated at the same level of theory in order to confirm that the optimized structures are true minima (with no imaginary frequencies).
2.5 Cell culture
HeLa, LoVo, MCF-7 and Sk-Ov-3 human cancer cell lines were purchased from American Type Culture Collection (ATCC). Cells were routinely maintained in culture either in culture flasks or seeded in plates, using a DMEM/F12 culture medium supplemented with 2 mM L-glutamine, 10% fetal calf serum (Sigma Aldrich, St. Louis, Mo, USA), 100 units/ml penicillin, 100 μg/ml streptomycin and incubated at 37 °C in 5% CO2 humidified atmosphere. After 24h adherent cells were treated with different concentrations of the compounds for various periods of time. Cisplatin (Sigma), a conventional oncologic drug used in cancer treatments, was used as a positive control of the experiments. Cell treatments of 5-HOF, complexes and cisplatin (Cis-Pt) were carried out using concentrations of 200, 100, 50, 25, 12.5 and 6.25 μM of the drug. The stock solutions were prepared in DMSO and preserved at –20 °C. Working drug concentrations were prepared from the stocks in culture medium before each experiment.
2.5.1 Cytotoxicity assay (MTS)
All assays were performed in triplicate in 96-well microtiter plates with flat bottom (Falcon), using CellTiter 96 Aqueous One Solution Cell proliferation Assay (Promega), a MTS-based colorimetric assay. The method relies on the ability of metabolically active cells to reduce MTS, a yellow tetrazolium salt to the colored formazan that is soluble in the culture medium. Briefly, 15x103 cells/well were cultured in 100 μL for 24 h, culture supernatants were discarded, then cells were treated for 24 hr with increasing concentrations of drugs. After the end of the incubation time, 20 μL reagent containing a) MTS, [3-(4,5-dimethylthiazol-2-yl)-5-(3-carboxymethoxy-phenyl)-2-(4-sulfophenyl)-2H-tetrazolium, inner salt], and b) PES (phenazine ethosulfate), were added in each well. PES has a high chemical stability that allows it to bind to MTS and form a stable solution. After adding the coloring solution, plates were incubated for 4 hr at 37 °C, with mild agitation every 15 min. The reduction of the tetrazolium compound to formazan was spectrophotometrically measured at λ = 492 nm, using the Tecan GENios Spectrophotometer. The percentage of viability compared to untreated cells (considered 100% viable) was calculated with the formula:
Cell viability (%) = (absorbance of treated cells - absorbance of culture medium)/(absorbance of untreated cells - absorbance of culture medium) × 100
Cell viability data was expressed as the mean values ± standard deviations (SD) of the experiments. A parallel assay for evaluation of DMSO cytotoxicity was determined in the same experimental conditions, but no cell cytotoxicity was observed for concentrations lower than 1% (data not shown).
Data were obtained in triplicate (n = 3) averaged and expressed as mean ± standard deviation (SD). Statistical analysis was carried out using one way analysis of variance (ANOVA), followed by Tukey's test. A value of p ≤ 0.05 was considered statistically significant.
2.5.2 Real-Time Cell Analysis (RTCA)
The experiments were performed on xCELLigence System that allows cell-based in vitro assays for the assessment of cell viability and cytotoxicity. Briefly, cancer cells were cultured in DMEM supplemented with 2 mM L-glutamine and 10% FCS and seeded in E-Plates 16 cell (ACEA Biosciences). Growth curves started to be automatically recorded on the xCELLigence System in real time. After 24 hr, scalar concentrations of the drugs were added, and live cells monitored.
2.6 DNA binding study
The experiments were performed in Tris–HCl buffer [tris (hydroxymethyl)aminomethane], containing 5 mM Tris–HCl and 50 mM NaCl, adjusted to pH 7.4. The concentration of the CT-DNA solution was determined by measuring the absorption intensity at 260 nm, using the molar extinction coefficient value of 6600 M−1 cm−1. The absorbances registered at 260 nm and 280 nm gave the ratios of ~1.8–1.9, indicating that the CT-DNA solution was sufficiently free of protein. Electronic absorption spectra were performed on a Jasco V 650 spectrophotometer using 1 cm quartz cuvettes at room temperature. Absorption titrations were determined in the range 200–500 nm. We measured the absorbances of the mixtures, containing constant concentrations of the tested complexes of 15 μM and increasing concentrations of the nucleic acid. We also measured the absorbances of mixtures containing constant concentrations of CT-DNA (15 μM) and increasing concentrations of the tested compounds: 5, 10, 15, 20, 25, 30 μM. Each sample was kept for 10 min at room temperature to equilibrium before recording its spectrum.

Fluorescence spectra were recorded on a Jasco FP 6500 spectrofluorometer at room temperature. A sample containing CT-DNA (10 μM) and EB (2 μM) was titrated with concentrated solutions containing the tested compounds. For every addition, the mixture was shaken and kept for 10 min at room temperature, and the fluorescence emission spectra were recorded afterwards. The experiments were performed in Tris–HCl/NaCl buffer (pH 7.4, 5 mM Tris–HCl/50 mM NaCl). Fluorescence emission spectra were recorded with excitation at 500 nm in the range 520–740 nm.

2.7 Protein binding studies
Fluorescence measurements were performed on a Jasco FP 6500 spectrofluorometer in a 1 cm path-length quartz cell by fluorimetric titration. 3.0 ml samples containing 10 μM Tf and 2.5 μM HSA, respectively, were titrated by successive additions of the ligand and the complexes (ranging from 0–20 μM, with an increment of 2.5 μM). Each sample solution was shaken and kept for 3 min at the corresponding temperatures (298 K, 308 K and 318 K). Afterwards, the fluorescence spectra were recorded with the excitation wavelength set at 295 nm (for Tf) and 280 nm (for HSA) and the emission wavelength set at 305–450 nm (for Tf) and 300–500 nm (for HSA), respectively. In the meantime, the synchronous fluorescence intensities of the mixture solution were measured at Δλ = 60 nm and Δλ = 15 nm. 3D fluorescence spectra of Tf and HSA (10 μM) in the absence and presence of the complexes (10 μM) were recorded in the range of 240–600 nm, at room temperature.


Under the experimental conditions, κ 2 = 2/3, n = 1.36, ΦD = 0.15 (for HSA)37 and 0.118 (for Tf).38
2.8 Molecular docking studies
The X-ray crystal structures for Tf (3QYT) and HSA (3JRY), respectively, were retrieved from the RCSB Protein Data Bank (www.rcsb.org/pdb). The interaction of the complexes with the proteins was modelled using the AutoDock 4.2.6 (in AutodockTools) software package.39 Metal parameters for the MD simulations were taken from ref.40: rvdW = 1.84 Å (Al), 1.87 (Ga), 1.93 (In) and εwell = 0.01 kcal/mol. Lamarckian genetic algorithm searches were used to generate two hundred docked structures. The results were visualized using PyMOL41 and BIOVIA Discovery Studio 4 softwares.
3 RESULTS AND DISCUSSIONS
3.1 Physicochemical characterization

- L = C15H9O3, deprotonated 5-hydroxyflavone
- The metal complexes will be further used throughout the article as: (1), (2), (3), as assigned above; 5-hydroxyflavone will be used as 5-HOF
Complexes (1)–(3), obtained as yellow powders, have been found to be very soluble in DMF and DMSO and moderately soluble in chloroform and methanol, but poorly soluble in water and ethanol. The low molar conductance values (around 20 Ω−1 cm2 mol−1) prove that the complexes are non-electrolytes in DMSO.
3.1.1 IR Spectra
IR-spectra of the complexes (Figure S1) confirm the complexation of Al (III), Ga (III), In (III) ions to 5-hydroxyflavone. In the IR spectra of complexes (1) and (3), broad bands between 2,600 and 3,600 cm−1 are found, assigned to the presence of hydration water in their structure. The intense absorption bands due to ν (C=O) in the free ligand, placed at 1654 and 1615 cm−1 appear shifted to lower frequencies in the spectra of the complexes, which can be explained by the involvement of the carbonyl oxygen in metal binding. The strong band at 1587 cm−1 in the IR spectrum of the ligand, assigned to ν (C=C), is slightly shifted in the spectra of the complexes, indicating that this bond is not involved in coordination. In the IR spectrum of the ligand a strong band appears at 1298 cm−1, assigned to the coupled vibration ν (C-O) + δ (OH). The same band appears very weak in the spectra of the complexes, indicating that 5-hydroxyflavone is coordinated in its deprotonated form. The ν (C-O-C) frequency does not appear shifted in the spectra of the complexes, which confirms that the ring oxygen is not involved in coordination.42-44
3.1.2 UV–Vis Spectra
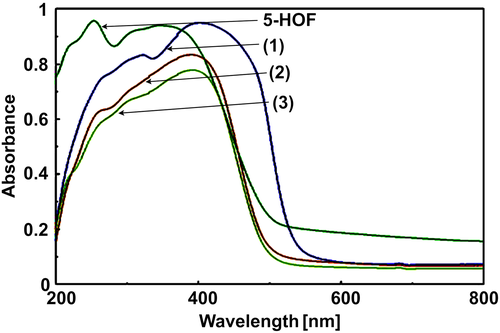
The ligand, 5-hydroxyflavone, exhibited two absorption maxima at 385 nm (band I) and 255 nm (band II), originated from π–π* transitions.45 In the spectra of the complexes, bathochromic shifts of these two bands are observed (Figure 3), which can be related to the extension of the conjugated system of the ligand with coordination.25 The shoulder at 340 nm in the electronic spectrum of the ligand, is also present in the spectra of complexes (1) and (3), slightly shifted. UV–Vis data for the ligand and the complexes are presented in Table S1.
The molar ratio method46 was employed in order to confirm the binding ratio of 1:3 in solution. The concentration of the ligand, 5-HOF, was kept constant, at 4·10−5 M; its UV–Vis spectrum was therefore checked to be proportional to its concentration up to 4·10−5 M, indicating that there is no significant intermolecular stacking which would lead to hypochromic effects. Spectrophotometric studies in ethanol/water (50/50 v/v) solutions at pH = 7.4 were performed at 50 °C. Data are presented in Figure S2. An isosbestic point (at 366 or 367 nm) can be observed after the addition of varying concentrations of the metal salts. Plots of absorbance vs. metal ion:ligand ratio indicated the presence in solution of 1:3 metal:ligand complex species.
3.1.3 Mass Spectra
Data obtained from the mass spectra are presented in Table S2 and confirm the 1:3 molar ratio metal ion: ligand. The analysed complexes form intense pseudomolecular ions by protonation. Complex (2) gave an adduct with one water molecule (Table S2, 6th column). For all products the spectra were in agreement with the natural isotopic abundances of the metals involved. Protonated pseudomolecular ions of all compounds formed, by collision with nitrogen, generate intense fragment ions corresponding to the loss of one or two ligand molecules (Table S2, 3rd and 4th column).
3.1.4 Thermal behaviour
The thermal behavior of the three new complexes was investigated by simultaneous TG/DTA analysis. The thermal decomposition (Figure S3) data are summarized in Table 1 and will be discussed as follows. According to the TG, DTG and DTA curves, complex (1) is stable at heating up to 180 °C (Figure S3), when it loses two molecules of water. The remaining anhydrous compound is also stable up to 352 °C when it starts to melt. The melting process is instantly followed by the oxidative degradation of the organic part. Complex (2) is anhydrous, therefore stable up to 250 °C. The decomposition starts with some endothermic processes followed by several exothermic steps corresponding to both thermolysis and oxidative degradation of the ligand molecules, as evidenced by both TG and DTA curves. For (3), the thermal decomposition starts at 190 °C with the water molecules loss in an endothermic process. The next exothermic steps correspond to oxidative degradation of 5-hydroxyflavone. For all complexes, the final product of thermal decomposition is the most stable species, M2O3.
| Complex | Step | Thermal effect | Temperature range/ °C | Δmexp/% | Δmcalc/% |
|---|---|---|---|---|---|
| (1) | 1 | Endothermic | 180–240 | 4.32 | 4.65 |
| 2 | Endothermic* | 352 | - | - | |
| 3 | Exothermic | 352–900 | 88.86 | 88.77 | |
| Residue (Al2O3) | 6.82 | 6.58 | |||
| (2) | 1 | Miscellaneous | 250–900 | 87.46 | 88.01 |
| Residue (Ga2O3) | 12.54 | 11.99 | |||
| (3) | 1 | Endothermic | 190–240 | 2.16 | 2.13 |
| 2 | Exothermic | 240–880 | 81.19 | 81.43 | |
| Residue (In2O3) | 16.65 | 16.44 | |||
- * melting.
3.1.5 DFT optimization of the complexes
In the last decade a great number of studies making use of modern quantum chemical methods (ab initio and density functional theory (DFT)) have shown that the computational methods could successfully be applied for the prediction of reliable molecular structures and various molecular properties.47 Special attention has been given to the aspect of whether the ligand is planar or not in the complexes, which is relevant to the antioxidant properties, interactions with biomacromolecules (e.g. intercalation into DNA), or the redox potential of the metal complexes.
DFT/B3LYP/LANL2DZ (for the metal ion) has been proved to give satisfactory predictive analysis of the coordination polyhedron and geometry parameters of the metal complexes.48, 49 The fully optimized geometries of complexes (1)–(3) and the symbols and labels of atoms are shown in Figure 4 and Figure S4-S6. Selected bond lengths and angles, charge density, total energy and total dipole moment are presented in Table S3. The coordination spheres around the metal center in complexes (1) (Figure 4), (2) (Figure S4 and S5), (3) (Figure S6) involve the following atoms: O2, O3, O4, O5, O6, O7 (belonging to the deprotonated 5-hydroxyflavone). Bond lengths for M-O are comparable with previously reported results of Al, Ga, In complexes.50-54
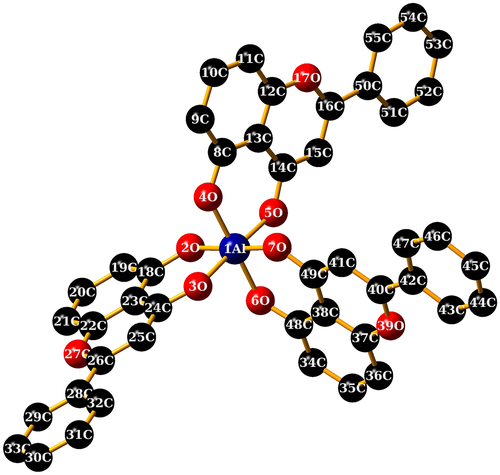
The O-M-O bond angles in the complexes are ~90°, which indicate an octahedral geometry. The values of the dihedral angles around the metal ions in the complexes (Table S3), strongly deviate from 0° or 180° which indicate that the metal ion and the donating oxygen atoms do not lie in the same plane. The quasi-planar conformation (Figure S5) of the ligand in the complexes is due to the conjugated π-bond ring system.
3.2 Cytotoxicity study
The cytotoxicity of the compounds was evaluated on HeLa (human epitheloid cervix adenocarcinoma), LoVo (human colon adenocarcinoma), MCF-7 (human breast adenocarcinoma) and Sk-Ov-3 (human ovary adenocarcinoma) cell lines. Cell viability following treatment with the ligand, complexes and the reference drug (cisplatin) was determined by MTS assay at 24 and 48 h (Figure S7 and S8) and the corresponding drug concentrations required to inhibit cell proliferation by 50% (IC50) and 90% (IC90) (calculated for the 48 h treatments) are shown in Table 2. Notably, the IC50 values obtained for cisplatin are similar to those reported by other research groups for the four cell lines.55-57
| Compound | HeLa | LoVo | MCF-7 | Sk-Ov-3 | ||||
|---|---|---|---|---|---|---|---|---|
| IC50 | IC90 | IC50 | IC90 | IC50 | IC90 | IC50 | IC90 | |
| 5-HOF | 33.44 ± 2.56 | >200 | 65.75 ± 1.13 | >100 | 103.70 ± 1.07 | >200 | >200 | >200 |
| (1) | 22.10 ± 0.83 | 43.53 ± 3.40 | 32.04 ± 2.8 | 51.35 ± 12.10 | 31.60 ± 2.95 | 58.74 ± 9.20 | 71.19 ± 1.05 | >200 |
| (2) | 86.22 ± 1.85 | >200 | 94.95 ± 1.09 | >200 | 111.8 ± 1.05 | >200 | >200 | >200 |
| (3) | 85.46 ± 1.13 | >200 | 74.74 ± 1.08 | >100 | 90.81 ± 1.34 | >200 | >100 | >200 |
| Cis-Pt | 20.39 ± 0.94 | 49.42 ± 2.88 | 21.73 ± 1.50 | 37.82 ± 4.62 | 59.37 ± 1.57 | 87.32 ± 1.10 | 46.44 ± 1.2 | >200 |
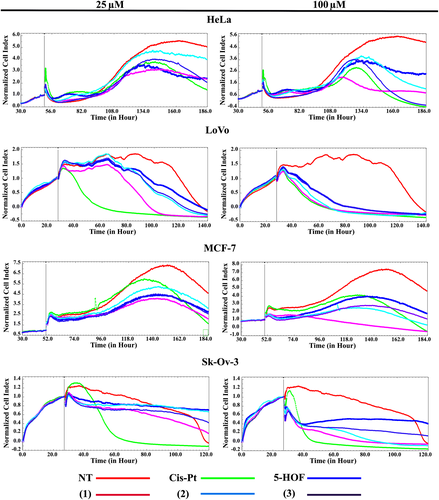
In contrast to our expectations, the Al (III) complex, not the Ga (III) one, displayed the most potent cytotoxic activity against all four cancer cell lines, with IC50 and IC90 values comparable to those of cisplatin. This finding was further confirmed by means of real-time monitoring RTCA xCELLigence system of all four cell lines after addition of the tested compounds at 25 and 100 μM (Figure 5). The RTCA xCELLigence system monitors changes in cell status, such as cell morphology, cell adhesion, or cell viability, leading to a variation of the cell index, which is a quantitative measure of the cell number present in a well. A drastic reduction in cell proliferation, proportional to drug concentration, was observed, which confirms the cytotoxic effect of the tested compounds, complex (1) being the most active of the three complexes.
Complex (1) and cisplatin had similar cytotoxic effects (in terms of IC50 and IC90 values), which suggested that similar mechanisms of action might be in play. Cisplatin induces cell toxicity via DNA covalent binding, with the formation of adducts that lead to apoptosis.58 As a consequence, DNA was presumed to be the target of these complexes. The interaction of small molecules, such as inorganic complexes, with DNA can block the division of cancer cells, resulting in cell death.59 Moreover, the planar structures of the flavonoid ligand in the complexes (as shown in Figure S5), indicates a possible intercalation between DNA base pairs. Therefore, in order to verify the assumption that (1) has a similar mode of action to that of cisplatin, DNA binding experiments were carried out.
3.3 DNA binding studies
The DNA binding studies have been performed by means of UV–Vis titration and ethidium bromide fluorescence displacement experiments. Flavonoid complexes usually bind to DNA via minor or major groove interactions or intercalation.60, 61
The absorption spectra of (1)–(3) were recorded in the presence of increasing amounts of CT-DNA. In the UV spectra of the three complexes, after the addition of increasing DNA concentrations, the band centered at ~275 nm exhibits a significant hypochromic shift of ~ 50% (Figure 6, Figure S9), accompanied by a small red shift, suggesting strong binding to CT-DNA, possibly by intercalation. Complex (1) was tested under the same conditions and strong binding was evident after the addition of small DNA amounts; however, saturation of the reaction was rapidly reached, further additions of DNA did not bring any significant change in the spectrum and results could not be fitted to a suitable curve.

The binding constants (Kb) of (2) and (3) with CT-DNA (Table 3), are of ~104 M−1, smaller than those of classical and metallo-intercalators, with Kb values of ~107 M−1.62-64 Therefore, fluorescence titration experiments were carried out to further investigate the competitive binding of (1)–(3) with ethidium bromide-bound DNA.
| Complex | Kb (M−1) | Ksv (M−1) |
|---|---|---|
| (1) | - | 1.55 × 10⁵ |
| (2) | 1.12 × 10⁴ | 1.14 × 10⁵ |
| (3) | 2.17 × 10⁴ | 1.18 × 10⁴ |
Ethidium bromide (3,8-diamino-5-ethyl-6-phenyl-phenanthridinium bromide, EB) emits intense fluorescence in the presence of CT-DNA, as a consequence of EB intercalation between DNA base pairs. When the metal complexes bind to DNA, a decrease in the emission intensity of the EB-DNA complex is recorded (a quenching effect). This variation of the fluorescence emission intensity usually indicates the existence of stacking interactions (intercalation) of the metal complexes between the DNA base pairs.
An EB-bound CT-DNA solution was used as a spectral probe. The emission spectra of EB-DNA complex in the absence and presence of increasing concentrations of the ligand and complexes (1)–(3) are shown in Figure 6, Figure S9. Ksv values (Table 3) indicate that the complexes bind to CT-DNA with binding affinities that vary in the following order: (1) > (2) > (3) > 5-HOF.42 (1)–(3) display higher binding affinities than the ligand (note that 5-HOF is planar in the complexes, whereas free 5-HOF has a non-planar conformation), which suggests that the complexes may interact with DNA via intercalation, while another mechanism is probably involved in the 5-HOF-binding to DNA (e.g. groove binding).
3.4 Protein binding studies
Due to the observation that the DNA binding studies do not correlate well with the cytotoxic activities of the complexes, protein binding studies were carried out by fluorescence quenching experiments. These studies were based on the body of research indicating that group 13 metal ions and complexes bind to the serum transport proteins transferrin and albumin, and that the investigation of drug-proteins interactions is relevant to the pharmacokinetics of the tested compounds.[65 and ref. therein]
Transferrin (Tf) is involved in transportation of metal ions (mainly Fe (III)) throughout the organism.34 Cancer cells express high levels of Tf receptors, making Tf a potential drug carrier for targeted delivery into tumor cells.66 Due to the iron-mimicking ability of gallium, Ga (III) is mostly bound in plasma to Tf. At pH = 7.4, transferrin is also the major Al (III)-binding component of plasma, followed by human serum albumin (HSA).67 HSA is the most important transport protein for a large number of endogenous and exogenous ligands, metal ions, and metal complexes, and allows for multiple types of binding modes.59
The following data describes a systematic study of the mechanisms and binding parameters by means of spectroscopic techniques and molecular docking, as well as the energy transfer efficiency and distance. Fluorescence spectroscopy is an effective method to explore the interactions of small molecules with proteins that contain tryptophan residues, such as HSA and Tf. Therefore, insights into the nature of binding can be obtained from fluorescence quenching studies, by monitoring the fluorescence intensities.
3.4.1 Fluorescence quenching mechanism
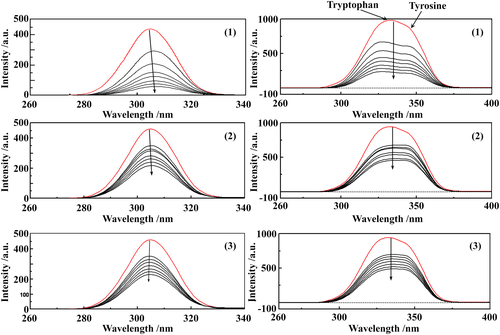
Tryptophan (Trp), tyrosine (Tyr) and phenylalanine (Phe) amino acid residues in Tf have intrinsic fluorescence depending on the excitation wavelength. However, with fluorescence excitation at 295 nm, the tryptophan emission fluorescence can be isolated from that of Tyr and Phe.20 HSA exhibits a strong fluorescence emission peak at ~340 nm (when λexc = 280 nm) due to the Tryptophan (Trp) residue. The quenching effects of complexes (1)–(3) on the fluorescence intensities of Tf and HSA at three different temperatures (298, 308, 318 K) are shown in Figure S11-S16. The curves resulted from the fluorescence intensity variations, depicted in Figure S17, S18, show good linear relationships.
The intensity of the broad emission band decreases upon addition of increasing concentrations of the complexes. The maximum emission wavelength of Tf is not shifted for complexes (2) and (3), but a small bathocromic shift appears in the spectra of complex (1). This red-shift effect indicates that the microenvironment around the tryptophan residue is disturbed, that the Trp residue is located in a less hydrophobic environment, becoming more exposed to the solvent. On the other hand, the maximum emission wavelength of HSA exhibits a hypsochromic shift of up to 6 nm for complexes (2) and (3), but no shift is observed for complex (1). This blue-shift effect indicates that the Trp residue is located in a more hydrophobic environment, becoming less exposed to the solvent.68
The Stern–Volmer quenching constant (KSV, M−1) and the quenching rate constant (Kq, M−1 s−1) for the ligand and the complexes calculated from our studies are given in Table 4 (Tf) and Table 5 (HSA). These values suggest good binding affinity of the complexes for the two proteins. Kq values (>1011 M−1 s−1) indicate the existence of a static quenching mechanism.69 For all complexes, the values of n (∼1) suggest the existence of a single binding site in both Tf and HSA.
| Complex | T (K) | Ksv (M−1) | Kq (M−1·s−1) | Ka (M−1) | n | ΔH (kJ·mol−1) | ΔS (J·mol−1·K−1) | ΔG (kJ·mol−1) |
|---|---|---|---|---|---|---|---|---|
| (1) | 298 | 4.76 × 10⁴ | 1.94 × 10¹³ | 2.26 × 10⁷ | 1.45 | −125.47 | −281.10 | −41.70 |
| 308 | 1.00 × 10⁵ | 4.00 × 10¹³ | 3.24 × 10⁶ | 1.26 | −38.89 | |||
| 318 | 1.50 × 10⁵ | 6.00 × 10¹³ | 9.42 × 10⁵ | 1.14 | −36.08 | |||
| (2) | 298 | 1.47 × 10⁵ | 5.88 × 10¹³ | 1.13 × 10⁴ | 0.85 | −43.59 | −68.84 | −23.76 |
| 308 | 1.42 × 10⁵ | 5.68 × 10¹³ | 6.08 × 10³ | 0.80 | −22.39 | |||
| 318 | 1.38 × 10⁵ | 5.52 × 10¹³ | 3.73 × 10³ | 0.75 | −21.70 | |||
| (3) | 298 | 1.39 × 10⁵ | 5.56 × 10¹³ | 1.57 × 10³ | 0.67 | −35.04 | −56.45 | −18.22 |
| 308 | 1.36 × 10⁵ | 5.44 × 10¹³ | 9.75 × 10² | 0.65 | −17.65 | |||
| 318 | 1.28 × 10⁵ | 5.12 × 10¹³ | 6.44 × 10² | 0.62 | −17.09 |
| Complex | T (K) | Ksv (M−1) | Kq (M−1·s−1) | Ka (M−1) | n | ΔH (kJ·mol−1) | ΔS (J·mol−1·K−1) | ΔG (kJ·mol−1) |
|---|---|---|---|---|---|---|---|---|
| (1) | 298 | 3.75 × 10⁵ | 3.75 × 10¹³ | 4.98 × 10⁶ | 1.22 | 50.84 | 298.31 | −38.06 |
| 308 | 0.95 × 10⁵ | 0.95 × 10¹³ | 8.15 × 10⁶ | 1.27 | −41.04 | |||
| 318 | 0.57 × 10⁵ | 0.57 × 10¹³ | 1.82 × 10⁷ | 1.35 | −44.02 | |||
| (2) | 298 | 4.68 × 10⁵ | 4.68 × 10¹³ | 1.32 × 10⁵ | 0.92 | 69.80 | 332.89 | −29.40 |
| 308 | 3.84 × 10⁵ | 3.84 × 10¹³ | 4.17 × 10⁵ | 1.02 | −32.73 | |||
| 318 | 2.18 × 10⁵ | 2.18 × 10¹³ | 7.74 × 10⁵ | 1.07 | −36.06 | |||
| (3) | 298 | 6.75 × 10⁵ | 6.75 × 10¹³ | 7.03 × 10⁵ | 1.02 | 91.99 | 421.44 | −33.60 |
| 308 | 2.26 × 10⁵ | 2.26 × 10¹³ | 3.17 × 10⁶ | 1.17 | −37.81 | |||
| 318 | 1.13 × 10⁵ | 1.13 × 10¹³ | 7.21 × 10⁶ | 1.25 | −42.03 |
The negative values of ΔG listed in Tables 4 and 5 indicate that the protein binding processes are spontaneous. For Tf, both ΔH and ΔS values are negative for all of the tested compounds, therefore, hydrogen bonds or van der Waals forces most probably play important roles in the compound-Tf interactions. It can be seen that the values of ΔH and ΔS are both positive, which indicates that the main interactions between the complexes and HSA are hydrophobic.37
Based on the values of the binding constant, Ka, the complexes bind to Tf and HSA with affinities that vary in the following order: (1) > 5-HOF > (2) > (3) and (1) > 5-HOF > (3) > (2). Ka values for 5-HOF have been taken from ref.42
As a preliminary conclusion, the results from the protein interaction studies correlate well with the cytotoxic activity of the complexes. (1) displayed the highest binding affinity towards both HSA and Tf, This observation suggests that the weak activities of (2) and (3) is more likely caused by a poor incorporation, due to reduced transportation, of the metal ions inside the cancer cells. Therefore, we employed further studies in order to confirm the interaction of the metal complexes with serum proteins.
3.4.2 Changes of protein conformations induced by the interaction with the tested compounds
Synchronous fluorescence spectra bring information about the molecular surroundings and the conformational changes of a protein in terms of secondary or tertiary structures, which can be altered upon binding to small molecules. One major advantage of this method is that even small variations in the absorption and/or emission bands affect the corresponding band in a synchronous spectrum to a greater extent than in the case of a conventional emission spectrum. This improves spectral resolution, thus facilitating the analysis of minor structural perturbations.37, 38, 69 Therefore, we have used synchronous scan fluorescence spectroscopy in order to bring further evidence of the structural changes in Tf and HSA after binding to the complexes.
Synchronous fluorescence spectra depict the characteristics of the Tyr and Trp residues of proteins when the wavelength interval (Δλ) between excitation and emission is set at 15 or 60 nm, respectively. The synchronous spectra in the absence and presence of different concentrations of (1)–(3) are shown in Figure 7 (for Tf) and Figure S19 (for HSA). At Δλ = 60 nm, we have noticed that the emission maxima of Tyr does not shift, whereas there was a small blue shift (of up to 10 nm) of tryptophan residues fluorescence upon addition of the tested compounds. This indicates that the conformation of Tf around the Trp residues had changed, the polarity around this region had decreased and the hydrophobicity had increased.38 In the synchronous spectra of the HSA systems no considerable shift is observed in the emission maxima after the addition of (1)–(3).
3.4.3 3D fluorescence spectra
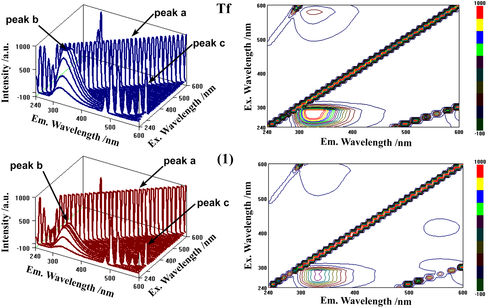
To further ascertain the conformational change of the proteins induced by the complexes, 3D fluorescence spectroscopy was performed. The conformational and micro-environmental changes of Tf and HSA can be obtained by comparing the 3D fluorescence spectral changes of the proteins in the absence and presence of the complexes. Figure 8 shows the 3D fluorescence spectra and corresponding contour maps of Tf and complex (1). The 3D fluorescence spectra of complexes (2)/(3) - Tf systems are shown in Figure S20 and those of HSA and complexes (1)/(2)/(3) – HSA systems, respectively, in Figure S21. In the 3D spectra of complexes (1)–(3), the fluorescence intensities of peaks b and c decrease, which suggests that the binding sites are located in the proximity of the Trp or Tyr residues in Tf/HSA structures and that the binding processes induce slight unfolding of the peptide strands of the proteins.
3.4.4 Energy transfer and binding distance
Fluorescence resonance energy transfer (FRET) occurs when a radiationless transfer of energy occurs from an excited donor to a suitable acceptor fluorophore. FRET is a distance-dependent photophysical process, which takes place via long-range dipole–dipole coupling mechanism.
Figure 9 and Figure S22 depict the spectral overlaps that show the fluorescence resonance energy transfer processes. The calculated values of E, J, R0 and r are presented in Table 6. r is in the range of 2–8 nm and 0.5R0 < r < 1.5R0, indicating that the energy transfer between the complexes and the proteins has taken place, and static quenching mechanisms were confirmed for the interactions of the complexes with the proteins.70

| Protein | Complex | E | J × 10−14 (nm4 M−1 cm−1) | R0 (nm) | r (nm) |
|---|---|---|---|---|---|
| Tf | (1) | 0.56 | 1.89 | 2.69 | 2.58 |
| (2) | 0.32 | 3.45 | 2.97 | 3.35 | |
| (3) | 0.41 | 3.38 | 2.96 | 3.14 | |
| HSA | (1) | 0.42 | 2.57 | 2.94 | 3.09 |
| (2) | 0.56 | 4.14 | 3.18 | 3.06 | |
| (3) | 0.52 | 3.64 | 3.12 | 3.08 |
3.4.5 Molecular docking studies
Two main binding sites, located in subdomain IIA (site IIA) and subdomain IIIA (site IIIA) (Figure 10) of HSA, are of pharmacological interest. These sites are also known as Sudlow site I, which usually hosts bulky negatively charged heterocyclic compounds, and Sudlow site II, which has high affinity for small aromatic compounds, respectively. Site IB (located in subdomain IB) has also been acknowledged as a binding pocket for various pharmaceutical drugs and natural compounds.59 Transferrin is a carrier protein with a single polypeptide chain comprising two distinct, yet structurally similar lobes (denoted as the N-terminal and C-terminal lobes, respectively), separated by a short α-helix peptide.71
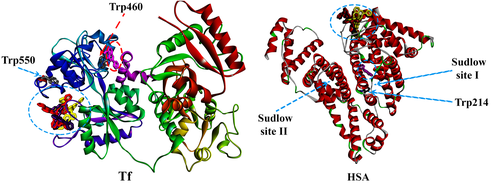
In order to investigate the interactions of the ligand and the three metal complexes with Tf and HSA more thoroughly, molecular docking simulations were performed. All the docking poses were evaluated and the preffered binding pockets have been identified and represented in Figure 10. The three metal complexes interact with protein residues via electrostatic (π-anion and π-cation), van der Waals and hydrophobic (π-alkyl and π-π stacking) interactions. 5-HOF interacts with Tf and HSA via van der Waals and hydrogen bonds (Figure S23, Figure S24). Its binding pocket is situated in the proximity of HSA Sudlow site I (Figure 10, Figure S24).
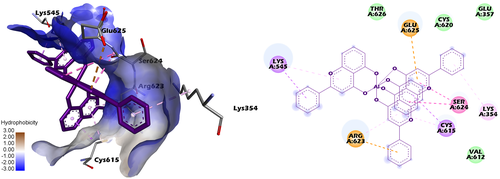
The binding pockets in Tf (Figure 11, Figure S25, Figure S26) for the three complexes are surrounded by electrically charged (Lys545, Arg623, Glu625, Asp633), polar (Thr626, Cys615, Cys620) and some nonpolar residues (Pro547, Phe619, Gly617). The three complexes show higher binding affinity towards the C-lobe domains in the Tf structure. Moreover, the long distances from the Fe3+ binding site in the C lobe make reasonable the assumption that the complexes and the Fe3+ ions do not interact. Figure 10 shows that the complexes are in proximity of the Trp550 residue (at a distance of ~ 10 Å), which corresponds to the observations from our synchronous fluorescence experiments, confirming the possibility of the conformation shift of Tf around the tryptophan residues.
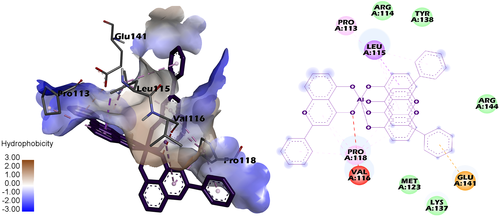
The binding pockets in HSA (Figure 12, Figure S27, Figure S28) for the three complexes are surrounded by electrically charged (Lys137, Arg144, Glu141), polar (Thr133, Tyr138, Tyr161) and, with prevalence, by nonpolar residues (Pro113, Pro118, Val116, Leu115, Met123). One of the three molecules of the ligand is inserted into a more hydrophobic subcavity, whereas the other two are surrounded by charged residues (Arg114, Arg144, Glu141, Lys137) and are more accesible to the solvent. The mean distance to the Trp residue is of ~ 26 Å, which may explain the quenching effect of the complexes observed in the fluorescence experiments. Moreover, since the distance is too long for the complexes to induce a conformational change in the protein structure around the Trp residue, these results could also explain the paucity of any considerable shift in the emission maxima after the addition of the complexes in the synchronous spectra of the HSA systems.
Numerous HSA-binding drugs interact with Sudlow site I or II in the protein structure (Figure 10). The three complexes show higher affinity towards the aminoacid residues in HSA subdomain IB, thus suggesting that it is unlikely for them to compete with other HSA-binding drugs. The binding sites in subdomain IB are close to that of Tris(8-quinolinolato) gallium (III) (KP46), an antitumor drug currently undergoing clinical trials.59
4 CONCLUSIONS
Primuletin (5-hydroxyflavone) forms in the selected working conditions three new complexes with Al (III), Ga (III), In (III). These complexes have been characterized by elemental analysis, thermal analysis (TG, DTA), conductometric measurements and several spectroscopic techniques (FT-IR, UV–Vis, mass spectra). From the experimental data, along with the DFT calculations, the general formula of the complexes has been established to be [M (C15H9O3)3] · nH2O, with an octahedral arrangement of the three deprotonated ligand molecules surrounding the central trivalent metal ion. The cytotoxic activity of 5-hydroxyflavone and its complexes was evaluated on HeLa, LoVo, MCF-7 and Sk-Ov-3 cancer cell lines. Complex (1) displayed the most potent cytotoxic activity against all four cancer cell lines. The complexes interact with CT-DNA with binding affinities varying in the order: (1) > (2) > (3) > 5-HOF. Furthermore, the tree new complexes and the ligand interact with transferrin and human serum albumin with binding propensities varying in the following order: (1) > 5-HOF > (2) > (3) (for Tf) and (1) > > 5-HOF > (3) > (2) (for HSA); these results are further supported by the estimated binding energy values resulted from the molecular docking studies. The three complexes show higher binding affinity towards the C-lobe domains in the Tf structure and the aminoacid residues in subdomain IB in the HSA structure. The cytotoxic activity of the complexes appears to be correlated with the binding affinity towards serum proteins, which suggests that their cytotoxicity is correlated with the incorporation of the metal ions into cells via protein transport. In conclusion, this is one of the first reports on Al (III), Ga (III), In (III) complexes with a flavonoid derivative as anticancer agents, opening up the possibility of intensive studies regarding the biological properties of similar complexes. Further studies on target identification and structure optimization for increased cellular uptake, appear to be justified.
ACKNOWLEDGMENTS
This paper was published with the financial support of FDI grant CNFIS-FDI-2018-0507, funded by National Council for Higher Education, Ministry of National Education (Romania).


