A Magnetic Resonance Imaging-Chemical Exchange Saturation Transfer (MRI-CEST) Method for the Detection of Water Cycling across Cellular Membranes
Graphical Abstract
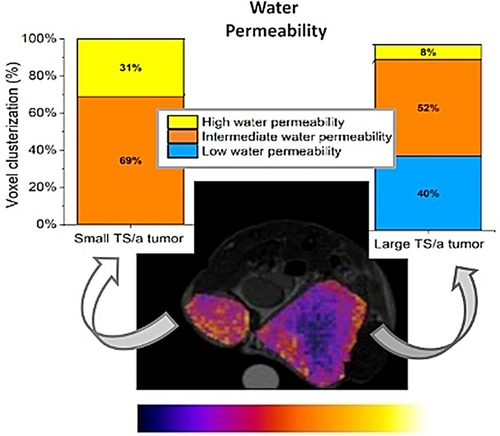
A Magnetic Resonance Imaging-Chemical Exchange Saturation Transfer (MRI-CEST) method to image and quantify in vivo water cycling across cell membranes is reported. Parametric MRI-maps can be obtained that report, for each voxel, the degree of water permeability across cells. Cell membrane water permeability is a biomarker of cancer aggressiveness and can be used to monitor chemotherapy, as demonstrated in murine models of breast cancers.
Abstract
Water cycling across the membrane transporters is considered a hallmark of cellular metabolism and it could be of high diagnostic relevance in the characterization of tumors and other diseases. The method relies on the response of intracellular proton exchanging molecules to the presence of extracellular Gd-based contrast agents (GBCAs). Paramagnetic GBCAs enhances the relaxation rate of water molecules in the extracellular compartment and, through membrane exchange, the relaxation enhancement is transferred to intracellular molecules. The effect is detected at the MRI-CEST (Magnetic Resonance Imaging - Chemical Exchange Saturation Transfer) signal of intracellular proton exchanging molecules. The magnitude of the change in the CEST response reports on water cycling across the membrane. The method has been tested on Red Blood Cells and on orthotopic murine models of breast cancer with different degree of malignancy (4T1, TS/A and 168FARN). The distribution of voxels reporting on membrane permeability fits well with the cells’ aggressiveness and acts as an early reporter to monitor therapeutic treatments.
Introduction
Precision medicine calls for innovative in vivo diagnostic tools for accurate tumor phenotyping. Among the available imaging techniques, the superb spatial and temporal resolution makes Magnetic Resonance Imaging (MRI) the candidate of choice for the in vivo characterization of tumors. This imaging modality relies on its peculiar ability to report on minor differences in the macromolecular content and in the proton relaxation times (T1 and T2, often expressed in terms of their respective relaxation rates, R1 and R2) in the considered anatomical districts. The use of Gd-based contrast agents (GBCAs) adds further physiological information to MR images as they markedly affect the water proton relaxation rates in the regions where they distribute. Their use is strongly recommended in oncological diagnoses as it allows an accurate delineation of tumor lesions. Nowadays, about 40 % of the scans acquired in clinical settings make use of GBCAs.1, 2 The contrast agents distribute in the extracellular space of the tumor region thanks to the leakiness of vessels in the neo-formed tumor vasculature.3 The application of Dynamic Contrast Enhanced (DCE-MRI) protocols allow to extract information on the kinetics of the extravasation (Ktrans) and on extracellular/extravascular space (Vex) that are relevant parameters for pursuing an enhanced tumor characterization. Actually, the perturbation induced by the presence of the paramagnetic agent on the relaxation rate of the extracellular water protons may also affect the relaxation of the water molecules in the intracellular compartment thus allowing, in principle, to get some insight about the extent of water exchange across the cellular membrane. The equilibrium water exchange occurs through either passive mechanisms (simple diffusion across the lipid bilayer and through aquaporin membrane protein channels) and active mechanisms through membrane transporters, directly related to the cell metabolism. The active component is much larger than the passive contribution, for mammalian cells Na/K-ATPase being considered the most active transporting system. Water is also co-transported with metal ions, metabolites and nutrients.4, 5
In tumors, the level of water exchange across the cellular membrane is considered a hallmark of metabolism as the enhanced metabolic activity of tumor cells induces the overexpression/up-regulation of the trans-membrane transporting system either to attain the required uptake of nutrients from the extracellular environment or to remove the metabolites from the intracellular compartment. Although the extent of the water cycling across cellular membranes affects the readout in MR medical images, its specific contribution is difficult to assess at the magnetic field strengths employed in clinical scanners because the difference in the relaxation rates between the intra- and extra-cellular compartments is of the same order of the water exchange rate across the compartments. Much work has been done along the years to get more insight into this matter. Highly relevant is the seminal work done by C. S. Springer and co-workers through the fitting of the DCE-MRI data to the two-site exchange (2SX) system of equations to quantify the exchange between the two water pools.6, 7 Using the “shutter-speed” pharmacokinetic paradigm, it was shown that one can evaluate the exchange rate constant between the intra- and extra-cellular compartment provided that a sufficiently large difference in the relaxation rate (R1) of the two compartments can be obtained through the addition of paramagnetic GBCAs in the outer space.8 Whereas the approach works well in the case of homogeneous cell suspensions with GBCA’ concentrations in the mM range9, 10 obvious limitations are encountered in vivo where the GBCA's concentration in the tumor region is in the range of tens of micromoles/L. Nevertheless, by exploiting the increasing and decreasing concentrations of the paramagnetic GBCA during the DCE time course, C.S. Springer et al. were able to extract maps reporting on the distribution of membrane water exchange in the tumor region.11 However, it is evident that the range of GBCA concentration commonly achievable in vivo does not allow to match with the optimal needs of the slow exchange regime (SXR), i.e. to reach the condition that allows to exploit the departure from the monoexponentiality of the magnetization decay curves. Thus, an alternative approach to tackle the task of the water exchange across the cell membrane appears necessary as its knowledge would allow an improved diagnostic characterization, for instance providing new insights into the metabolism and malignancy of tumors and other diseases.
In recent years a new contrast enhancing procedure is under intense scrutiny for widening the field of applications in respect to what can be obtained with the currently used relaxation- based systems.12, 13 It relies on the transfer of saturated magnetization to the bulk water signal operated by the transfer of exchanging protons properly irradiated with a second irradiation radiofrequency field (CEST=Chemical Exchange Saturation Transfer).13-17 Several endogenous and exogenous molecules have been so far investigated as CEST CAs, with very interesting applications in the field of cancer phenotyping and neurological diseases.18 For instance, CEST CAs have been exploited as probes able to map extracellular tumor pH,19 to gain insights into the presence of specific enzymes in the tumor region20-23 or to quantify the presence of specific ions in the tumor (e.g. zinc ions in the prostate cancer).24, 25
Very importantly, several endogenous species contain exchangeable protons (in the slow/intermediate exchange regime on the NMR time scale) that can be exploited in the CEST experiment. Two signals are ubiquitously present in biological tissues, namely a signal centered at ca. 3.5 ppm due to the amide groups on proteins (amide proton transfer, APT)26 and a signal centered at ca. 2 ppm that was assigned to creatine and generic amines (named CEST@2ppm).27-32
Where [CEST] is the concentration of the endogenous exchanging proton pool and [bulkWp] the concentration of the bulk water protons (i.e. ca. 110 mol/L).
In the presence of a paramagnetic GBCA in the extracellular region, the T1 of the intracellular bulk water protons is expected to decrease on the basis of the relaxivity and concentration of the GBCA (that varies upon time as consequence of the wash-in/wash-out processes in the tumor region) and the water exchange rate across the cell membrane. In principle, when all involved determinants of the experiment are constant, one expects that the ST% from the intracellular CEST signals decreases with the decrease of the intracellular proton water T1 to an extent that, in turn, reflects the permeability of the tumor cell membrane.
The herein reported work aims at investigating the water membrane permeability by measuring the changes at the endogenous CEST@2ppm signal in the presence of a clinically approved GBCA, using Red Blood Cells (RBCs) and in vivo transplantable murine models of breast cancer (BCa) characterized by a different degree of malignancy. BCa is the most common cancer in women, with a very high incidence. It still represent the primary cause of cancer-associated death in women in many countries35 Systemic chemotherapy remains the main treatment for triple-negative breast cancer (TNBC), advanced BCa, and high-risk luminal cancers36, 37 with Doxorubicin being commonly used as neoadjuvant.35
Since chemoresistance is common in both advanced and early BCa, methods for in vivo assessment of the effect of chemotherapy are needed. For this reason, herein we expanded the analysis of water membrane permeability to BCa murine models after application of a conventional Doxorubicin based treatment.
Results and Discussion
Assessment of the effect of paramagnetic Gd-based contrast agents on the endogenous CEST@2ppm signal: mathematical simulations and in vitro results
The GBCA selected for this study was Gd-HPDO3A (Gadoteridol, marked as ProHance, Bracco Imaging, S.p.A.) (chemical structure in Figure 1A). It is a small-sized, neutral, hydrophilic, clinically approved GBCA, widely used both at preclinical and clinical level. It is characterized by a high kinetic and thermodynamic stability, high biocompatibility and its relaxivity, i.e. the relaxation enhancement brought by the paramagnetic complex at 1 mM concentration, is 4.4 mM−1s−1 at 298 K.38 When administered via intravenous injection, Gd-HPDO3A quickly distributes in the tumor extracellular compartment with the typical wash-in/wash-out kinetics expected for small-sized hydrophilic agents.
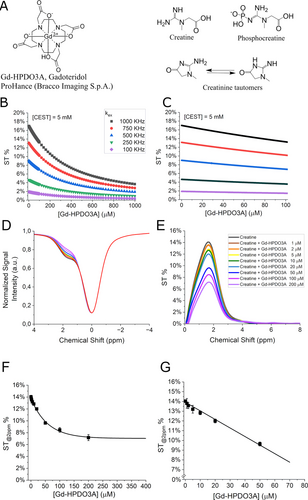
(A) Chemical structures of Gd-HPDO3A (Gadoteridol, ProHance®, Bracco Imaging, S.p.A.), creatine, phosphocreatine, creatinine. (B) Mathematical simulations using eq. 1 and eq. 2 with the parameters reported in Table 1 over 0–1 mM concentration range of Gd-HPDO3A. (C) Magnification of ST% data reported in Figure 1 B over the 0–0.1 mM concentration range of Gd-HPDO3A. (D, E) In vitro CEST experiments reporting Z- and ST% spectra of creatine (5 mM) in PBS (1 mM), in the presence of different Gd-HPDO3A concentrations represented by the different colors as indicated in (E). (F, G) Observed ST% values against Gd-HPDO3A concentration (0–0.4 mM in (F) and 0–0.05 mM in (G)) upon the application of a pre-saturation pulse amplitude (B1) of 3 μT for 2 s. Data are shown with mean and SD.
We aimed at estimating the amount of water exchange across cellular membranes through the modulation of the endogenous intracellular CEST signal by means of a paramagnetic agent distributed in the extracellular space.
In our work, the so called “CEST@2ppm”27 was chosen as intracellular CEST signal instead of APT to avoid the possible bias in the calculation of the CEST effect associated to the presence of the Nuclear Overhauser Effect (NOE) signal at −3.4 ppm.13, 16, 26, 39
CEST@2ppm is due to the exchangeable protons of creatine, creatinine and other amines, resonating at about 2 ppm from the bulk water signal (chemical structures are shown in Figure 1A). Since no confounding signal at −2 ppm is present, the analysis of CEST@2ppm should result simpler and more robust than APT.
As a preliminary test to support the feasibility of the proposed approach, the effect of the paramagnetic perturbation on the CEST signal was assessed by numerical simulations using a generic pool of exchanging protons over the range of reasonable concentrations expected in the tumor region for a GBCA administered at the clinically adopted doses. The simulations have been carried out by using eq. 1 and eq. 2 with the parameters reported in Table 1 and the R1 values calculated, for the different concentrations of the GBCA, on the basis of the relaxivity of Gd-HPDO3A.
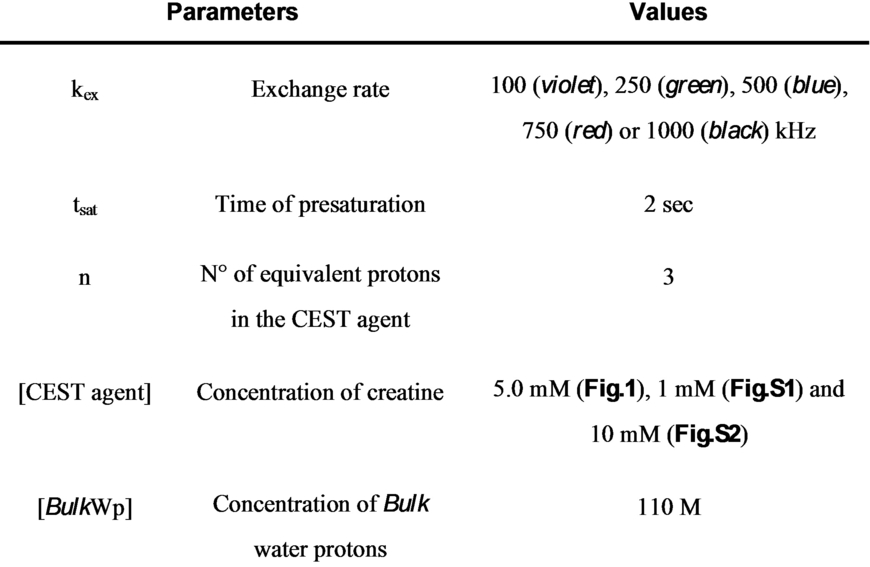
The simulations were carried out considering different concentrations of the pool of exchanging protons (5.0 mM in Figure 1B, 1 and 10 mM in Figure S1 and Figure S2, respectively) and different proton exchange rates (kex). This was considered useful since the contribution of the molecular species generating the CEST@2ppm signal may vary and the effect of the tumor environment (e.g. pH, chemical composition, etc.) on kex is not predictable. In the simulation, kex values ranging from 100 to 1000 kHz were explored, i.e. values in line with the one calculated for creatine by using the omega plot40, 41 method (see Figure S3) and with other previously reported ones.27, 30
It is worth noting that in the tumor region the attainable concentration of Gd-HPDO3A, upon injection of clinically approved doses, is expected to be in the order of tens of μM.
The numerical calculations, over the Gd-HPDO3A concentration range from 0 to 1 mM, showed the expected exponential decrease in the CEST response, at all tested kex values, due to the decrease of water proton T1 caused by the increased concentration of Gd-HPDO3A. However, it was found that when [Gd-HPDO3A] is in the 0–100 μM range (i.e. in the typical concentration range expected for Gd-HPDO3A administered at the clinical doses in the tumor region), its effect on ST% response from the mobile creatine protons displays an almost linear dependence. (Figure 1C). Hence, for the aim of this work, one can assume a simple inverse relationship between the decrease in ST% in the CEST experiment and the concentration of GBCA.
Next, in vitro experiments were carried out on a creatine containing phantom ([Creatine]=10 mM in Phosphate Buffer Saline buffer, PBS) in the presence of variable amounts of Gd-HPDO3A. In agreement with the results obtained in the mathematical simulations, the ST % decreased with the shortening of water proton T1 with a linear behavior when the [Gd-HPDO3A] is in the 0–50 μM range (Figure 1D–G).
Effect of biological membranes on the change of CEST@2ppm signal in the presence of GBCA in the extracellular compartment
In the above experiments, Gd-HPDO3A and creatine (the main component of the CEST@2ppm signal) were in the same compartment, thus only one R1 value had to be considered. When the paramagnetic agent and the CEST molecules are in compartments separated by a semipermeable biomembrane, the water proton relaxation time of the inner compartment (from where the CEST effect is generated) is markedly affected by the water exchange between the two compartments. To model this condition, we carried out experiments to evaluate the effect of GBCA (0–200 μM range) on the endogenous intracellular CEST signals of RBCs.42 From relaxometric studies it is known that the RBC membrane is highly permeable to water molecules (the intracellular water lifetime was reported to be ca. 19 ms).10, 43 In the CEST experiment, as shown in Figure 2A–D, the ST% decreased from 17.5 % to 9 % when the concentration of Gd-HDPDO3A passed from 0 to 200 μM.
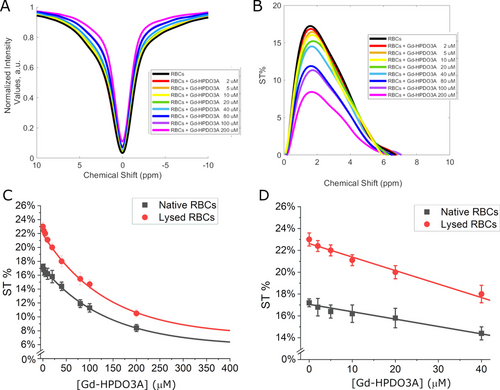
(A) Z- and (B) ST%- spectra (at 2 ppm) of murine RBCs (Hematocrit=30 %) in the presence of variable Gd-HPDO3A concentration. (C) Curves reporting the ST% values vs. [Gd-HPDO3A] (0–0.4 mM range). (D) Magnification of the data reported in (C) in the 0–0.04 mM range for native (black) or lysed (red) RBCs with pre-saturation pulse amplitude at B1=3 μT for 2 s. Data are shown with mean and SD.
The effect of other Gd-complexes (Gd-DPTA, Gd-BOPTA, Gd-AAZTA) on RBCs CEST response was also acquired. The obtained results confirmed that the differences in the observed CEST responses is ascribable to the relaxivity of the used GBCA, i.e. to their ability to shortening water proton T1, and not to other peculiarities associated to the chemical structure of the probes (Figure S4). When RBCs were lysed by osmotic shock, the effect of Gd-HPDO3A on the ST% response markedly increased. (Figure 2C, D red lines). The increase in the ST% is the consequence of the rupture of the membrane with the formation of a single phase containing both the paramagnetic agent and the molecules responsible for the CEST effect.
In vivo assessment of CEST@2ppm signal in the presence of Gd-HPDO3A in the extracellular compartment in three transplantable models of breast cancer
Next, the in vivo investigation on murine transplantable BCa models using three different tumor cell lines was undertaken and the experimental work up is shown in Figure 3.
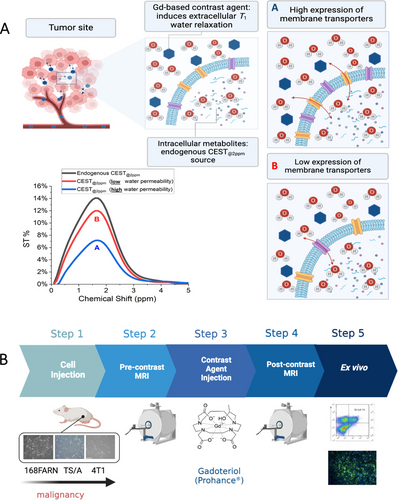
(A) Chart showing the rationale of the in vivo experiments. The GBCA-relaxed water molecules enter the cells as function of the activity of the membrane transporting system. According to the extent of water cycling different ST% responses are expected, i.e. high water exchange (A, blue line) or low water exchange (B, red line). (B) The Chart summarizes the in vivo experimental set-up.
The murine models were prepared by subcutaneous injection of 168FARN, 4T1 or TS/A tumor cells in both flanks of BALB/c mice.
4T1, TS/A and 168FARN tumor cells are considered models of BCa cells endowed with high, intermediate and low level of aggressiveness, respectively.
Tumor were analyzed 2 weeks after cell implantation, when they reached the size of ca. 300 mm3 (TS/A and 4T1) and ca. 150 mm3 (168FARN).44 Gd-HPDO3A was i. v. injected at the dose of 0.1 mmoles/Kg b.w.) and both CEST-MRI (CEST@2ppm signal) and T1w-MRI were acquired immediately after the injection and monitored for about one hour post injection. As for the in vitro experiments, the endogenous CEST signal selected for the assessment of the changes induced by the presence of the GBCA was the so called “CEST@2ppm” (signal derived from the pool of exchangeable protons of creatine, creatinine, phosphocreatine, and other endogenous amines). The GBCAs quickly extravasates from the vascular space to distribute in the extravascular/extracellular compartment without entering tumor cells (see Figure 3).
The changes in the CEST ST% response of the intracellular, endogenous exchangeable protons is then dependent on the amount of water crossing the cellular membrane whose proton T1 values are shortened upon the interaction with the paramagnetic GBCA (Figure 3). GBCAs bring an overall relaxation enhancement of the intracellular water protons that, in turn, affect the ST% signal of intracellular endogenous exchangeable protons (eq. 1–2).
Figure 4A, B and C report the maps of endogenous ST@2ppm for the three tumors (i.e. 168FARN, TS/A and 4T1) showing a quite homogeneous distribution of the response inside the tumor region for all the three tumor models. Maps reporting the decrease of ST@2ppm upon injection of 0.1 mmol/kg b.w. of Gd-HPDO3A are shown in Figure 4D, E and F. They report, voxel per voxel, in false color scale, the amplitude of the ST@2ppm decrease immediately after the i. v. injection of the GBCA bolus. On the basis of the relationship between ST% drop and membrane permeability to the passage of water from the extra- to the intra-cellular space, blue-colored voxels represent low permeability values, whereas yellow/red voxels represent higher permeability values. By comparing the ST@2ppm values immediately after the arrival of the bolus of the GBCA in the tumor region, interesting differences among the three models were noted. In the case of 168FARN tumors, the overall ST@2ppm values remain similar to those observe in the native images with a homogeneous distribution of voxels, almost all displaying a low water permeability (blue voxels) (Figure 4D). In the case of TS/A tumor, there is a more heterogeneous distribution of voxels, with an overall lower permeability in the tumor core (blue voxels) and a higher water permeability in the rim (red/yellow voxels) (Figure 4E). In the case of highly aggressive 4T1 tumors, the overall ST@2ppm decrease is higher, with most of the voxels displaying high water permeability (red/yellow voxels) (Figure 4F).
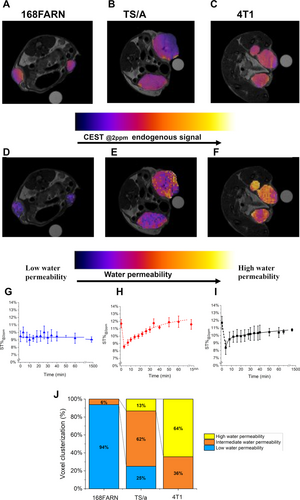
(A–B–C) Endogenous ST@2ppm maps for 168FARN, TS/A and 4T1 murine models, respectively. (D–E–F) Water permeability MRI maps for 168FARN, TS/A and 4T1 murine models, respectively. (G-H-I) Kinetic curves of the averaged ST@2ppm vs. time after the i. v. injection of Gd-HPDO3A bolus measured over all the tumor region of 168FARN, TS/A and 4T1 transplantable models, respectively. (J) Histogram reporting clusterization of voxels into three groups, namely i) low water permeability, ii) intermediate water permeability and iii) high water permeability. Data are shown with mean and SD. (N=6 mice, corresponding to 12 tumors, for each tumor type).
When the observed ST% values in tumor ROIs are reported vs. time (Figure 4G, H and I) one can appreciate that, for the highly aggressive 4T1 cells and intermediate aggressive TS/A cells, a minimum of ST@2ppm corresponding to ca. 30 % and ca. 26 % of the native values is reached, respectively. Thus, the typical behavior of the changes in ST%@2ppm values of aggressive tumors upon the administration of the GBCA shows that an immediate drop of the ST% signal takes place immediately after the arrival of the GBCA followed by a slow recovery towards the pre-contrast ST%. Highly explicative of the differences among the three tumors are the histograms reporting the distribution of the voxels of D, F and E images upon clusterization in i) low, ii) intermediate and iii) high water permeability values (Figure 4J).
The obtained CEST maps add significant information to conventional T1w-MRI (Figure S5, S6 and S7 (right column) for 168FARN, TS/A and 4T1 murine models, respectively). T1enh% maps (see Supporting Information) show a higher signal in the tumor rim respect to tumor core for the three tumor types, whereas the “permeability” maps allowed an enhanced differentiation as well as the detection of heterogeneity inside the same tumor. The changes of T1enh% vs. time are reported in Figure S8.
Further evidence of the potential of this method is reported in Figure 5, where differently sized TS/A tumors are present at the two flanks of the same mouse. The endogenous CEST image shows relatively similar contrast for the two tumors (Figure 5A, left). Only a small hyperintense spot in the inner part of the larger tumor is present, probably ascribable to the presence of necrosis.
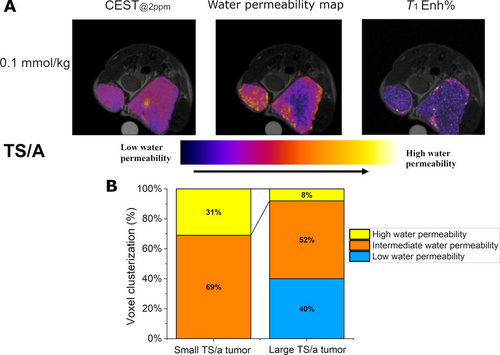
(A) Endogenous CEST@2ppm map, w/o contrast (left), upon the administration of the GBCA (middle) and related T1enh% map (right) for a mouse bearing two differently sized TS/A tumors at its right and left flanks. (B) Histogram reporting the clusterization of the voxels, from the CEST image upon the administration of the GBCA, into three groups, namely i) low water permeability (blue), ii) intermediate water permeability (yellow) and iii) high water permeability (orange).
Also, the T1enh% map appears to be relatively uniform with hyperintense spots in the most vascularized areas such as the rim of the tumor (Figure 5A, right).
Overall, one may conclude that the T1w image shows that both tumors are sufficiently perfused with a homogeneous distribution of the GBCA.
Conversely, the water permeability map (ST@2ppm maps) appears markedly less uniform (Figure 5A, middle) yielding a larger % of voxels characterized by higher permeability values in the small tumor in respect to the larger one (Figure 5B).
This finding does not appear to be related either to the native CEST response or to an unpaired distribution of the GBCA. Thus, the detection of a large number of hyperintense spots appears to be a genuine reporter of enhanced metabolism that yields fast exchange of water molecules across the transporters at the tumor cell membrane. This yields to high permeability values for most areas of the small tumor and still remarkable values for about half of the peripheral regions of the large tumor are observed.
Assessment of Aquaporin expression in 4T1, TS/A and 168FARN cells
To get further support for the role of transporters in cycling water across the cellular membranes of tumor cells we measured the expression of Aquaporins (AQPs) in the three investigated tumor models. AQPs are a family of small transmembrane proteins that facilitate the selective transport of water following an osmotic gradient across cell membranes.45 They are essential in regulating water balance. Their expression is linked to an increased likelihood of BCa recurrence, metastasis, and overall poor prognosis.46 As shown in Figure 6, the expression of Aquaporin 4 (AQP-4) is markedly different in the three tumors, with 4T1 tumors expressing high levels, TS/A tumors expressing intermediate levels and 168FARN tumors expressing low levels as assessed by ex vivo whole tumor fluorescence activated cell sorting (FACS) analysis and immunofluorescence staining of AQP-4.
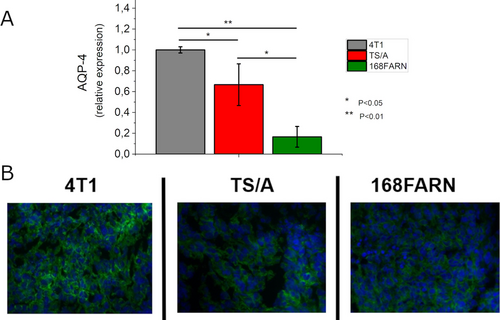
Expression AQP-4 in the three tumor models (4T1 grey, TS/A red and 168FARN green) as assessed by ex vivo whole tumor FACS analysis (A) and immunofluorescence staining (B). Data of (A) are shown with mean and SD. *, p<0.05; **, p<0.01. (N=6 mice, corresponding to 12 tumors, for each tumor type).
Thus, this finding is consistent with the above reported CEST readouts highlighting the relationship between the expression of one of the important water transporters and the observed differences in water transport across membranes.
The three cell types were previously tested for the expression of Na/K ATPase and GLU- Transporters and the obtained results were consistent with those herein observed for AQP-4.47
Evaluation of chemotherapy effect by measuring water permeability across cell membranes
Next, it was deemed of interest to consider whether the water cycling across cell membranes could be useful to monitor the effects of an undertaken therapy. To this end we applied the above reported method to 4T1 tumor xenografts treated with Doxorubicin. This drug is one of the commonly employed in the treatment of TNBC, like 4T1 tumors.35, 36 For the experimental work up, mice were inoculated under the skin with 4T1 cells and the treatment with Doxorubicin started after 10 days after tumor cells implantation (three administration of 5 mg Doxorubicin/kg b.w. every four days).
The results are reported in Figure 7. The native CEST@2ppm signal is ca. 12 %, well in agreement with the above reported ones of untreated 4T1 tumors (Figure 7A and D).
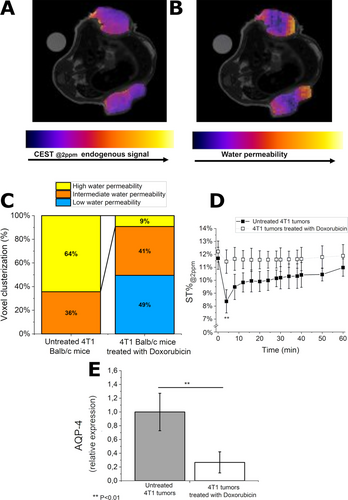
(A) Endogenous CEST@2 ppm map, w/o contrast and (B) water permeability map of BALB/c mice treated with Doxorubicin upon i. v. injection of Gd-HPDO3A. (C) Histogram reporting clusterization of voxels in three categories: i) low water permeability, ii) intermediate water permeability and iii) high water permeability. (D) Curves of the ST@2ppm intensity vs. time after injection of Gd-HPDO3A. (E) Relative expression of AQP-4 in the control and treated groups as assessed by ex vivo whole tumor FACS analysis. Data are provided with mean and SD. **, p<0.01.(N=6 mice, corresponding to 12 tumors, for each tumor type).
A representative water permeability map of 4T1 tumors after the treatment with Doxorubicin is reported in Figure 7B. It reports a large heterogeneity in tumor water permeability. Half of the voxels are at low water permeability (blue voxels) and they are mainly distributed in the tumor core (Figure 7B and C). Conversely, the tumor rim is rich in voxels at intermediate water permeability (orange voxels, Figure 7B and C).
By comparing the histograms of water permeability clusterization between untreated and Doxorubicin-treated mice (Figure 7C), one may envisage that the treatment strongly reduces water permeability. In fact, the percentage of high-water permeability voxels decreases from 64 % to 9 % upon application of the treatment.
Figure 7D reports the ST@2ppm values (averaged over all the tumor region) vs. time after injection of Gd-HPDO3A. Whereas the untreated tumors showed a marked ST% drop (ca. 30 %), in the tumors treated with Doxorubicin the observed drop is definitively much smaller. In fact, only about 5 % of ST@2ppm decrease after injection of Gd-HPDO3A was observed (Figure 7D). This result is remarkable at the light of the fact that at the same time, no relevant difference in the tumor volume size was detected between the treated and the control mice (data not shown). The analysis of AQP-4 showed a marked decrease in the expression of this transporter upon the Doxorubicin treatment (Figure 7E).
Discussion
The CEST signal is strongly affected by the T1 of the water protons in the medium where the proton exchanging molecules are dissolved. From the analytical expression of the CEST response (eq. 1,2) it is evident that the effect of T1 of water protons is complex bringing either a linear or an exponential dependence. Upon screening, both by numerical simulations and experimentally, the effect of the paramagnetic Gd-HPDO3A at the concentrations expected to occur in the tumor ECM, we concluded that the exponential contribution can be neglected and the effect on the observed CEST signal can be accounted in terms of a simple, inverse dependence on the changes in R1 of the water solvent protons.
The acquisition of the ST% response from an endogenous, intracellular CEST signal upon the effect of the paramagnetic GBCA in the extracellular region allows to get information on the extent of the water passage across the cellular membrane. Actually, this effect was already investigated by Kai et al. by measuring APT data in patients with internal carotid stenosis.48 They found post-contrast drops in the range of 10–20 % of the pre-contrast values. In spite of the relatively small changes observed for this pathology, the conclusion from this work was that APT imaging should be performed prior to Gd administration to avoid potential misinterpretation of the APT effect. In another study devoted to assess the role of T1 on the APT response, Li et al.49 used a GBCA to modulate tissue T1 in tumor-bearing rats. As expected, they found that measurements of APT contrast may be significantly contaminated by R1 variations. Thus, to avoid rapid variations of R1, ATP maps were acquired 13 minutes after the GBCA injection. Conversely our work aimed at exploiting the maximum effect of the paramagnetic perturbation that occurs in the extracellular space to extract information on the inter-compartmental water exchange, a parameter of paramount importance not easily accessible by other experimental procedures. First the method was validated on a suspension of RBCs added with different amounts of Gd-HPDO3A. The RBC membrane is considered highly permeable to water molecules and therefore the effect on the intracellular CEST signal resulted quite strong. The 50 % reduction of the native ST% was reached when the [Gd-HPDO3A] was equal to ca. 200 μM. Considering the inverse proportionality between the observed ST % drop and the actual R1, this condition corresponds to averaged intracellular R1 value of about 0.5 s−1 when the extracellular value is about 1.0 s−1. One expects that the intracellular relaxation rates are actually represented by a continuum of values with the highest one (the closest to R1ex) at the first inner layer in contact with the membrane, with a progressive decrease on moving out of it (Scheme 1).
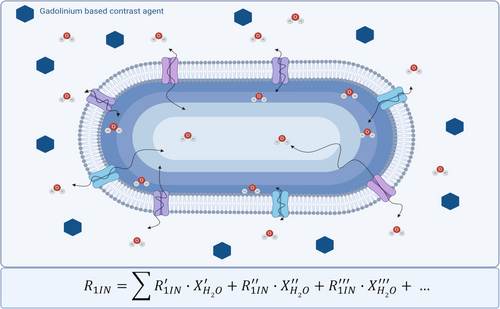
Sketched representation of the effect of the paramagnetic perturbation in the extracellular space on the proton relaxation rate of the water molecules in the intracellular compartment.
Therefore, the averaged R1in value results from the sum of several R1 values each multiplied for the estimated water molar fraction corresponding to a given layer (Scheme 1).
In this schematic representation the relaxation time of water protons depends on the “random walk” the water molecule undertakes upon its entering in the transmembrane transporter system. The associated time determines the actual decay of the “memory” of the relaxation enhancement of the water protons after their move from the outer space where the paramagnetic GBCAs are located. Although it is not possible to access to the individual R1 values of the envisaged intracellular layers, the access to the averaged R1 for the intracellular water is sufficient for the intended scope of stratifying cells on the basis of the overall water exchange across their membranes. Actually, this view may also help to shed new light on the effect of GBCAs in generating contrast in T1w-MR images as the contribution arising from the intracellular water could have a different role according to the metabolic state of the involved tissue.
where R1in is actually an averaged value of a plethora of values (as shown in Scheme 1) determined by the actual relaxivity, concentration of the GBCA and the number, type and activity of the transporters on the cell membrane. As reported in Figure 2C and D, the paramagnetic effect is markedly higher when the RBC are lysed thus allowing their content to be in direct contact with the GBCA. The ratio between the ST% values of lysed and intact RBCs is a reporter of the role of the RBC membrane to differentiate R1ex from R1in.
Water flows into or out of the cells, i.e. causing the cells to expand or to shrink, basically as a consequence of the changes in the local osmotic pressure associated to the ongoing metabolic processes. Osmotic water flow follows the formation of gradients of impermeable solutes and accompanies the corresponding homeostasis processes following the solute movements across the transmembrane proteins that act as transporters for any ions/molecules. In tumors, the extent of water exchange across the cellular membrane may be considered as a hallmark of tumor cell metabolism. In this work we proved that the presence of a clinically approved MRI contrast agent in the extracellular space may affect the T1 of the intracellular water protons in a way that reflects the relative aggressiveness of the tumor cell lines. The induced effect is quite substantial as it may cause the marked decrease (up to about 50 %) of the endogenous CEST signal. We show that the voxels corresponding to the “minimum” ST% values, i.e. a condition that is reached at very short times after the GBCA i. v. injection, can be suitably mapped to represent the distribution of tumor cells characterized by high, medium and low permeability. Actually, the voxels’ distribution may be conveniently clustered under histograms that yield an immediate quantitation of the occurred permeability changes over the entire tumor region.
In the case of 168FARN, the lack of any effect on ST% after the Gd-HPDO3A injection (0.1 mmol/Kg b.w.) appears consistent with the occurrence of a low metabolic state for this non-proliferative tumor cell line. Conversely the observation that, in the case of 4T1 and TS/A tumors, there is a marked ST% drop is taken as an indication of an ongoing high metabolism in these highly proliferative and metastatic cell lines. The new readout about the membrane permeability to water can be integrated with the information provided by DCE-MRI50 and Diffusion Weighted Imaging (DWI) MRI studies for attaining an enhanced characterization of the tumor lesion. Upon comparing the water permeability maps with the DCE-MR images it is immediately evident that the higher local concentration of GBCA corresponds invariably to the areas characterized by higher membrane permeability, i.e. areas of intense tumor growth. However, a much greater heterogeneity is observed in the maps reporting on the permeability parameter.
Moreover, it has been found that, in the considered tumor murine models, the expression of Aquaporins parallels the order of the estimated water permeability. Also, previous relaxometric (not imaging) measurements on other transmembrane transporters yielded an analogous response.47 Our in vivo results are also consistent with the assessment of tumor acidosis which showed an analogous order, 4T1, TS/A≫less aggressive tumor cells.51
Besides the 2SX approach developed by Springer C. Jr. and co-workers, several MRI attempts have been done to access to the “water membrane permeability” parameter for instance by modifying diffusion-based approaches52-54 but they do not appear yet a sufficiently robust methodology to map this parameter. Moreover, mapping this biomarker using the herein described methodology appears immediately translatable to clinical scanners as the GBCA is used at the doses currently administered for diagnostic purposes. Actually, the introduction of new high relaxivity agents will allow to work with significantly lower doses (i.e. 0.025 mmol/Kg b.w. in respect to the commonly used of 0.1 mmol/kg).55 It is expected that the access to MR images reporting on the overall membrane permeability to water will open new routes to the knowledge of the metabolism in tumors and in other diseases. We showed that the method is very useful for an early monitoring of the effects of the undertaken therapeutic treatment. The disappearance of the ST% drop for the Doxorubicin treated mice clearly indicates that the water cycling across the cellular membrane is a highly responsive marker of the metabolic changes induced by Doxorubicin well before than the effect could be visualized by the changes in size and in vascular permeability.
Conclusion
In summary, the results reported herein pave the way for a novel use of the intra-cellular CEST response. In fact the changes induced by the presence of a paramagnetic species in the extracellular space can be exploited to report on phenomena occurring at the cellular membrane. The method brings relevant information on the water cycling across the cell membrane related to the ongoing metabolism. The obtained results are consistent with previously reported observations made with a relaxometric approach lacking spatial resolution.56, 57 One can envision several applications for targeting and responsive agents that affect water proton relaxation rates whose changes can be efficiently detected through their impact on the intracellular CEST response. Herein we have shown that the method makes it possible to assess tumor aggressiveness in lesions of different sizes.
Supporting Information
The authors have cited additional references within the Supporting Information.
Acknowledgments
We gratefully acknowledge for funding the PNRR M4C2-Investimento 1.4-CN00000041 “Finanziato dall'Unione Europea-NextGenerationEU” (G.F.), the Italian Ministry of University and Research for the FOE contribution to the EuroBioImaging MultiModal Molecular Imaging Italian Node (www.mmmi.unito.it) and the Grants for Internationalization (GFI) of the University of Torino (Unita Montium partnership) (G.F.; E.D.G.). This publication is part of the project NODES which has received funding from the MUR—M4C2 1.5 of PNRR with grant agreement no ECS00000036 (G.F.). IRCCS SDN SynLab acknowledges the support from Partenariato Esteso “MNESYS—A multiscale integrated approach to the study of the nervous system in health and disease”. GIDRM/Borse Annalaura Segre-Donatella Capitani was gratefully acknowledged (C.P.).
Conflict of interest
The authors declare no conflict of interest.
Open Research
Data Availability Statement
The data that support the findings of this study are available from the corresponding author upon reasonable request.


