Analysis of the Dynamics of the Human Growth Hormone Secretagogue Receptor Reveals Insights into the Energy Landscape of the Molecule
Graphical Abstract
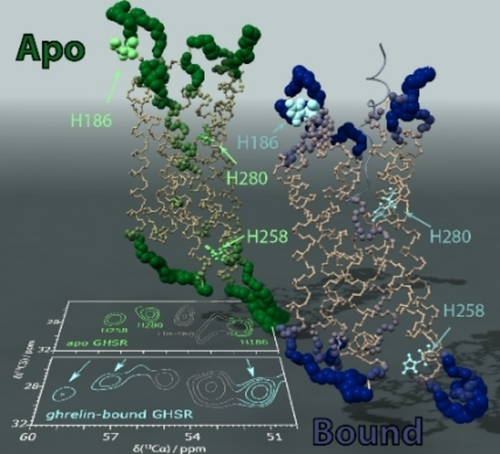
The total amplitude of reorientational motion extracted from MD is plotted on the GHSR molecule for apo (inactive, left) and ghrelin-bound (active, right) GHSR. Decrease in dynamics at histidine residues H2586.30 and H2806.52 upon ghrelin-binding shifts the NMR resonances to higher ppm values, whereas H186ECL2 sees smaller changes in the total motion and correspondingly has a smaller change in chemical shift.
Abstract
G protein-coupled receptors initiate signal transduction in response to ligand binding. Growth hormone secretagogue receptor (GHSR), the focus of this study, binds the 28 residue peptide ghrelin. While structures of GHSR in different states of activation are available, dynamics within each state have not been investigated in depth. We analyze long molecular dynamics simulation trajectories using “detectors” to compare dynamics of the apo and ghrelin-bound states yielding timescale-specific amplitudes of motion. We identify differences in dynamics between apo and ghrelin-bound GHSR in the extracellular loop 2 and transmembrane helices 5–7. NMR of the GHSR histidine residues reveals chemical shift differences in these regions. We evaluate timescale specific correlation of motions between residues of ghrelin and GHSR, where binding yields a high degree of correlation for the first 8 ghrelin residues, but less correlation for the helical end. Finally, we investigate the traverse of GHSR over a rugged energy landscape via principal component analysis.
Introduction
Food intake is one of the most fundamental processes for all species. The signal for appetite is generated by the peptide hormone ghrelin secreted in the stomach whenever food is physiologically required. Ghrelin, a 28 amino acid long peptide with an n-octanoyl modification on Ser3, binds the growth hormone secretagogue receptor (GHSR), a representative of the class A G protein-coupled receptors (GPCRs) and initiates signaling predominantly through Gq-protein activation.2 Remarkably, GHSR has a high (≈50 %) basal activity, which was evolutionary essential for survival. However, in our current situation, where food is practically always excessively available, increasing cases of eating disorders and obesity represent tremendous challenges for our societies and the health care systems, rendering GHSR an attractive drug target. While the receptor shares many characteristic features of other class A GPCRs, it stands out with regard to the presence of a wide gap between transmembrane helix 6 (TM6) and TM7 due to the positioning of five phenylalanine residues, F2796.51, F2866.58, F2906.62, F3097.39 and F3127.42 (superscript corresponds to the Ballesteros Weinstein nomenclature3) contributing to the formation of two cavities, separated by a salt bridge between E1243.33 and R2836.55 within the ligand binding pocket.4 These phenylalanines form a hydrophobic environment crucial for the binding of ghrelin. This unique feature promotes the entry of the acyl-modification and the N-terminal region of ghrelin into their respective cavities4, 5 inducing GHSR signaling.6
Deep insights into the different binding mechanisms of GHSR were gained recently from the first crystal structure in 2020 for an antagonist bound GHSR,4 shortly followed by cryo-electron microscopy (cryo-EM) structures of the ghrelin-bound GHSR in complex with Gq,7 Gi,8 and Go9 proteins. However, to understand the complexity of GHSR signaling, dynamics data are a necessary complement to these structural discoveries. GPCRs are recognized as highly dynamic molecules10 and rather complex energy landscapes have been suggested as the basis to explain their activation cycle.11 In the last decades, experimental tools such as EPR,12 NMR,13 or fluorescence spectroscopy,14 and computational molecular dynamics (MD) simulations10 have helped characterize the rich conformational dynamics of GPCRs. These methods proved that they are subject to complex conformational equilibria that are populated in all states of activation. Binding of ligands, G-proteins, or arrestin shift the population of individual states. While this description represents an attractive model to understand GPCR function, our knowledge of these energy landscapes of GPCRs remains in its infancy.15
Here, we describe the equilibrium of conformational states of GHSR in the inactive apo and the active ghrelin-bound form using long MD trajectories (three simulations of 35.5 μs for each state). While cryo-EM data for the active state is available,7 the inactive apo state was prepared from the antagonist bound structure4 for the MD simulation (for details see Supporting Information: Methods). In order to analyze these simulations, we combine our own detector analysis,16 which provides a means of obtaining timescale-resolved quantitative characterizations of motion, with the more familiar principal component analysis (PCA). Via detector analysis of motional amplitude and cross-correlation, we characterize details of motion that are easily missed without timescale resolution. By also applying PCA, we can visualize the structural changes occurring as GHSR traverses a rugged energy landscape, and how those changes result in the dynamics parameters on the microsecond timescale. The approach yields a new vantage point from which to characterize GPCR dynamics, and highlights the contrasting behavior of the inactive and active states, for motions ranging from ≈100 s of ps to ≈5 μs. NMR spectra of specifically labeled GHSR samples (13C/15N-His labeling) of the apo- and ghrelin-bound states are also consistent with the MD results, supporting the presented approach, and suggesting potential for application to similar systems. Both MD simulations and NMR samples were prepared without cholesterol, which may represent an important lipid component to influence receptor dynamics.17
Results and Discussion
Comparison of the GHSR Dynamics in the Apo and Ghrelin-Bound State—Detector Analysis Identifies Dynamic Hotspots
To first identify dynamically interesting regions in GHSR, we compare the MD trajectories of apo and ghrelin-bound GHSR. As an indicator of local dynamics, we investigate the backbone H−N bond reorientational dynamics using detector analysis, which allows the timescale-specific characterization of motion.16a-16c Detector analysis returns amplitudes of motion for seven timescale windows from ps to μs (termed ρ0–ρ6) as detailed in Figure 1. The final detector of the MD analysis (ρ6) is effectively an order parameter, increasing in size where less motion occurs, or where motion is too slow to be captured by the 35.5 μs MD trajectories. All other detectors increase when amplitude increases within their window.
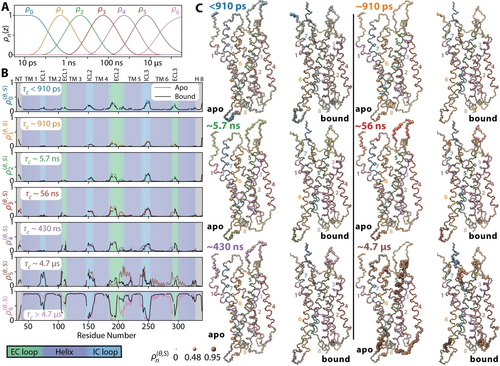
Detector analysis of the MD trajectories of apo and ghrelin-bound GHSR. A) sensitivities of seven detector windows used to characterize the timescale-specific reorientational dynamics of the H−N bond. B) detector responses for each window of the apo (color) and bound (black) states. The background indicates whether the residue lies in a helix (deep blue), extracellular loop (green), intracellular loop (cyan), or in the termini (grey). Mean amplitudes for each detector are indicated in each subplot, where ρ0 captures all motion faster than ≈910 ps. ρ6 acts as an order parameter (S2), where larger amplitude indicates either less reorientational motion, or that the motion has a correlation time longer than the sensitive range of the previous detector (≈5 μs). A detector analysis was also performed for each of the individual trajectories (6 total), found in Supporting Information Figure S5. C) detectors from B (ρ0–ρ5) plotted onto the GHSR protein with increasing atom radius and color intensity indicating larger amplitude of motion. Bonds are colored to correspond with helices 1–8, as indicated by numbers on the plots. Ghrelin is always shown in grey. Molecule plots throughout this paper were prepared in ChimeraX.1
From ρ6 (Figure 1B), we obtain an overview of the total motion of GHSR. Significant dynamic differences occur between apo and ghrelin-bound GHSR, with some more pronounced alterations occurring in the loops and in TM5. We also notice that parts of TM6 and TM7 are more dynamic in the apo form. The oscillating response of ρ5 and ρ6 (Figure 1A) observed in this region is characteristic of overall helix motions,18 where the local influence of the motion depends on the orientations of the individual H−N bonds.
Only considering the total motion, however, underestimates the differences between apo and ligand-bound states. If we view ECL2 in particular, we find that while the total motion is similar (ρ6), large differences are observed in ρ0–ρ5, as better seen in Figure 2A. In the apo form, motion is broadly distributed across ρ0-ρ5, whereas in the ghrelin-bound form, dynamics are more concentrated in ρ5 (correlation time ≈5 μs), indicating similar amplitude of motion but much slower dynamics in ghrelin-bound GHSR. We also observe changes in the ECL3 dynamics, where amplitudes are similar for apo and bound GHSR for ρ0–ρ4, but the apo form exhibits significantly higher dynamics for ρ5.
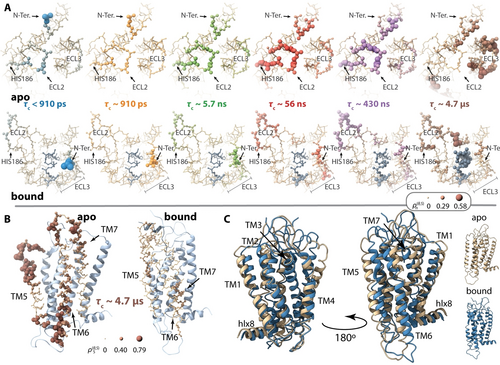
A) Cα–Cβ reorientational dynamics in ECL2 and ECL3 as a function of timescale for apo (top) and ghrelin-bound (bottom) GHSR. Viewpoint is from above the membrane (extracellular side), where atom radius and color intensity indicate amplitude of reorientational motion. Ghrelin is always shown in slate grey. Timescale windows are the same as in Figure 1A. B) Cα–Cβ reorientational dynamics of TM5–TM7 for ρ5 (≈4 μs). C) overlays the averaged apo (tan) and ghrelin-bound (blue) structures (averaged over all MD trajectories) from two viewpoints.
The differences in TM5–TM7 are also of particular interest to GHSR function, noting that it is well established that TM6 must move outwards for G-protein binding upon ligand binding.4, 7, 8, 11b, 19 An examination of detector responses in Figure 1B/C reveals that the motional differences are concentrated in ρ5, corresponding to ≈5 μs. For a better view, we zoom into this region and timescale in Figure 2B. In the apo form, the extracellular part of TM5 exhibits the most motion outside of loop regions. Although having lower amplitude than TM5, TM6 and TM7 are also more dynamic in the apo form than in ghrelin-bound GHSR. Note that the increased ECL3 dynamics observed in Figure 2A (ρ5) are almost certainly coupled to this motion, since ECL3 sits between TM6 and TM7. Of particular interest for GHSR function, the intracellular part of TM5 and TM6 exhibit increased dynamics compared to the bound form. As TM6 must open to accommodate G-protein binding, these increased dynamics may eventually allow apo-GHSR to transform into the active state, although on average, the intracellular part of TM6 is located significantly further outward in the bound form, as seen in Figure 2C.
Next, we investigate whether the dynamics changes observed via MD are consistent with experiments, determine what interactions may be relevant for bringing about these dynamic changes via cross-correlation analysis, and investigate the specific structural changes occurring in GHSR via PCA.
Experimental Insights in the Dynamics of GHSR Activation from Three Histidine Residues
Any change in the local environment of a given residue is reflected as a variation of its 13C NMR chemical shift.20 Conformation-dependent NMR chemical shifts have been exploited to characterize the activation of several GPCRs.21 From the detector analysis of the MD trajectories, ECL2 and TM6 provide hotspots of dynamic alterations observed during GHSR activation. For an experimental validation of the structural dynamics in GHSR, biophysical probes in these receptor segments would be useful. Analyzing the receptor sequence reveals that histidine (His) residues are prominently distributed in these dynamic hotspots. Coincidently, the native GHSR sequence only contains three His residues, putatively resulting in the necessary low spectral complexity without the need for further mutagenesis to simplify the NMR spectra. Thus, His residues may report conformational changes of GHSR upon activation. H2586.30 and H2806.52 are found in the lower and upper parts of TM6, respectively. H186ECL2 is part of the ECL2, which showed different dynamics in the apo and the ligand-bound states.
The 13Cα-13Cβ region of the DARR NMR spectrum of apo GHSR recorded under magic-angle spinning (MAS) conditions is shown in Figure 3A. 13C/15N-His labeled GHSR was produced using cell-free (CF) expression and reconstituted into DMPC membranes in the apo and the ghrelin-bound state.22 Obviously, more than the expected three NMR signals are detected. The complication arises from the C-terminal 6× His-tag attached for purification, which is also labeled in CF synthesis. Nonetheless, we are able to assign the spectrum, using a strategy based on three pillars: first, the chemical shift index (CSI).23 This empirical analysis suggests that signals with 13Cα chemical shifts from 56–60 ppm represent α-helical structures and could belong to H2586.30 and H2806.52. Similarly, the NMR signals with 13Cα chemical shifts below 56 ppm, coinciding to random coil structures, could correspond to H186ECL2 and the His from the purification tag. Second, ShiftX24 and SHIFTX225 predicted the chemical shifts of the His residues based on the crystal structure of apo GHSR and is shown as crosshairs in Figure 3A. Third, a mutagenesis approach was adopted and three GHSR mutants (H186A, H280Q, and H258Y) were expressed, reconstituted and investigated by NMR (Figure 3B). H186A and H280Q were reported to be functional before,26 while H258Y is a known natural mutation of GHSR.27 All mutants showed good activity in vitro (Supporting Information Figure S1). While each mutation leads to some chemical shift change, areas lacking spectral intensity are identified yielding the peak assignment in good agreement with the chemical shift prediction and the general secondary structure assignment. Additional spectral intensity is assigned to the His-tag, which does not superimpose with the signals from the native His residues. With this assignment in hand, the spectral signature of activation-induced alterations in GHSR are characterized. Figure 3C compares the DARR NMR spectra of GHSR in the apo and ghrelin-bound states. Upon activation, both the Cα NMR peaks of H2586.30 and H2806.52 move downfield by ≈1.5 ppm, while the NMR signal of H186ECL2 moves slightly upfield by 0.4 ppm. It was not possible to discern changes in the chemical shifts of sidechain carbons due to line broadening and lack of sidechain assignments.
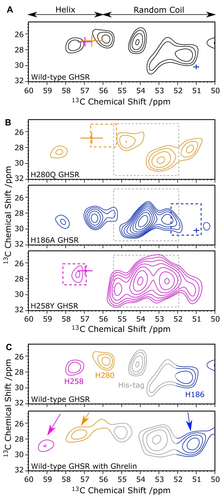
13C-13C DARR NMR spectra of 13C/15N-His-labeled wild type (WT) GHSR and mutants in DMPC membranes. A) Cα-Cβ section of DARR NMR spectrum of apo GHSR. Predicted chemical shift for H2806.52 (orange), H186ECL2 (blue), H2586.30 (magenta), averaged from ShiftX and ShiftX2 are displayed as crosses. B) DARR NMR spectra of 13C/15N-His-labeled GHSR mutants in the apo form. The His-tag signal is indicated by grey dotted boxes. The missing signals, corresponding to the substituted His, are indicated by colored boxes. C) DARR NMR spectra of apo and ghrelin-bound GHSR WT with the proposed assignment. Experiments were conducted at an MAS rate of 11 777 Hz at −30 °C with a mixing time of 10 ms.
The chemical shift changes of H2586.30 and H2806.52 are consistent with an increase in helical character upon ghrelin binding. While we expect these residues to be helical in both the apo- and bound forms, the increased mobility in the apo form will allow the sampling of more backbone torsional angles, and thus the averaged chemical shift will tend more towards random-coil, i.e., lower, chemical shifts. The slight alteration in peak position of H186ECL2 is consistent with an involvement of ECL2 in the structural alterations of GHSR upon activation as seen in the crystal/cryo-EM structures,4, 7, 8 and is also identified as the strongest detector responses in our analysis (Figure 1). However, for H186ECL2 we see a broad distribution of dynamics (≈100 s of ps to several μs) for both the apo and ghrelin-bound forms in ECL2, although with notably lower amplitude in the bound form for ρ0–ρ4. Interestingly, the change in dynamics in this range is mostly compensated by additional motion near 5 μs in ghrelin-bound GHSR (Figure 2A). Since the differences in detector responses indicate primarily a change in correlation time of motion rather than a large change in amplitude, the populations of torsional angles sampled may not be vastly altered, and thus the chemical shift also only sees minor changes. Note that microsecond motion can also have an influence on linewidths, via T2 relaxation, although with the signal-to-noise acquired, we were not able to determine linewidth differences to sufficient precision. As sample preparation improves, we hope to measure R1ρ to experimentally determine the timescale of slow motion, observed near 5 μs via MD.
Agonist-GHSR interactions via cross-correlation analysis
In the previous sections, we have seen significant alteration of dynamics in ECL2 and TM5–7. In particular, we see a shift in timescale of the motion of ECL2 and also the rigidification of TM5–TM7 upon ghrelin binding. This is accompanied by increased helical character of H2586.30 and H2806.52, seen via NMR spectroscopy. In order to better understand the change in dynamics, we first investigate interactions between ghrelin and GHSR via iRED cross-correlation analysis28 for motions around 5 μs correlation time (ρ5). This analysis yields correlation coefficients for motion falling within the ρ5 detector window. The results are shown in Figure 4 with site resolution for ghrelin. Note the timescale filter supplied by detector analysis is critical to obtaining the cross-correlation coefficients, since the total cross-correlation coefficients (motion from all timescales) are contaminated by significant contributions from fast, local dynamics (see Supporting Information Figure S2).
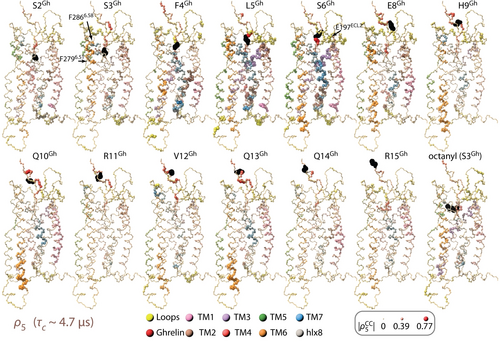
Correlation of motion between residues of ghrelin and GHSR, via correlation coefficients for H−N motion for ghrelin residues with all GHSR residues. Each copy of the ghrelin-GHSR corresponds to one residue in ghrelin (indicated at top with the corresponding residue in black). Radius and color intensity on all other residues encodes the correlation coefficient to the specific ghrelin residue. These correlation coefficients are timescale filtered using the ρ5 detector window (τc≈5 μs).
To understand the large change in ECL2 dynamics (Figure 2B), we first consider that the available cryo-EM data allows one to attribute changes in ECL2 dynamics to two single direct contacts between ghrelin and GHSR. In the ghrelin/GHSR/Gq complex, a hydrogen bond is identified between S6Gh and E197ECL2,7 whereas in the ghrelin/GHSR/Go complex, a hydrogen bond between R15Gh and E187ECL2 is described.9 Interestingly, our correlation analysis does not find an overall strong correlation between the motions of ghrelin and ECL2, but the specific correlation between S6Gh and E197ECL2 is noticeably higher than the correlation of S6Gh to other nearby residues (Figure 4).
We are furthermore interested in understanding the rigidification of TM5–TM7. We find correlation of ghrelin motion with the motion of GHSR, especially TM2 and TM3, and to a lesser extend ECL2, TM6, and TM7. A weaker correlation between S6 and TM5 can also be observed. For quantification, we counted the number of correlation coefficients exceeding 0.5 for the N-terminal and C-terminal segments of ghrelin with residues from GHSR confirming that the motions of the TM helices are predominantly correlated with the 7N-terminal residues of ghrelin (Supporting Information Figure S3). Interestingly, some of the strongest correlation with ghrelin residues 9–15 occur for the intracellular side of TM6 and the middle of TM1 and TM7. The strong correlation between ghrelin motion and TM5–TM7 motion indicates somewhat rigid connections between these regions, and can explain some of the reduction in dynamics in the helices. Assuming that TM6 dynamics and translocation is crucial for GHSR activation and its basal activity, this analysis also suggests that the sites where ghrelin residues S6Gh, H9Gh, Q10Gh, and Q13Gh interact with GHSR could be critical and may be targeted in rational drug development.
Accompanying the change in TM5–TM7 dynamics is the opening of the lower part of TM6 (Figure 2C); note that while TM6 is highly dynamic in the apo form, the simulation does not sample structures that would allow G-protein binding. This is in contrast to the bound form, where TM6 remains fixed in the open position, allowing space for G-protein binding. In addition to opening of TM6 in the bound form, TM5 partially unwinds near P2245.50, accompanied by a significant increase in dynamics around that residue (Figure 2B, right). The cryo-EM structure reveals that the first 7 residues of ghrelin penetrate the GHSR binding pocket and form molecular contacts with key residues in TM2, TM4, TM6, and TM7.7, 9 One assumes that the reduced dynamics of TM6 is caused by contacts described for TM6 (G1Gh-F2796.51and S3Gh-F2866.58), and indeed our analysis shows stronger correlation between ghrelin and TM6 in between these positions (Figure 4, see S3Gh), while also exhibiting increased correlation away from these interactions, on the intracellular side of TM6. Note that while we observe correlation to TM6, there are actually more significant correlations to TM2 and TM3 (Supporting Information Figure S3); although the motions of TM2 and TM3 are correlated with ghrelin dynamics, there are no noteworthy alterations in the amplitude of motions of these segments between apo and ghrelin-bound states.
A Cluster of Aromatic Sidechains Mediates Dynamic Changes of GHSR Initiated by the Toggle Switch W2766.48
While correlated motion between ghrelin and GHSR likely play an important role in the dynamic alterations upon ghrelin binding, disruption of specific interactions within GHSR may also have an impact. In particular, GHSR activation is initiated by interaction of G1Gh with F2796.51 as part of an aromatic cascade formed by W2766.48, F2796.51, and F3127.42 (referred to as WFF cluster).9 The swing of the toggle switch, W2766.48, leads to a structural change of F2796.51 initiating a cascade of relocations of other highly conserved residues. These are connected to the polar network associated with the interaction of ghrelin with F2796.51 which is connected to R2836.55 via cation-π interaction, and is located directly above F2796.51.9 For bovine rhodopsin, a cluster of closely packed aromatic sidechains mediate activation, and structural constraints of W2766.48 were found to be weakened upon activation.29 Aromatic residues are also important for the activation of other peptide-ligand receptors.30 In our analysis, we have both observed significant correlation of motion between ghrelin and GHSR, especially in TM2, TM3, ECL2, TM6, and TM7, primarily towards the center of the protein, with some correlation to TM6 on the intracellular side (Figure 4, Supporting Information Figure S3), and also the reduction of motion in TM5–TM7, near W2766.48. Then, we wonder if these dynamics changes are related to the closely packed aromatic sidechains of TM3 and TM5–7.
As a first step, we analyze the amplitude of motion of the W2766.48 sidechain in Figure 5A (left axis), where indeed, W2766.48 dynamics increase significantly upon ghrelin binding, especially for longer correlation times (ρ5). Then, we perform a correlation analysis of motion of the W2766.48 sidechain and nearby aromatic sidechains via iRED correlation analysis.28 We see motion of several aromatic sidechains surrounding W2766.48 become more correlated after ghrelin binding, most notably at H2806.52. However, other correlations are significantly reduced in the ligand-bound state. Similar trends in correlation are also observed at shorter correlation times. The change in correlation appears to primarily be an effect of breaking the interaction of W2766.48 with F2796.51, which correspondingly shows a loss in correlation with W2766.48.9 The breaking of this interaction is then accompanied by a decrease in correlation to some residues on the slowest timescale (ρ5, ≈5 μs), such as such as F2215.47, F2225.48, and F2265.52. On the other hand, especially for faster motion, correlation to many other residues increases, potentially because the broken interaction with F2796.51 allows W2766.48 to move more freely with other neighbors (Figure 5B).
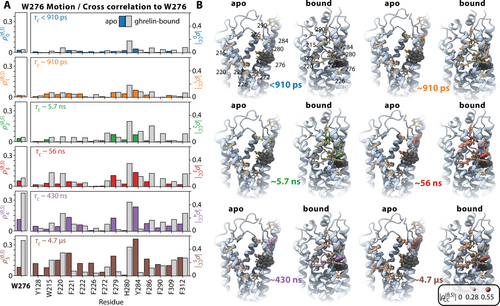
Correlated dynamics of the toggle switch W2766.48. A) detector response for reorientation of the W2766.48 sidechain (left axis), using the same detector windows as in Figure 1A. Responses are shown for both the apo (colored bars) and ghrelin-bound simulations (grey bars). On the right axis, we show the correlation of the reorientational motion of neighboring aromatic sidechains to W2766.48 for each detector window. B) plots the same correlations onto the GHSR structure highlighting the dependence of correlation on location in the molecule. W2766.48 is shown in black, correlation to W2766.48 is encoded as color intensity and atomic radius.
While we have previously noted that rigidification of TM6 can lead to decreased sampling of torsional angles in the backbone, and therefore greater helical character at H2806.52, as observed via NMR chemical shift, the significant change in interactions in the vicinity of W2766.48 may also have an impact on chemical shift. An interesting change is the hydrogen bond between H2806.52 and S2175.43 in the active cryo-EM structure7 that it is not present in the inactive structure.4 S2175.43 is an important residue as it stabilizes R2836.55 by a hydrogen bond. R2836.55 forms a salt bridge with E1243.33 in order to separate the ligand-binding pocket in two cavities.9 Like the interaction between H2806.52 and the S2175.43, the interaction between S2175.43 and R2836.55 was found only in the agonist-bound structure, suggesting that H2806.52 could also be important for the rearrangement of the polar network crucial for the contraction of the agonist-binding pocket of the GHSR.9
Rugged Energy Landscapes Describe the Apo and Ghrelin-Bound State of GHSR
In order to connect the above results describing reorientational dynamics to the sampling of distinct structures of GHSR, we performed a PCA of the GHSR backbone (N, C′, Cα). PCA separates translational motion in the MD trajectory into statistically independent modes, and sorts them from largest absolute variance to smallest, allowing one to determine the largest modes of motion for the apo and ghrelin-bound MD simulations. Histograms of the largest principal components often reveal that a protein jumps between a few distinct configurations. In Figure 6, we show 2D histograms as functions of the first four principal components, and select several of the most populated configurations of apo and ghrelin-bound GHSR (markers in Figure 6, left). To the right, we show the corresponding structures. Note that some of these structures occur late in the 35.5 μs trajectories (Supporting Information Figure S4), justifying long MD simulations. The largest difference between apo and bound dynamics is the rigidification of TM5–TM7 on the extracellular side upon ghrelin binding (Figure 6B). In apo GHSR, PCA indicates that this motion in apo GHSR is an outward motion of TM5 on the extracellular side accompanied by smaller either outwards or sideways motions of TM6 and TM7 on the extracellular side (Figure 6A, top, left). Smaller motions of these helices are also observed on the intracellular side. Multiple local maxima in the histograms indicate that several distinct configurations exist for TM5–TM7. This motion manifests as the reorientational dynamics in Figure 2B. It is critical to note that PCA does not reveal displacement of TM6 large enough to accommodate G-protein binding in the apo form. With a long enough trajectory, the protein should eventually transition to the active state, but even with 3×35 μs of simulation, the transition probability for activation remains low. In the ghrelin-bound form, TM6 is fixed in the open position. In contrast to the apo form, the largest structural changes in ghrelin-bound GHSR involve significant reorientation of ECL2, in addition to some small re-positioning of TM6 and of intracellular regions of TM5, TM7, and helix 8 (Figure 6B). Note that significant motion for ECL2 is also observed in apo GHSR (Figure 6A).
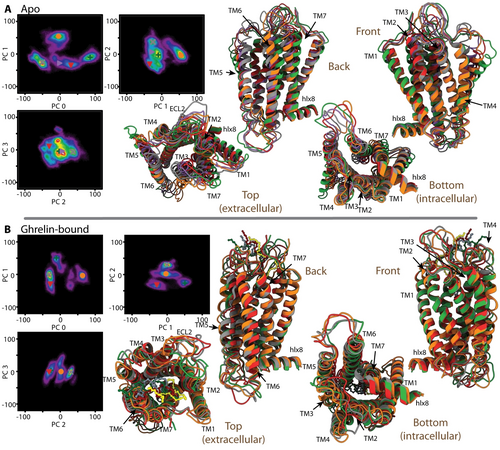
Principal component analysis of apo (A) and ghrelin-bound (B) GHSR. In each subplot, 2D histograms of pairs of principal components are show (components 0–3), with several positions marked with colored crosses on the plots. These positions are selected at local maxima in the histograms and correspond to the structures with the same color on the right. From this, one may identify how variation in the principal components manifests in the structure. In (B), ghrelin is shown as a ball and stick model, and is given a slightly different color than GHSR to make it more visible (red/maroon, grey/slate grey, green/dark green, orange/yellow).
Thus far, we have characterized site-specific dynamics in apo and ghrelin-bound GHSR, including evaluation of the degree of cross-correlation of motion. We have also looked at overall structural changes of the GHSR backbone using PCA. Of particular importance appears to be the rearrangement of helices TM5–TM7 in apo GHSR, observed both as high-amplitude dynamics using detector analysis (Figure 2) and as significant structural differences using PCA (Figure 6). By observing the values of PC0 and PC1 as a function of time in the three apo GHSR trajectories (Supporting Information Figure S4), we may estimate an approximate path through the PC0/PC1 histogram (Figure 6A), shown in Figure 7A. Figure 7B then estimates an energy landscape based on density of states at each point along the path (details found in the Supporting Information). Note that the MD trajectories are not long enough to fully equilibrate, so that the energy landscape should not be regarded as quantitative; we can identify the location and corresponding structures of local minima along the path, but the depths of the energy wells will not be accurate beyond a rough estimate (≈5 kJ mol−1). In particular, the population will be biased towards the starting state, thus underestimating its energy (indicated as grey dashed lines in Figure 7B).
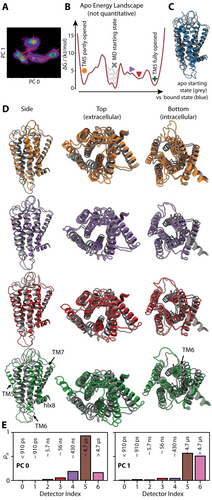
Pathway through structures sampled by apo GHSR. A) pathway through the 2D histogram of PC0 and PC1. B) free energy that corresponds to the populations along that path, assuming the populations are representative of equilibrium populations (grey dashed lines indicate that the energy near the initial state of the simulation is likely to be underestimated). C) compares the structure of the apo mean starting state (grey X in B) to the mean ghrelin-bound structure. D) selected structures from the pathway in A/B. The grey structure is the apo starting state (grey “X” in B), and the colored structures from top to bottom correspond to the orange circle, purple sideways triangle, red downwards triangle, and green “+”. E) detector analysis of the first two principal components, where each bar indicates the fraction of the total motion of that principal component occurring within each window.
Then, we can observe how apo GHSR progresses through a series of different configurations. In the starting configuration of the MD simulations (approximately located at the grey “X” in Figure 7A/B), TM5 is closed on the extracellular side of the protein, similar to the average configuration of the bound state. For comparison, see Figure 7C (grey: apo, blue: ghrelin-bound). From that initial state, TM5 opens on the extracellular side, either in coordination with an outward motion of TM6/TM7 (Figure 7D, top, orange), or a more sideways motion of TM6/TM7 (leftwards in the top view in Figure 7D, bottom, green). The opening of TM5 is significantly larger when occurring in concert with this sideways motion, and samples a number of metastable states (e.g. Figure 7D, middle plots, purple and red). Furthermore, it is accompanied by a small outward motion of TM6 on the intracellular side, although the extent of the motion is far from the amount that would be required for G-protein binding. In general, we see a very rugged energy landscape, characterized by many intermediate plateaus or wells in the free energy.
Finally, we may perform a detector analysis of the first two principal components of apo GHSR (Figure 7E), where we observe that these principal components impact primarily ρ5, i.e. motion with correlation times near ≈5 μs. PC2-PC4 also make significant contributions in this range, whereas smaller principal components contribute at shorter correlation times (see Supporting Information Figure S6). This analysis then confirms that much of the motion observed near 5 μs with detector analysis (ρ5, Figure 2) is due to exchange between the structures observed in the histograms of PC0 and PC1.
Conclusion
The activation of GPCRs is induced by agonist binding causing reorientation of several TMs of the molecule. Here, we have analyzed timescales and amplitudes of the motion of GHSR in the apo and the ligand bound state using NMR and MD. A picture emerges that shows specific motions of the molecules in either state with characteristic distributions of correlation times, the amplitude and maxima of these distributions change for TM5, 6, and 7, whereas the distribution shifts to slower correlation times for ECL2 upon ligand binding. From the MD, we can identify the most populated structural substates and estimate the energy landscape of GHSR. In the inactive apo state, a rugged energy landscape with shallow wells separated by barriers that can be overcome by thermal energy describe the highly dynamic nature of the molecule under these conditions. The active ghrelin-bound state is also subject to significant molecular dynamics in agreement with experimental studies,22, 31 although is less dynamic than the apo state. Upon binding, concerted dynamics between GHSR and ghrelin are observed, and the toggle switch's (W2766.48) reorientation induces changes in the correlation between a string of hydrophobic residues. This multi-pronged approach, using detector analysis, PCA, and spectroscopic results provides a powerful tool to quantify GPCR motions and contributes to the understanding of the activation mechanisms.
Acknowledgments
This study was funded by the Deutsche Forschungsgemeinschaft (DFG) through CRC 1423, project number 421152132, subproject A02 (DH, PWH) and DFG grant 450148812 (AAS). Ghrelin was provided from the service project Z03 of the CRC 1423. Open Access funding enabled and organized by Projekt DEAL.
Conflict of interest
The authors declare no conflict of interest.
Open Research
Data Availability Statement
The data that support the findings of this study are openly available in Zenodo at https://doi.org/10.5281/zenodo.7550635.


