Single-Particle Reconstruction of Biological Molecules—Story in a Sample (Nobel Lecture)†
Copyright© The Nobel Foundation 2017. We thank the Nobel Foundation, Stockholm, for permission to print this lecture.
Graphical Abstract
Pictures tell a thousand words: The development of single-particle cryo-electron microscopy set the stage for high-resolution structure determination of biological molecules. In his Nobel lecture, J. Frank describes the ground-breaking discoveries that have enabled the development of cryo-EM. The method has taken biochemistry into a new era.
The Background
I developed an interest in electron optics when I worked with Ernst Kinder on my master thesis project in Physics at the University of Munich. The subject of my thesis was backscattering of electrons on the surface of liquid gold, an ambitious undertaking that forced me to construct a vacuum chamber, a crucible to heat up the gold, a detector, and an electron gun. In 1943, working with the electron microscope, Kinder had studied butterfly wings, which as he realized gained their brilliant colors from interference of light on gratings formed by tiny scales, arranged in regular order.
I signed on to a graduate project with Walter Hoppe at the Max-Planck Institute in Munich (Figure 1), an X-ray crystallographer whose interest had turned to electron microscopy (EM) as a means to study biomolecules. He viewed the electron microscope as a diffractometer that, unlike the one employed in X-ray crystallography, could record not just amplitudes of diffracted electrons, but their phases, as well. This was a fancy way of saying electron microscopes were able to form images.
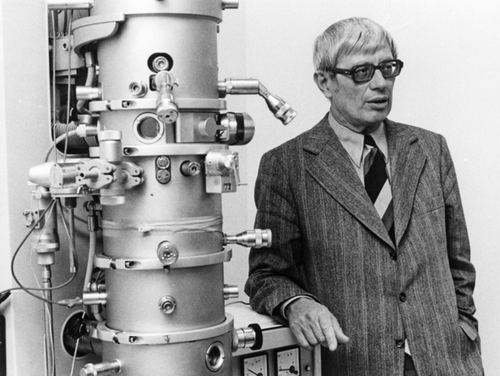
Walter Hoppe (1917–1986) with the Siemens Elmiskope 102. Photograph from archives of the Max-Planck Society, Berlin.
It is necessary at this point to look back at the state of the art of molecular EM in the late 60s and early 70s. For the beginning years, from the 1930s to the 1950s, the contributions of EM to biology had been confined mainly to the investigation of tissue at relatively low magnification. Serious forays into the quantitative visualization of molecular structure did not commence until the 1960s and were concentrated in three groups: Aaron Klug's at the Laboratory of Molecular Biology of the MRC in Cambridge, my mentor Walter Hoppe's at the Max-Planck Institute in Munich and Edward Kellenberger's at the Biozentrum in Basel.
Unless symmetries are present, three-dimensional reconstruction of an object requires the combination of its projections from a wide angular range. First pioneering achievements in molecular structure research with the electron microscope were the three-dimensional (3D) reconstruction of the bacteriophage tail with helical symmetry in 1968 by DeRosier and Klug1 and the first reconstruction of an icosahedral virus in 1970 by Tony Crowther.2, 3
At that time biological molecules could not be imaged in a close to native state. Negative staining—which amounts to embedding the molecule in a puddle of heavy metal salt as it is air-dried from solution—was the only means available to produce contrast. On the other hand, biological molecules were known to be quite fragile, and maintenance of their integrity would require a fully hydrated environment.
Graduate Studies and Harkness Fellowship
As I started my work as graduate student under Walter Hoppe, in 1967, I was exposed to discussions in a Workshop in Hirschegg in the Tyrol Alps, co-organized by Walter Hoppe and Max Perutz in 1968, later to be continued in meetings in Hirschegg in 1970 and Alpbach in 1976. These were the first meetings that brought together protein crystallographers and people working in EM.4
In my thesis project I analyzed electron micrographs with the optical diffractometer and explained patterns observed in case of drift in terms of Thon rings5 modulated by a cosine function, visible as so-called Young's fringes.6 I also examined the statistical properties of digitized micrographs. For digitization I used a densitometer built in house, which rendered the images on punched tape to be fed into the computer. In my first applications of digital image processing in EM, I explored the use of correlation functions for alignment of images.7 Another topic of my dissertation was the distortion of information by the contrast transfer function (CTF), caused by the lens aberrations of the electron microscope8 and its recovery by CTF correction.9
After finishing my Ph.D., in 1970, I went to the United States for two years under a Harkness Fellowship. The visit to three labs I chose was an eye-opener in several regards. The Jet Propulsion Lab (JPL) in Pasadena, at the time, was arguably the most advanced place in image processing hardware and software. In a project aimed to correct the contrast transfer function from a defocus series, I used their scanner to digitize micrographs of negatively stained DNA that were given to me by Walter Stoeckenius at UCSF, and I adapted my programs to interface with JPL's VICAR system. VICAR, used to process images from the Jupiter fly-by mission, was a modular image processing system that would later serve as a model for the development of SPIDER. The second lab I visited was the Donner Lab in Berkeley, where Robert M. Glaeser studied the effects of radiation damage on biological molecules under the electron beam.10 He also started developing techniques to render molecules frozen-hydrated in the EM.11 The third lab was Benjamin Siegel's at Clark Hall, Cornell University, where an experimental microscope in the mid-voltage (600 kV) range was being built. It was here that I first met Ken Downing, who worked on optical methods of information retrieval such as single-side band holography, and William Goldfarb, who would later join me in Albany.
The numerous problems faced by people attempting to image biological molecules in the EM were discussed at a Workshop organized by Edward Kellenberger in Gais, in the Swiss Alps in 1973. The state of the art at the time was reflected in the title of a proceedings paper12 as “high resolution” was equated with any results at better than 30 Å. Paramount at the Workshop was the search for a method that would keep the molecule fully hydrated while exposed to the electron beam. In addition, following the pioneering studies by Glaeser10—just at the time I visited his lab as a Harkness Fellow—radiation damage was recognized as a major obstacle in the strife toward high resolution. Averaging over a large number of repeats of a structure exposed to very low dose was seen as a general solution to this problem. Thus this meeting set the stage for a ground-breaking study by Richard Henderson and Nigel Unwin:13 the reconstruction of bacteriodhopsin from the purple membrane of Halobacter embedded in glucose under near-native conditions. The confluence of novel approaches to three areas, namely sample preparation, data collection at extremely low electron dose (<1 e−/A2), and merging a tilt series of these noisy images into a 3D image, made this work a towering achievement. The time after this was marked by general excitement in the community, and many attempts to use the same or similar methods in the study of other proteins amenable to 2D crystallization. However, the intrinsically low contrast between proteins and glucose and residual disorder in the crystals formed made these attempts difficult, and embedment in ice remained the agreed general goal.
In the 70s, and well into the 80s, most researchers in the field that was to be called Structural Biology were united in the belief that any structure determination required highly ordered samples, such as 2D crystals, helical arrangements, or viruses with high symmetry. Attempts to extract structural information from free-standing, single, asymmetric molecules were not taken seriously. One such alternative approach, pursued by Walter Hoppe, was to tilt the EM grid to which isolated molecules were attached into multiple angles while collecting the projections, from which the molecules could then be reconstructed.14
While the angles are exactly known in Hoppe's “tomographic” approach, the accumulation of radiation damage over multiple exposures, to more than 1000 electron per Angstrom square, rendered the end result essentially meaningless.15 The other approach was the one I formulated in a concept paper in 1975,16 to be elaborated in the following.
Postdoctoral Work at the Cavendish Lab: The Concept of Single-Particle Averaging and Reconstruction
The concept of the single-particle approach began to take shape while I was working at the Old Cavendish lab in Cambridge, Free School Lane, starting in 1973—at the very place where Max Perutz had started the Laboratory of Molecular Biology in a courtyard barrack. I had accepted a postdoc position in the group of Vernon Ellis Cosslett.
The approach takes advantage of the fact that biological molecules purified from cell extracts and suspended in solution typically exist in thousands or even millions of “copies” (that is, separate realizations) with virtually identical structure. Hence, if a grid to which such a sample has been applied is put into the EM, a large number of projection images of the same molecule lying in random orientations are encountered (Figure 2). The important point is that instead of collecting multiple images from one molecule by tilting it in the EM, one merely has to take a snapshot of multiple copies of that molecule with a very small radiation dose. The advantage in the latter case is that the 3D image obtained relates to a molecule that has “seen” only one single low exposure, and has remained practically undamaged. The later-coined terms “single-particle averaging” and “single-particle reconstruction” make reference to the fact that the molecules in the sample are free-standing, not attached to one another as in a crystal.
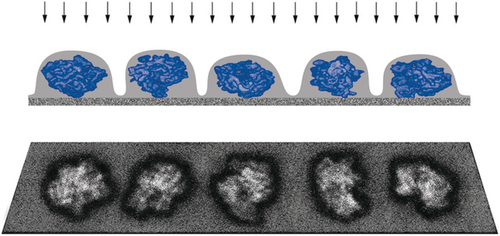
Schematic of single-particle data collection for air-dried, negatively stained molecules. The molecules are randomly oriented and each is embedded in a layer of heavy metal salt, which provides high contrast in the electron beam. Air-drying results in partial collapse of the molecule in z-direction.
At this point it is important to emphasize that no symmetries are assumed. Rather, the idea was that entirely asymmetric molecules could be reconstructed in this way. Symmetries obviously simplify the problem as in those cases the image contains multiple projections of the repeating unit in different, known orientations, allowing data from different molecules to be readily merged.
Simple as the concept sounds, the realization of single-particle reconstruction required several problems to be solved, all in the area of image processing. These can be stated in the form of five questions: (1) Is it at all feasible to align noisy molecule images with one another with sufficient accuracy? (2) How do we estimate the resolution of an average (or reconstruction) obtained by combining all images? (3) How do we sort molecule images by appearance related to view angle or conformation? (4) How do we find the viewing angles of projections a posteriori? (5) How do we reconstruct the molecule from projections at randomly spaced view angles?
It was in the nature of these problems and their novelty that progress was slow and piecewise, one step at a time. During the work on my Ph.D. thesis (1968–1970) I had already explored the use of the cross-correlation function for aligning electron micrographs. I discovered that two successive images of the same area of carbon could be aligned with precision better than 3 Angstroms, the resolution of the electron microscope (Figure 3).17
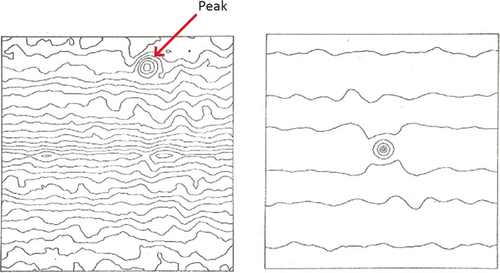
Left: Cross-correlation function of two micrographs of carbon foil, taken successively in the same area. Right: Autocorrelation function of one of the micrographs. In the autocorrelation function, the peak reflects superimposition of both signal and noise parts, hence its sharpness. In the cross-correlation function, the noise term is eliminated and the peak reflects only the signal part. (Reproduced from Ref. 17.)
Actually, the process of 2D alignment is a bit more complicated since molecules picked from the micrograph differ both in shift and in-plane orientation. The solution I found to determine both relative rotation angle and shift simultaneously makes use of the fact that the autocorrelation function of a molecule image is shift-invariant—it does not depend on its position within the image frame.18 Thus the determination of rotation can be entirely decoupled from that of shift (Figure 4).
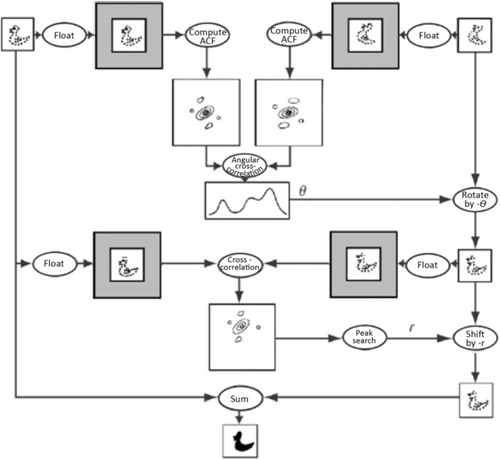
Schematic of image alignment making use of the translation-invariance of the autocorrelation function. (Reproduced with permission from Ref. 18.)
Working with Owen Saxton, I was able to show that alignment via cross-correlation would be accurate enough for the purpose of aligning noisy images of single molecules if the dose exceeded a certain level, which depended on the molecule's size and contrast against the background.19a Using the ribosome as an example, it became clear from the formula we obtained that the single-particle approach to structure research was indeed feasible for molecules of sufficient size:
Particle Size >3/[Contrast2 × Resolution (as length) × Critical Electron Dose]
A detailed examination of this dependency was later to be undertaken by Richard Henderson.19b
Move to the Wadsworth Center: From Concept to Practice
My appointment in 1975 as Senior Research Scientist at the Division of Laboratories and Research of the New York State Department of Health (DLR, later named Wadsworth Center) in Albany, New York offered me the opportunity to explore this idea with practical applications. (I had been asked to start an image processing group at DLR by Donald Parsons, a Roswell Park, Buffalo research scientist who was in the process of moving the Albany and setting up a high-voltage EM facility there).
With the help of micrographs provided by David Eisenberg, Tim Baker, Peter Zingsheim and Miloslav Boublik I was able to demonstrate the feasibility of obtaining two-dimensional averages showing enhanced features of molecules with images of glutamine synthetase (Figure 5),18, 20 acetylcholine receptor (Figure 6),21 and 40S ribosomal subunits from HeLa cells (Figure 7).22
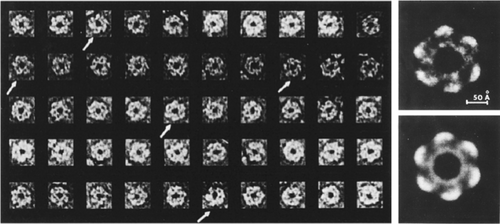
Single-particle averages obtained from images of negatively stained glutamine synthetase. Left: gallery of particles selected from the micrograph and aligned. Right: averages with and without six-fold symmetrization. (Reproduced from Ref. 20.)
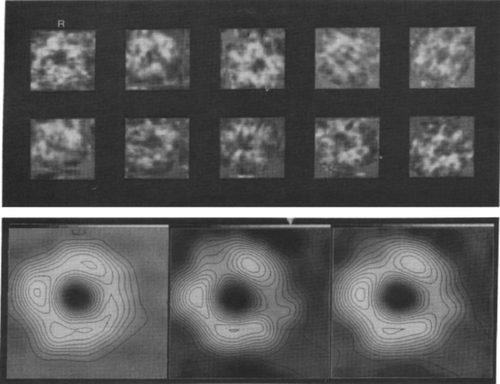
Single-particle averages obtained from images of negatively stained acetylcholine receptor of Torpedo marmorata. Top: examples for images selected from micrographs. Bottom: two half-averages and one full average (right). The average shows distinct departure from 5-fold symmetry deduced from low-resolution 2D crystals averages by other groups. (Reproduced with permission from Ref. 21.)
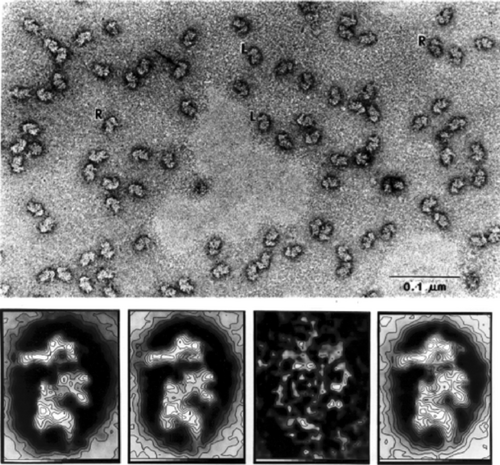
Single-particle averages obtained from images of 40S ribosomal subunits of HeLa cells. Top: micrograph showing 40S subunits in two views, left-facing (L) and right-facing (R). Bottom, from left to right: two half-averages, variance map, and full average of 81 L-view particles. (Reproduced with permission from Ref. 22.)
Among these, the 40S subunit averages were arguably the most striking in showing the potential of the single-particle averaging technique, results that proved instrumental for gaining funding by the National Institutes of Health. Nonetheless, presentations of the results for glutamine synthetase, acetylcholine receptor and ribosome by myself and two of my collaborators, Martin Kessel and Peter Zingsheim, at the meeting organized by Wolfgang Baumeister in Burg Gemen (1979) were greeted with a great deal of skepticism.
One issue to be addressed, as mentioned before, was the fact that due to the absence of crystal order, the average of aligned molecule images shows no diffraction spots in its Fourier transform, and therefore lacks an inherent measure of resolution. Without such a measure, progress in quality could not be tracked and compared among different groups. From the earlier study, during my dissertation, on the effects of drift on an electron micrograph,6 I realized that signal bandwidth is reflected by the extent of reproducible information in Fourier space.23 This extent of reproducible information is apparent from the extent of Young's fringes that show up in the optical diffraction pattern when two successive micrographs of the same specimen field are superimposed with a slight shift (Figure 8).
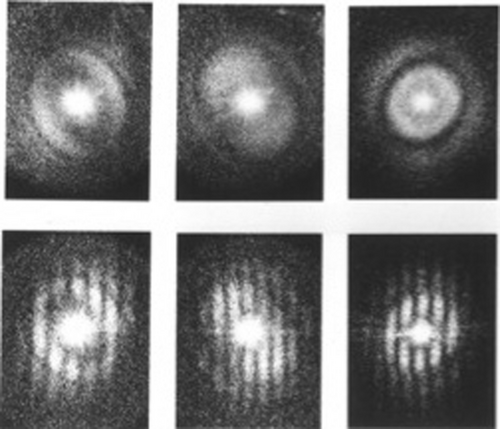
Reproducibility of the signal content in two successive electron micrographs of carbon film, demonstrated for three different defocus settings. Upper row: optical diffraction pattern of one of the micrographs, showing Thon patterns. Lower row: Young's fringes obtained by first aligning the micrograph pairs and then translating them relative to each other by a slight amount. (Reproduced from Ref. 17.)
How could this idea be translated into a quantitative measure? The extent of reproducibility in Fourier space can be quantified computationally by dividing the data going into an average randomly in half, then comparing the Fourier transforms of half-averages over rings in Fourier space. Resolution is then defined as the Fourier ring radius where a measure of comparison, such as phase residual, or R-factor,22 or cross-correlation (“Fourier ring correlation”),24, 25 passes a critical threshold (Figure 9). The same measures, computed over shells, would later prove important in estimating resolution of 3D reconstructions, as well.26
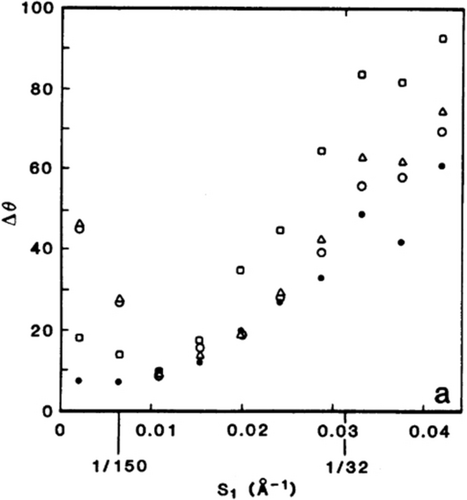
Resolution of single-particle averages defined by reproducibility of half-averages in Fourier space. Shown is the differential phase residual as a function of Fourier ring radius for the half-averages of 40S ribosomal subunits of HeLa cells. Resolution is then defined by the ring radius where the phase residual first exceeds 45°. (Reproduced with permission from Ref. 22.)
These first studies of image averaging immediately brought up the problem of heterogeneity—only those molecule images could be reasonably combined in an average if they originated from molecules of identical structure and presented the same view. At that time, one of Ernst van Bruggen's students, Marin van Heel, visited my lab bringing with him images of Limulus polyphemus hemocyanin—an oligomer with distinct architecture showing multiple preferred views when negatively stained and imaged in the electron microscope (Figure 10 a). These images therefore presented a perfect example of heterogeneity. Before attempting to average those images, they had to be sorted, or classified into their subsets. The solution to this problem27 came from the insight that images, once aligned with one another, may be regarded as vectors in a space of N dimensions, where N is the number of pixels. Groups of images that are similar will then show up as clusters of vectors in that space. Equivalent problems of finding clusters in high-dimensional space had been encountered in many fields of science, and gave rise to multivariate statistical analysis, a procedure which determines a compact low-dimensional subspace tailored to the problem. With the help of Jean-Pierre Bretaudiere, a Wadsworth Center scientist working in Laboratory Medicine, we were able to use a program meant to sort blood samples to sort images instead (see Ref. 28, where this episode is recounted). Application to hemocyanin proved an immediate success (Figure 10 b,c).
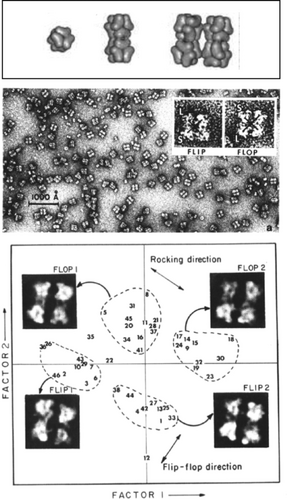
Sorting of hemocyanin images by Correspondence Analysis, a branch of multivariate statistical analysis. Top: Makeup of the dodecameric molecule of Limulus polyphemus hemocyanin. The slightly rhombic, twisted arrangement of the subunits creates a nonplanar architecture, reflected by the rocking of the molecule on the grid. Middle: Micrograph of negatively stained molecules showing them in different three-dimensional positions, related by flipping and rocking. Bottom: Factorial map, obtained by multivariate data analysis of the aligned molecule images, separates the images into four clusters. (Reproduced with permission from Ref. 27.)
Early on, as I set out on the single-particle approach to recovering structure, it became clear to me that in order to make systematic progress in the development of algorithms and computer programs with ever-changing and expanding goals required a workbench with a large set of tools. To this end I developed a modular image processing system called SPIDER (for System for Processing of Image Data in Electron microscopy and Related fields),20, 29 which made it possible to design complex programs from pre-coded building blocks using a simple script language. For example, the command WI would invoke a routine for extracting a rectangular portion of an image, FT would invoke Fourier transformation, and AC would compute the autocorrelation of an image. Hundreds of commands were implemented over the course of the next few years.
All programs were coded in FORTRAN, the most advanced language at the time. In most of the initial programming I was assisted by Helen Dowse, a SUNY Albany student of Computer Science, and Brian Shimkin, an undergraduate. As the functionality of SPIDER expanded, its script language became literally the lingua franca in my lab and, as the suite was disseminated to other labs, within a growing community of users. As noted earlier, I trace the idea underlying the SPIDER system and its modular design back to my stay at the Jet Propulsion Lab in 1970 under the Harkness Fellowship, where I became familiar with JPL's own VICAR image processing system.
Determination of Angles and Three-Dimensional Reconstruction
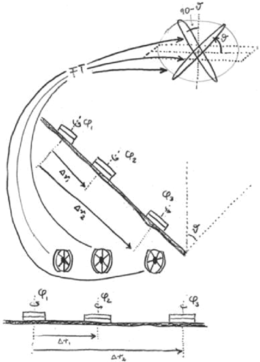
For computing the 3D structure of an object from its projections, one requires a fairly even coverage of the whole view range, and the angles of each projection must be known. Thus, in the single-particle approach, determination of the angles of randomly oriented molecules recorded in a micrograph was the most important yet most difficult problem to be solved. The solution came from the insight that two micrographs, one of a field of untilted particles, one of the same field tilted by a large angle, contained all the information required to assign Eulerian angles to each tilted particle.20, 30, 31 In this geometry (Figure 11 a), the angles of the tilted projections lie on a cone with random azimuths (Figure 11 b), a feature which would later give rise to the term “random-conical tilt reconstruction.”

Random-conical tilt data collection geometry. Top: Concept. Untilted grid is shown with molecules attached with the same face but different azimuths. Tilting of the grid by a large angle results in a unique direction of projection for each molecule. In Fourier space these correspond to intersecting central sections. (Frank, 1979; hand-drawn sketch on an overhead transparency, unpublished). Bottom: Illustration of data collection, and equivalent conical geometry. (Reproduced with permission from Ref. 32.)
In 1982 I was joined by physicist Michael Radermacher, also a student of Walter Hoppe, who had worked in his dissertation project on algorithms for 3D reconstruction from projections arranged in a regular conical geometry. Thus he had the perfect background required to develop computer programs that implemented the concept of the random-conical tilt reconstruction. One important step was still missing, though: the generalization of the 3D reconstruction algorithm, which assumed regularly spaced conical tilting, to the general case of random angles. Once this had been accomplished, as reported in a short communication in 1986,30 we obtained the first single-particle reconstruction using the random-conical tilt method: the 50S subunit of the E. coli ribosome (Figure 12).33 It is now on permanent exhibit in the Nobel Museum in Stockholm in the form of a transparent contour stack mounted in a wooden frame.
This reconstruction was limited in quality by two factors: one was the missing cone of information in the 3D Fourier transform, the source of unidirectional artifacts in the 3D density map, and the other were the artifacts due to the preparation of the sample by air-drying and negative staining. Both limitations were readily overcome within a short period of time: the missing cone problem was solved by merging datasets obtained with three or more different zero-degree views,34 and the preparation of the sample with negative staining was replaced by cryo-embedding in vitreous ice, following the spectacular success of Jacques Dubochet's vitrification method by plunge-freezing into liquid ethane35 in the application to viruses (Figure 13).36

Schematic of single-particle data collection for molecules randomly oriented and embedded in vitreous ice. The molecules are fully hydrated in an aqueous medium and, in contrast to the preparation with negative staining and air-drying shown in Figure 2, they exhibit no shrinkage in the direction normal to the grid plane.
Yet another important problem to be addressed, which affected the quality of all reconstructions from EM data, was the modulation of the image transform by the CTF. I had first worked on this problem during my dissertation, then through contributions to specific issues.37-39 This problem and its resolution-limiting effects on the reconstructed density maps were eventually overcome through the merging of data obtained with different defocus settings using a Wiener filtering algorithm (Figure 14).40, 41
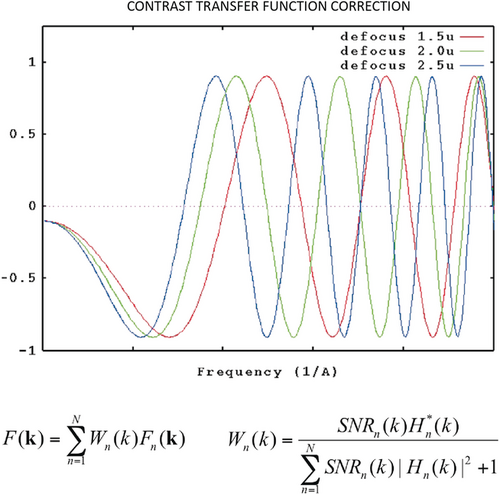
Contrast transfer function correction using Wiener filtering. The Fourier transform of the corrected image is obtained by a weighted sum of Fourier transforms of the defocus series. The weights Wn are given by the Wiener filter, which is proportional to the CTF Hn weighted by the signal-to-noise ratio SNRn. (Damping due to partial coherence is not shown here for simplicity.) (Reproduced with permission from Ref. 41.)
The first molecules we visualized by cryo-EM and reconstructed in three dimensions with the single-particle methods described above were the E. coli ribosome,34, 42, 43 hemocyanin,44 and calcium release channel (Figure 15).45, 46

A cryo-EM reconstruction of the Haloarcula marismortui ribosome (Figure 16) proved to be helpful in the phasing of the first X-ray structure of the large ribosomal subunit.47-49
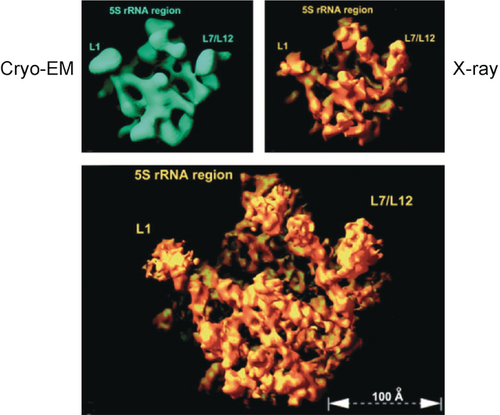
Cryo-EM reconstruction of the large ribosomal subunit from Haloarcula marismortui, used for solving a phasing ambiguity in solving the X-ray structure. (Reproduced with permission from Ref. 47.)
The quality of final reconstructions benefits from iterative angular refinement that starts out with the first rough reconstruction. In any project dealing with a molecule whose structure is unknown, it is practical to make a distinction between two phases, a bootstrap phase and a refinement phase. In the bootstrap phase, a first rough reconstruction is obtained—either by the random-conical tilt method, or by an alternative method, developed by Marin van Heel and others, in which common lines in Fourier space are employed.50-53 In the refinement phase,34, 54 an existing reconstruction (i.e., the density map obtained by a bootstrap reconstruction) is used to generate a library of even-spaced projections with which each of the experimental projections is compared to assign refined angles to it for the next round of reconstruction (Figure 17).

Iterative angular refinement scheme by projection matching, a scheme that underlies practically all cryo-EM reconstructions. (Reproduced with permission from Ref. 55.)
The mid-90s marked the time when a methodology of 3D reconstruction in EM could first be discerned in outline, as best documented in various contributions to the Proceedings of the 15th Pfefferkorn Conference (1997). At about that time I compiled a book for the first time summarizing computational methods of single-particle 3D EM.56
From the time where the first refined, CTF-corrected reconstructions were obtained, in the mid-90s, more than 15 years had to go by before the “resolution revolution” brought us to the resolution, 3–4 Å, where atomic modeling becomes possible. The interpretation of the many low-resolution cryo-EM reconstructions obtained during that time was often dismissed as “blobology,” a characterization that was unjust and unfair in most instances. In the following I would like to make this point by showing a few examples just from the area I am most familiar with—the structural basis of protein biosynthesis. These examples demonstrate that well before it reached the present state of perfection, cryo-EM gave us important insights into pivotal processes of translation by the ribosome. This happened on the level of resolution that allowed the constellations and movements of entire domains to be described.
In the late 90s, one of my postdocs, Rajendra Agrawal, prepared a sample containing elongation factor G (EF-G) bound to the ribosome as it catalyzes translocation of mRNA and tRNAs.57, 58 He used a GTP analog to arrest the factor at the point where GTP hydrolysis is normally triggered. Comparison of the cryo-EM reconstruction with that of the unbound ribosome showed a dramatic change: the small subunit had rotated by 7° with respect to the large subunit (Figure 20).59, 60 This finding of the “ratchet-like” motion provided first clues on the mechanism of mRNA-tRNA translocation (Figure 18).
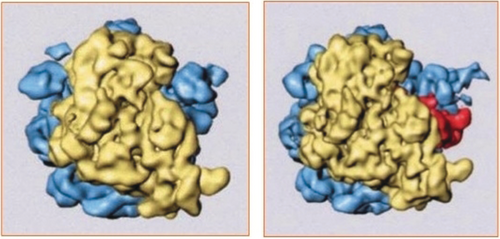
Ratchet-like motion of the E. coli ribosome during mRNA-tRNA translocation. Upon binding of EF-G, the small subunit (yellow) is seen to rotate relative to the large subunit (blue). (Reproduced with permission from Ref. 60.)
In 2002, Mikel Valle, another of my postdocs, found that during the decoding process, aminoacyl-tRNA (aa-tRNA) enters the ribosome in complex with the protein factor EF-Tu in a strongly distorted form, in the so-called A/T state (Figure 19).61, 62 In this case the antibiotic kirromycin was used to keep the factor from leaving the ribosome after GTP hydrolysis. This observation indicated that the tRNA acts as a molecular spring, apparently setting the threshold for discrimination between cognate and near-cognate codon-anticodon pairing.63 A later study in my lab confirmed that the same mechanism holds for all three classes of tRNA.64

The tRNA captured in the process of entering the ribosome. As tRNA arrives in ternary complex with elongation factor Tu (EF-Tu) and GTP, it binds the ribosome in a strongly distorted form, first seen by cryo-EM using kirromycin. Left: Juxtaposition of ternary complex entering the ribosome, with tRNA in the distorted A/T state, and ribosome after departure of EF-Tu and accommodation of cognate tRNA. Right: tRNA conformations in A/A and A/T states. (Reproduced with permission from Ref. 62.)
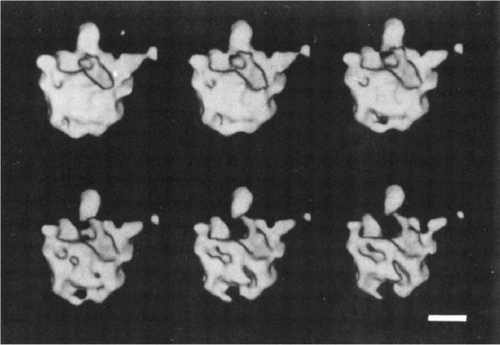
To give a third example, we teamed up in 2001 with Jennifer Doudna, then at Yale, to visualize the mRNA from hepatitis C virus in the process of hijacking the human ribosome. My postdoc Christian Spahn, working alongside with Jeff Kieft from the Doudna team, discovered the way the so-called IRES element of the virus’ mRNA engages the small subunit of the ribosome (Figure 20).65
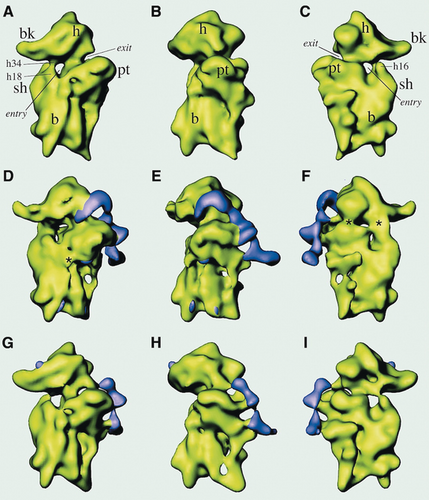
(A)–(C) 40S ribosomal subunit of HeLa cells (control) shown in different views; (D)–(F) 40S ribosomal subunit of HeLa cells with hepatitis C virus IRES bound; (G)–(I) same as (D)–(F) after removal of one domain. (Reproduced with permission from Ref. 65.)
Once density maps reached the sub-nanometer mark, it became possible to interpret them on the basis of existing structures and to build “quasi-” atomic models. Over the decade following the appearance of the ribosome X-ray structure, my group spearheaded three methods of such interpretations: real-space refinement in which entire domains were fitted as rigid bodies,66 normal mode analysis,67 and Molecular Dynamics Flexible Fitting, or MDFF.68 More about the use of MDFF below.
Move to Columbia University—Story in a Sample
In 2008 I joined Columbia University and the faculties of two departments: Biochemistry and Molecular Biophysics, and Biological Sciences. What attracted me particularly were opportunities for many collaborations on the two vibrant campuses at the Medical Center and Morningside.
Two examples for MDFF fitting among many obtained in my lab fall into this next stage of my career: (i) a 6.7 Å density map representing a snapshot of the decoding process69 and its interpretation by Elizabeth Villa (Figure 21, left),70 and (ii) the atomic model of the ribosome from T. brucei built from a 5.5 Å map by Yaser Hashem (Figure 21, right).71
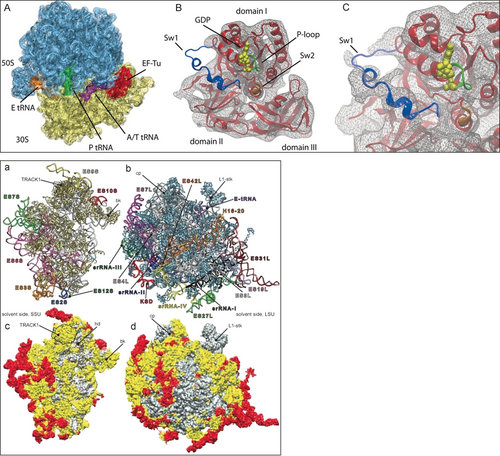
Top: the E. coli 70S ribosome bound with the aminoacyl-tRNA⋅EF-Tu⋅GDP ternary complex in the presence of the antibiotic kirromycin. A 6.7-Å cryo-EM density map was interpreted by atomic modeling with the aid of MDFF (Reproduced with permission from Ref. 70.) Bottom: structure of the T. brucei ribosome obtained by flexible fitting of a 5.5-Å cryo-EM density map. Left: 40S subunit, right: 60S subunit. Expansion segments are painted red. (Reproduced with permission from Ref. 71.)
These two examples illustrate the potential of modeling using flexible fitting, but at the same time give a sense of the large effort that was required to obtain an atomic model prior to the advent of the direct electron detectors, in 2013.
Starting at my new place I focused on a unique advantage of single-particle cryo-EM that is now utilized in many applications. Here, unlike in X-ray crystallography, molecules are unconstrained by crystal packing and thus are able to assume the full range of conformations present in solution. For a processive molecular machine such as the ribosome, unless it is stopped by a chemical intervention, many different states coexist.72, 73 The full potential of single-particle cryo-EM began to be realized with the introduction of maximum likelihood classification by Sjors Scheres, who worked as a student in the lab of Jose-Maria Carazo74 and later, as an independent principal investigator, at the LMB/MRC in Cambridge.75 These algorithms, first introduced into single-particle processing by Fred Sigworth,76a perform the seemingly impossible task of disentangling changes of view angle from changes in structure.76b A large well-characterized ribosome data set we supplied was correctly (i.e., conforming with supervised classification, as the ground truth was unknown) classified in the initial study by Scheres et al. (Figure 22).74 Working with this toolset, multiple structures are now routinely recovered from a single sample.77-81
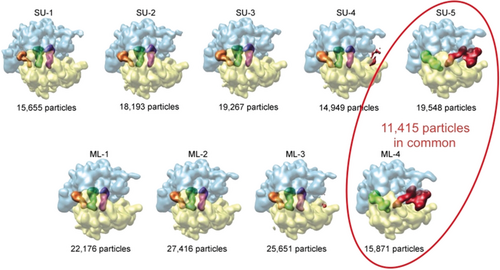
Maximum likelihood classification of ≈90 000 images of the E. coli ribosome with and without EF-G bound. Upper row: supervised classification into five classes, using an EF-G-bound ribosome as a reference. Lower row: maximum-likelihood classification into four classes. (Reproduced with permission from Ref. 74.)
Again resorting to the ribosome to make a general point, I show two examples for the “Story in a Sample” paradigm. In one study, several states of the elongation cycle are “fished out” from images of ribosomes purified from a cell extract of Plasmodium falciparum, the malaria parasite (Figure 23 left).82 These states proved to correspond to those earlier identified by trapping the eukaryotic ribosome from yeast or mammals with GTP analogs. In another study by my group, part of the elongation cycle is visualized in a sample containing a mutant of EF-G (Figure 23 right).83 Literally, cryo-EM is now able to tell us a story from a single sample of molecules in equilibrium, showing how the molecule changes its shape and binds or sheds ligands.

Two examples for determination of multiple structures from the same sample. Left: five 80S structures from Plasmodium falciparum ribosomes purified from a cell extract. Four of these (upper row) bear tRNAs and one (bottom) is empty. Inventory of all tRNA positions observed is on bottom right. (Reproduced with permission from Ref. 82.) Right: four E. coli 70S ribosome structures obtained from a sample where EF-G.GTP is present and bears a mutation H74A on the Switch 2 loop, slowing down GTP hydrolysis by a large factor.83 The four structures are arranged along with two models in the order of the translation elongation cycle.
This potential for resolving dynamic changes of molecules in equilibrium is augmented by the development of time-resolved techniques that are able to trap short-lived states evolving in a non-equilibrium experiment.84-89 Ultimately, even the recovery of a continuum of structures reflecting the states of a biological molecule at work, and the mapping of its free-energy landscape are no longer distant goals.90-92 This most recent development is made possible by our ability to collect large quantities of data, ensuring that even states encountered with low probability are represented in the ensemble.
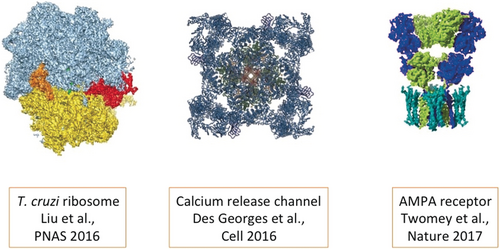
Even though I have illustrated the progress achieved by using my favorite molecule, the ribosome (best resolution thus far at 2.5 Å;93 Figure 24 a), the range of applications in biology is virtually unlimited except for some lower bound on molecule size, and, of course, the necessity of having the molecule suspended in solution. My own recent collaborations with the groups of Andrew Marks, Wayne Hendrickson, Alexander Sobolevsky, and Filippo Mancia demonstrate the gain in knowledge achievable now for membrane-bound channels and receptors (Figure 24 b,c).80, 94-98
Conclusions
Structural Biology, as a field, is in the process of being remade as the relative contributions of X-ray crystallography, NMR and cryo-EM are being reevaluated and repositioned. This is a process that will go on for a number of years, whose dynamics are difficult to predict. Right now there are three points to be made: (i) As there is no need for crystals, a large gap in structural knowledge can be filled now, particularly concerning membrane-bound channels and receptors, but also large molecular assemblies with high flexibility. (ii) The lower size limit on molecules is rapidly receding as phase plates improve contrast and cameras promise to become even more powerful. The recent determination of the structure of hemoglobin,99 with 64 kD molecular weight, is a feat once unthinkable. (iii) The ability to recover multiple structures, or even a continuum of structures, from a single sample sets off cryo-EM sharply from X-ray crystallography, and promises to give us very detailed information on molecular mechanisms of ligand binding, allosteric switching, and gating events.
To conclude this account of a 40-year journey, I must confess that even though I was always a firm believer in the technique I dreamt up many years ago, I never thought I would see it come to fruition in this spectacular way—let alone that it would earn me a share of the highest prize coveted by scientists all over the world. It has been a truly fantastic journey overall.
The knowledge that Human Medicine as a whole stands to benefit from the new technology is ultimately the best reward.
Acknowledgements
In my account of more than four decades of work I have focused on contributions of my own lab. It goes without saying that as the field developed many people have contributed to it worldwide, in areas reaching from sample preparation over instrument design and the development of computational tools, as recounted in many recent reviews (see e.g., Ref. 100). As a community the cryo-EM crowd is unusual in its spirit of cooperation and mutual respect, as reflected in the cordial atmosphere at topical meetings such as the Gordon Conference on 3DEM and the so-called Hybrid Meetings at Lake Tahoe.
I should at this point give tribute to all the people who have made this development possible over the years. First of all, without the pivotal contributions and leadership of my co-laureates Jacques Dubochet and Richard Henderson the field would not have come together and prospered in this way. My thanks go to my students, postdocs, and collaborators who shared my vision and put in so much hard work to make it all happen (Figure 25). Bob Grassucci has been with my group for more than 30 years in management and support of instruments of ever-increasing complexity.
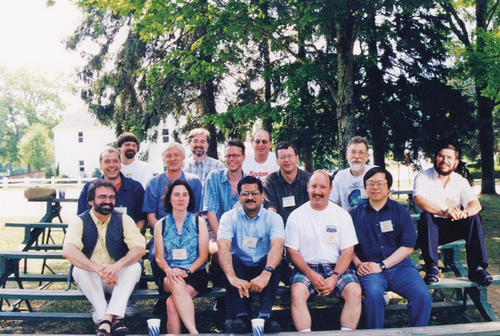
Albany reunion picture of then-current and former postdocs and colleagues, at the 1999 Gordon Conference for 3D Electron Microscopy. Upper row: Nicolas Boisset (†), Michael Radermacher, Joachim Frank, Carmen Mannella, Roland Beckmann, Martin Kessel, Pawel Penczek, Bruce McEwen, Jose-Maria Carazo. Lower row: Rasmus Schroeder, Montserrat Samso, Rajendra Agrawal, Bob Grassucci, Holland Cheng.
My very special thanks goes to my wife Carol Saginaw who has steadily supported me for close to 40 years and never lost faith in me, and my family and non-scientist friends who have cheered me on at every turn.
Much of the earlier developments of the technique took place at the Wadsworth Center in Albany, which provided a sheltered, supportive environment with generous funding by the State of New York, particularly in the starting phase when it counted most. In my expression of gratitude to the Wadsworth Center I would like to single out Carmen Mannella, who supported me throughout those years as a colleague, collaborator and friend. My affiliation with the Department of Biomedical Sciences of the University at Albany since 1985 allowed me to foster academic interactions with the SUNY faculty at large. Since 2008, when I joined the faculties of Columbia's Department of Biochemistry and Molecular Biophysics and Department of Biological Sciences, I enjoyed the multifaceted intellectual environment fostered and nurtured by one of the country's greatest universities.
My work has been generously supported by the National Institute of General Medical Sciences of NIH almost without interruption since 1981. Funding for two inspiring Sabbatical stays in England and Germany was provided, respectively, by the Fogarty Foundation and the Humboldt Foundation. Over the years, I received sizeable awards from the National Science Foundation for several instrument purchases. Support by the Howard Hughes Medical Institute for almost 20 years has allowed me to build up a state-of-the-art, professionally supported cryo-EM facility first at the Wadsworth Center and later at Columbia University. It is important to point out in these times that Government support is absolutely necessary for science to prosper and, with it, the chances of success in fighting disease.


