Structural Origin of Spin-Orbit Splitting of 1P Orbitals of Icosahedral Au13 Superatom Protected by Ligands
Abstract
The key structural factors underlying the spin-orbit (SO) splitting of the 1P orbitals in thiolate-protected Au13 superatoms were investigated using cryogenic anion photoelectron spectroscopy (PES) and two-component density functional theory (2c-DFT) calculations. PES revealed that the 1P orbitals of the Au13 and Au@Ag12 superatomic cores undergo splitting, whereas those of the Ag13 core do not. According to 2c-DFT calculations, the SO splitting of the 1P orbitals of the Au13 superatom stems from the symmetry-dictated coupling between the 6p orbitals of the central Au atom and the 1P orbitals formed by the surrounding icosahedral Au12 shell, both of which are split by SO effects.
Introduction
Ligand-protected metal nanoclusters (NCs) have attracted significant attention as new nanomaterials with unique, tunable properties.[1-8] Advances in atomically precise synthesis, single-crystal X-ray diffraction analysis, and theoretical calculations have revealed how key structural parameters, such as the size, atomic arrangement, and surface modification, affect NC properties. It was found that electronic structures, which can be tuned by these parameters, govern the photophysical and catalytic properties of NCs.[9, 10]
Relativistic effects play a crucial role in NCs composed of heavy elements such as Au.[11] In particular, spin-orbit coupling (SOC) significantly affects their optical, photophysical, and magnetic properties.[12-18] This phenomenon is exemplified by the benchmark NC [Au25(SR)18]− (RS = thiolate), which has an icosahedral Au13 core passivated by Au2(SR)3 units (Figure 1a)[19, 20] and adopts a closed electron configuration (1S)2(1P)[6] with delocalized superatomic 1P orbitals as its highest occupied molecular orbital (HOMO) (Figure 1b).[21] Previous two-component density functional theory (2c-DFT) calculations[22] showed that its 1P orbitals split into low-lying 1P1/2 and high-lying 1P3/2 by SOC (Figure 1b), yielding a gap of 0.20 eV.[13, 17] Doublet features in the onset region of the UV–vis absorption spectrum of [Au25(SR)18]− [23] are assigned to 1P1/2→1D and 1P3/2→1D transitions.[13, 17] Optical spectroscopy and 2c-DFT calculations revealed that SOC is less influential than the Jahn–Teller effect on the electronic structures of the neutral and cationic Au25(SR)18.[17] The importance of SOC has also been theoretically demonstrated in E@Au12 (E = Si, Ge, Sn, and Pb) superatoms[14] and in the superatomic molecule Au38(SR)24.[15] In alloy system, doping a single heavy atom (Au or Pt) at the center of the Ag13 superatomic core of [Ag25(SR)18]− or [Ag29(S2R)12]3− enhances their photoluminescence,[24-27] presumably by promoting intersystem crossing from S1 to T1. Although these studies underscore the importance of SOC in rationalizing the electronic structure of Au/Ag NCs, the fundamental relationship between the SO splitting of the 1P orbitals and structural factors, such as elemental composition, ligand type, and atomic arrangement, remains unclear.
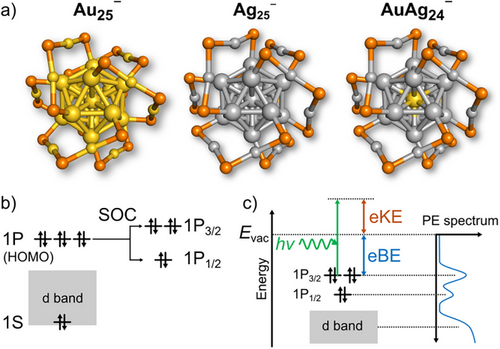
Here, we clarify which structural factors govern the SO splitting of the 1P orbitals in ligand-protected Au13 superatoms. First, we employed cryogenic anion photoelectron spectroscopy (PES)[28-30] to quantify the SO splitting of the 1P orbitals of a series of vacuum-isolated superatoms [Au25(SC8)18]− (SC8 = SC8H17; denoted Au25−),[20, 21] [Ag25(DMBT)18]− (DMBT = 2,4-(CH3)2C6H3S; Ag25−),[31] and [AuAg24(DMBT)18]− (AuAg24−)[32] (Figure 1a). PES can directly reveal the degree of SOC from the peak splitting of the 1P orbitals (Figure 1c), whereas photoabsorption energies include SOC effects in both 1P and 1D orbitals. Second, we investigated how elemental compositions, atomic arrangement, and surface modification affect the SO splitting by performing 2c-DFT calculations.
Results and Discussion
Au25−, Ag25−, and AuAg24− were synthesized according to the reported methods (Figure S1).[20, 21, 31, 32] PES of these NCs was performed using a home-built apparatus consisting of an electrospray ionization (ESI) source, a linear ion trap, a time-of-flight mass spectrometer (TOF-MS), and a magnetic-bottle photoelectron spectrometer (MB-PES) (Figures 2a and S2).[33-37] To minimize thermal broadening of PE spectra, we installed a liquid nitrogen (LN2)-cooled ion trap immediately upstream of the TOF-MS analyzer (Figure S3). The ESI mass spectra of Au25−, Ag25−, and AuAg24− showed the adducts of solvent molecules when the ion trap was cooled with LN2 (Figure S4), indicating efficient cooling of the NCs. The PE spectra of the mass-selected NC anions were recorded by irradiating a pulsed laser at the wavelength of 213 nm. Figure 2b compares the PE spectra of Au25− with and without LN2 cooling, while Figure S5 compares those of all NCs used in this study. Cooling of the ions sharpened the peak and steepened the onset, so the LN2-cooled ion trap significantly improved spectral resolution and accuracy.
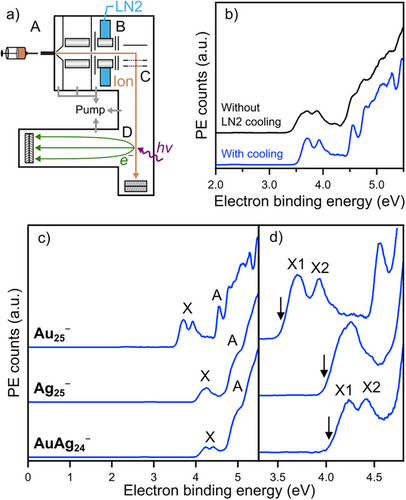
Figure 2c shows the PE spectra of LN2-cooled Au25−, Ag25−, and AuAg24−. All spectra exhibited a distinct band X by electron detachment from the 1P orbitals (HOMO), followed by a broad, intense band A assigned to the Au 5d or Ag 4d band.[34] From the onset of band X, the adiabatic electron affinities (AEAexp) of Au250, Ag250, and AuAg240 were determined to be 3.53 ± 0.01, 3.98 ± 0.01, and 4.03 ± 0.01 eV, respectively (Table 1). Notably, these AEAexp values match or exceed those of halogen atoms (e.g., 3.61 eV for Cl), supporting their classification as superhalogens.[38] A closer look at band X (Figure 2d) shows that band X of Au25− and AuAg24− splits into two peaks (X1 and X2), while that of Ag25− does not. However, quantitative analysis of band X in terms of the peak position and intensity ratio X1/X2 is not straightforward due to the weak featureless PE signals between band X and band A for Au25− and the contribution of band A for AuAg24−. To minimize arbitrariness in the analysis, limited regions of the spectra of Au25− (3.3–4.0 eV) and AuAg24− (3.8–4.5 eV) were fitted with a superposition of two Gaussian functions of equal width, while that of Ag25− (3.7–4.4 eV) was fitted with a single Gaussian function (Figure S6). The vertical detachment energies (VDEexp) of Au25− and AuAg24− were determined to be 3.70 and 4.22 eV, respectively, from the peak position of band X1, while that of Ag25− was 4.25 eV (Table 1). The splitting energies of bands X1 and X2 (SOEexp) in Au25− and AuAg24− were 0.24 and 0.22 eV, respectively (Table 1). The area ratios X1/X2 for Au25− and AuAg24− were 1.14 and 0.96, respectively. The full width at half maximum (FWHM) of band X of Ag25− (0.32 eV) was larger than those of bands X1 and X2 of Au25− (0.19 eV) and AuAg24− (0.21 eV). The FWHM values of the split bands X1 and X2 were significantly larger than the energy resolution of our PE spectrometer (0.06–0.07 eV, Figure S1c), suggesting that the PE bands are broadened by the associated Franck–Condon factor. These features of the fitted results will be discussed later on the basis of DFT calculations (Figure 3).
| Au25− | Ag25− | AuAg24− | |
|---|---|---|---|
| AEAexp (eV) | 3.53 | 3.98 | 4.03 |
| AEAcalc,1c (eV) | 3.54 | 3.72 | 3.79 |
| VDEexp (eV) | 3.70 | 4.25 | 4.22 |
| VDEcalc,1c (eV) | 3.67 | 3.86 | 3.93 |
| VDEcalc,2c (eV) | 3.59 | 3.86 | 3.92 |
| SOEexp (eV) | 0.24 | – | 0.22 |
| SOEcalc (eV) | 0.21 | – | 0.25 |
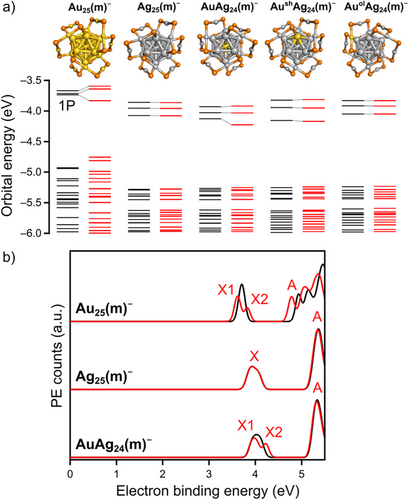
To interpret the PE spectra while considering SOC, we performed 2c-DFT calculations using the program TURBOMOLE on the model structures: [Au25(SCH3)18]−, [Ag25(SCH3)18]−, and [AuAg24(SCH3)18]− (denoted Au25(m)−, Ag25(m)−, and AuAg24(m)−, respectively). First, we optimized three clusters at the scalar relativistic one-component DFT (1c-DFT) level with the CAM-B3LYP functional, including dispersion corrections and the dhf-SVP basis set. The optimized structures retained the crystal motifs (Figure S7). Then, electronic structures were computed by a single-point 2c-DFT calculations using the dhf-SVP-2c basis set. The calculated AEA values of the corresponding neutrals at the 1c-DFT level (AEAcalc,1c) and VDE values at the 1c- and 2c-DFT levels (VDEcalc,1c and VDEcalc,2c) appear in Table 1. The experimental and calculated values for Au25(m)− are in close agreement, whereas the calculated values for silver-based Ag25(m)− and AuAg24(m)− underestimate the experimental values by ∼0.3 eV, probably due to the simplification of the electron-withdrawing DMBT to CH3S. The noticeable difference between VDEcalc,1c and AEAcalc,1c (∼0.15 eV) supports the Franck–Condon broadening of the experimental PE spectra.
The orbital energy diagrams of Au25(m)−, Ag25(m)−, and AuAg24(m)− at the 1c- and 2c-DFT levels appear as black and red bars in Figure 3a, respectively. The 1P orbitals of Au25(m)−, nearly triple degenerate at the 1c-DFT level, are split into two subsets (2:1 ratio) at the 2c-DFT level by SOC. In contrast, the 1P orbitals of Ag25(m)− and AuAg24(m)− are not degenerate even at the 1c-DFT level. This nondegeneracy may be due to deformed ligation of the Ag2(SCH3)3 units rather than core deformation, since the continuous shape measure (CSM) analysis (Table S1)[39] showed the higher symmetry of the cores of Ag25(m)− and AuAg24(m)− than that of Au25(m)−. At the 2c-DFT level, the 1P orbitals of Ag25(m)− remain unchanged, while those of AuAg24(m)− are split into two with a 2:1 ratio. We simulated the PE spectra by isotropic broadening of each orbital energy level[40] (Figure 3b), which qualitatively reproduce the splitting of band X for Au25− and AuAg24− and an unsplit broadened band X for Ag25− (Figure 2c). The theoretical SO splitting energies (SOEcalc) of Au25(m)− calculated at various theory levels (0.17–0.21 eV) (Figure S8) and AuAg24(m)− (0.25 eV) agree with the experimental values (SOEexp) of Au25– and AuAg24– (0.24 and 0.22 eV, Table 1). Notably, these SOEexp values of Au25– and AuAg24– are comparable to that of Cl (0.11 eV) yet smaller than that of I (0.94 eV).[41] However, the intensity ratios of X1/X2 for Au25− and AuAg24− estimated by the fitting shown in Figure S6 were 1.14 and 0.96, respectively, and significantly smaller than 2 predicted theoretically based on the density of states. The underestimation of the X1/X2 ratio for AuAg24− is attributed to the overestimation of the intensity of band X2 by ignoring the contribution of the tail of band A. On the other hand, the deviation of the X1/X2 ratio for Au25− can be understood as follows, based on the weak PE signals between bands X and A, where no PE signals are predicted by the DFT calculation (Figure 3b). These PE signals suggest an asymmetric Franck–Condon factor for the electron detachment[42] of band X2. Assuming a similar asymmetric Franck–Condon factor of band X1, the intensity of band X2 is overestimated, leading to an underestimation of the X1/X2 ratio for Au25−. Thus, although an unambiguous determination of the X1/X2 ratio is currently impossible, the above interpretation qualitatively supports the assignment of bands X1 and X2 for Au25− and AuAg24− (Figure 2d) to electron detachment from the SO-split 1P3/2 and 1P1/2 orbitals (Figure 1c).
The sharp difference in splitting between AuAg24− and Ag25− may be attributable to the doped Au atom at the center. To verify this hypothesis, we examined two putative regioisomers of [AuAg24(SCH3)18]−: AushAg24(m)− and AuolAg24(m)−, where the Au atom resides on the icosahedral shell or within the Ag2(SCH3)3 oligomer, respectively. AushAg24(m)− and AuolAg24(m)− were less stable than AuAg24(m)− by 0.70 and 0.73 eV, respectively, at the 2c-DFT level. Although the 1P orbitals of AushAg24(m)− and AuolAg24(m)− lack degeneracy at the 1c-DFT level due to the asymmetric Au placement, their orbital energies remained unchanged even after the including SOC (Figure 3a). Hence, we conclude that the “central” Au atom drives the SO splitting of the 1P orbitals of AuAg24−.
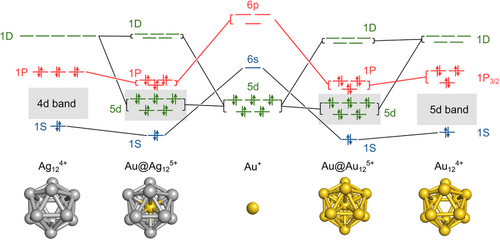
Why does the SO splitting of the 1P orbitals occur only for of AuAg24− and Au25− and not for Ag25−? Mulliken population analysis shows that the 6p orbital of the central Au atom or the 5p orbital of the central Ag atom contributes to the 1P orbitals of Au25(m)−, Ag25(m)−, and AuAg24(m)− (Figure S9). This suggests that the 1P orbitals of an icosahedral M“@M12 (M”, M = Au, Ag) core are constructed by symmetry-dictated coupling[43] between the 6p/5p orbitals of the central M' atom and the 1P orbitals formed by the M12 shell. Accordingly, the SO splitting of the 1P orbitals of Au25(m)− and AuAg24(m)− reflects the splitting of both the central 6p/5p orbitals and the surrounding 1P orbitals (Scheme 1). Scheme 1 is tested by 2c-DFT calculations on naked, model superatoms (M“@M12)5+. The structures of (M”@M12)5+ and M124+ shell were extracted from Au25(m)−, Ag25(m)−, and AuAg24(m)−, followed by single point calculations. The calculation was also performed on (Ag@Au12)5+, although the corresponding thiolate-protected superatom has not yet been synthesized. The energy diagrams for the 1P orbitals of the (M“@M12)5+ superatoms are shown in Figure S10. The large SO splitting of the 6p orbital of the Au+ (0.64 eV) is transferred to that of the 1P when it is surrounded not only by the Au124+ shell (SOE = 0.59 eV) but also by the Ag124+ shell (SOE = 0.06 eV). This result supports Scheme 1 and indicates that the SO splitting of the 6p orbital of the central Au atom is crucial for the SO splitting of the 1P orbitals of Au25(m)− and AuAg24(m)−. In contrast, the small SO splitting of the 5p orbital of Ag+ (SOE = 0.18 eV) cannot be enhanced by the Ag124+ shell (SOE = 0.06 eV), but by the Au124+ shell (SOE = 0.59 eV). This result not only explains the absence of SO splitting in Ag25−, but also predicts that NCs with the Ag@Au12 superatomic core will exhibit a large SO splitting. Meanwhile, the 1D orbitals of the (M”@M12)5+ core, corresponding to the lowest unoccupied molecular orbitals, are composed mainly from the 1D orbitals of the M124+ shell with a small contribution from the 4d/5d orbitals of the central M' atom (Scheme 1). The model calculations on the naked (M'@M12)5+ predict the large SO splitting of the 1D orbitals of AuAg24− and Au25− (Figure S11).
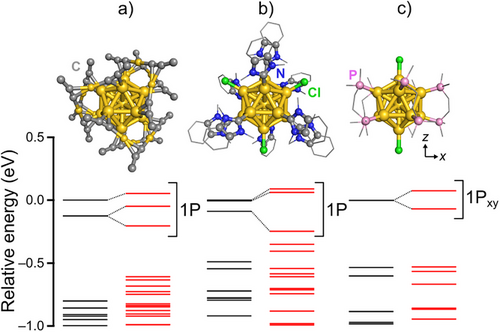
Finally, we investigated how chemical modification affects the SO splitting in the Au13 superatom. Representative Au13 superatoms protected by different ligands – [Au25(C≡CR)18]− (C≡CR = alkynyl),[44] [Au13(NHC)9Cl3]2+ (NHC = N-heterocyclic carbene),[45] and [Au13(P2R)5Cl2]3+ (P2R = diphosphine)[46] – were modeled as [Au25(C≡CMe)18]−, [Au13(NHCMe)9Cl3]2+ (NHCMe = benzimidazole with two CH3 wing tips), and [Au13(Me2PC2H4PMe2)5Cl2]3+, respectively, using simplified ligands. The optimized structures and their Kohn–Sham energy diagrams from the PBE functional are shown in Figure 4, confirming the intactness of Au13 cores. [Au25(C≡CMe)18]− and [Au13(NHCMe)9Cl3]2+ already display two-fold splitting in the 1P orbitals at the 1c-DFT level due to the asymmetric ligation. Nevertheless, in all cases, the three 1P orbitals split into one lower-energy and two higher-energy orbitals under SOC. This result indicates that SOC is an inherent property of Au13 superatoms, regardless of the protecting ligands.
Conclusion
In summary, cryogenic anion PES revealed that 1P orbitals of Au25− and AuAg24− undergo SO splitting, whereas those of Ag25− do not. Two-component (2c-) DFT calculations identified that the central Au atom as the principal structural factor driving the SO splitting of 1P orbitals of AuAg24−. 2c-DFT calculations on naked, model superatoms (M“@M12)5+ revealed that the splitting of both the p orbitals of the central M” atom and the 1P orbitals in the surrounding M12 shell are responsible for the large SO splitting of 1P superatoms of M'@M12. These insights will pave the way for the rational design of superatoms with spin-related properties, such as magnetic circular dichroism[47] and magneto-optical responses.[48]
Supporting Information
The authors have cited additional references within the Supporting Information.[49-52]
Acknowledgements
Regarding the design of a LN2-cooled ion trap, we acknowledge early-stage contributions of Ms. Rena Higuchi and helpful discussions with Prof. Akira Terasaki. This study was financially supported by JST, CREST (Grant No. JPMJCR20B2), JSPS KAKENHI (Grant No. 24K23072, 25K17995), Institute for Quantum Chemical Exploration (IQCE) Research Grants-in-Aid 2024, and the NFRF-T program (#NFRFT-2020–00573). Part of the computations were performed at the Research Center for Computational Science, Okazaki, Japan (Project: 24-IMS-C158).
Conflict of Interests
The authors declare no conflict of interest.
Open Research
Data Availability Statement
The data that support the findings of this study are available from the corresponding author upon reasonable request.


