Direct Analysis of Complex Reaction Mixtures: Formose Reaction
Abstract
Complex reaction mixtures, like those postulated on early Earth, present an analytical challenge because of the number of components, their similarity, and vastly different concentrations. Interpreting the reaction networks is typically based on simplified or partial data, limiting our insight. We present a new approach based on online monitoring of reaction mixtures formed by the formose reaction by ion-mobility-separation mass-spectrometry. Monitoring the reaction mixtures led to large data sets that we analyzed by non-negative matrix factorization, thereby identifying ion-signal groups capturing the time evolution of the network. The groups comprised ≈300 major ion signals corresponding to sugar-calcium complexes formed during the formose reaction. Multivariate analysis of the kinetic profiles of these complexes provided an overview of the interconnected kinetic processes in the solution, highlighting different pathways for sugar growth and the effects of different initiators on the initial kinetics. Reconstructing the network's topology further, we revealed so far unnoticed fast retro-aldol reaction of ketoses, which significantly affects the initial reaction dynamics. We also detected the onset of sugar-backbone branching for C6 sugars and cyclization reactions starting for C5 sugars. This top-down analytical approach opens a new way to analyze complex dynamic mixtures online with unprecedented coverage and time resolution.
Introduction
Chemical reaction networks are central to the origin of life, from the synthesis of the building blocks of life to the appearance of genetic systems and protocells.1-4 However, these networks are often intractable, as all components can interact, react, and transform, leading to blends of many molecules in vastly different concentrations where components with negligible concentrations could be the most reactive and thus key players in determining the overall composition of the reaction mixture. Because of a lack of analytical tools that could provide the full picture of all components and their kinetic behavior, reaction network maps must be reconstructed based on only partial observations. While useful, incomplete information can lead to misconceptions about the network topology or the inability to predict a network's response to different reaction conditions.5-8
NMR or IR spectroscopies are the methods of choice for online kinetic analysis.9-11 However, they do not have sufficient dynamic range and often lack the resolution to detect, analyze, and identify numerous minor, structurally similar components.12 Therefore, they are suitable only for relatively simple reaction mixtures with a limited number of monitored species.13 Mass spectrometry has superior detection limits and a large dynamic range.14 However, it cannot separate isomeric species with the same m/z ratio. Therefore, the analysis of complex mixtures requires coupling with gas or liquid chromatography, which can separate stable compounds. However, chromatography is not suitable for separation of reactive species.15 Monitoring of reactive mixtures by chromatographic methods, therefore, requires chemical quenching and conversion of reactive molecules into their stable derivatives.16, 17 To a certain degree, chromatographic separation can be replaced by ion mobility separation (IMS) during mass spectrometry analysis.18-20 Such an approach opens the way to online monitoring using mass spectrometry, avoiding the chromatographic step. Here, we introduce a data-driven approach to an online analysis of the complex mixtures generated by formose reactions.21, 22
The formose reaction is a highly recursive, autocatalytic reaction network leading to the condensation of formaldehyde into a large number of sugar molecules and their dehydrated variants (Figure 1).23-26 The reactions proceed at high pH and in the presence of divalent metals, typically calcium.27, 28 The first step of condensing two formaldehyde molecules is slow, but further steps are fast.29-32 Adding C2, C3, or higher sugar molecules can directly initiate the fast reaction phase. The aldol condensation reactions are reversible via retro-aldol reactions, leading back to C2 (and other) species, autocatalyzing the whole reaction network. Next to dominant aldol condensation reactions, side reaction paths such as the Cannizaro reaction lead to reduced and oxidized molecules.33, 34 Small changes in the reaction conditions affect the reaction network, leading to time-dependent changes in the composition of the reaction network.35, 36 Disentangling the complex kinetics of the formose reaction has proven impossible to date.

Sugar molecules growing in the formose reaction and the ions monitored by electrospray ionization—ion mobility separation—mass spectrometry (ESI-IMS-MS).
In previous work, we, and others, combined gas- or liquid chromatography with mass spectrometry (GC–MS or LC–MS) for the formose reaction analysis.35-38 In order to quantitatively analyze the carbohydrates, including their stereochemistry, the carbohydrates must have been derivatized, which precluded online monitoring of reaction kinetics.16, 17 Here, we show that a chemometrics approach using direct ESI-IMS-MS (electrospray ionization—ion mobility separation—mass spectrometry) data reveals the sugar growth processes in the formose reaction, highlighting the key components and their interconnection without applying prior knowledge about the network. We start with this general, data-driven analysis because it is independent of the investigated reaction network. Zooming in on the level of reactions within the network, we assigned the identified key reaction components as calcium and potassium complexes of the sugar molecules; we could analyze individual components’ kinetic profiles and qualitatively analyze the formation of isomeric sugar complexes. This analysis opens the way to reconstructing the topology of the formose reaction and ultimately constructing quantitative kinetic models.
Results and Discussion
We have monitored the formose reaction mixture (13 mM KOH/6.5 mM CaCl2, pH≈12, 70 mM 13CH2O, 20 mM initiator-dihydroxyacetone, glyceraldehyde, or glycolaldehyde, aqueous solution kept at 40 °C) by a direct infusion of the solution from a reaction vessel to a mass spectrometer via a silica capillary using N2 overpressure (Figure S1). This approach allowed us to detect calcium and potassium hydroxide and chloride clusters and signals containing background organic impurities (Figure S2). Adding an initiator resulted in the development of rich chemistry manifested by changes in the ion mobility resolved mass spectra (Figure 2a).39-41 The ion mobility separation adds another dimension to mass spectrometry, in which all ions of a given m/z ratio are separated according to their shape (characterized by their collision cross-section).19, 42, 43 The heat map in Figure 2 is a 2D representation of the data; each dot represents a signal of an ion with a given m/z ratio and inverse ion mobility (proportional to the collision cross-section), and the color intensity refers to the ion abundance. The heat map evolves with time. The time resolution of the data is given by the instrument and the data quality. Our raw data have a resolution of 0.5 s, but we evaluated them binned to 26 s to facilitate the matrix analysis (see the experimental details).

Visualization of a typical raw dataset collected while monitoring the formose reaction (13 mM KOH/6.5 mM CaCl2, pH≈12, 70 mM 13CH2O, 20 mM dihydroxyacetone). (a) Ion map showing the distribution of the ionic signals in the m/z-mobility plane in a reaction time window between 3.8 and 4 minutes after the injection of the initiator. The orange area highlights the relevant ionic signals. The color shade is proportional to the signal intensity. (b) Normalized integral spectrum collected inside the orange area in the reaction's first and last two minutes. (c) Normalized integral spectrum collected outside the orange area in the first and last two minutes of the reaction.
The big picture: Time evolution of the reaction mixture
The heat map analysis reveals that the ion signals can be roughly divided into two groups (color-coded in Figure 2a). The area highlighted in orange contains singly charged ions. In contrast, the blue-highlighted area contains multiply charged ions corresponding to larger clusters of the monomeric singly charged units and low mobility background signals. The cluster ions are likely formed during the electrospray ionization process (see also Figure S4).44 Both groups of ions show increasing complexity with time (Figures 2b and 2c). The singly charged ions show an evolution trend from lower-mass ions to higher-mass ions, as expected, as the formose reaction tends to make larger and larger sugars. The multiply charged clusters carry the same information about the evolution of the reaction mixture. However, the information is more complex because all ions can cluster/condense with each other, making the information more convoluted. Assuming that both areas carry the fingerprint of the reaction mixture, we further evaluated only the more specific area of the singly charged ions.
Next, we applied a data-driven approach to identify the major components characterizing the time evolution of the mixture (so-called latent components). To this end, we first filtered out the signals that remained constant during the experiment, as these signals do not embody the dynamic evolution of the chemical composition of the reaction mixture. Then, the remaining ionic traces were organized into a two-dimensional data matrix (m/z vs. reaction time) and decomposed by penalized Non-Negative Matrix Factorization (NNMF, see the details in the Supporting Information). NNMF separates the data into a given number of components that best characterize the evolution of the whole.
The minimum of three latent components can capture the structure of the data matrix investigated here (Figure 3), as revealed by the reconstruction error plot (Figure S5). The ESI-MS-monitored kinetic profiles of the three components (Figure 3a) show what would typically be expected inside a chemical reactor: The first component has a decreasing trend of compounds consumed over time; the second component consists of chemicals synthesized and consumed again during the reaction; the last component consists of species that accumulate towards the end of the reaction time. The kinetic profiles of these latent components are associated with the individual pseudo-spectra (Figure 3b). The components partly overlap in the dominant signals; however, they grasp the chemical evolution of the mixture, starting from simpler molecules with lighter masses and going to larger molecules with heavier masses. In fact, sharing the ion signals among the components is expected as the investigated reaction network is recursive, and the same components can be formed repeatedly even though the reaction mixture as a whole evolves to a changed composition.
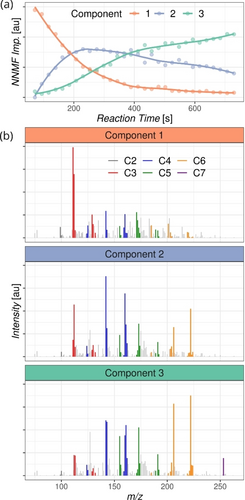
Non-negative matrix factorization results. (a) ESI-MS-monitored kinetic profiles of the three major latent components. (b) Individual pseudo-spectra. The colors highlight the annotation results regarding the number of carbon atoms in the detected ions. The assignment can be found in Table S2 in the Supporting Information.
Going into kinetic details
An insight into the reaction progression was obtained by inspecting the kinetic profiles of all annotated ion signals revealed in the three latent components above (Table S2). The annotated peaks are color-coded according to the number of carbon atoms using the color key introduced in Figure 1. The signals correspond to complexes of sugar molecules with calcium or potassium ions and their dehydrated or doubly dehydrated variants (Figure 1). The dehydration occurred dominantly during the electrospray ionization of the reaction mixture (Figure S6). In the following, we focused only on the analysis of the sugar complexes and truncated the analysis at the C6 sugars because further growth was slow.
The kinetic profiles of the individual calcium or potassium sugar complexes vary in their shapes, resembling the components’ profiles in Figure 3. Normalized profiles of selected sugar-calcium complexes are shown in Figure 4a. They are grouped according to their shape, where group A1 shows profiles of complexes peaking at the beginning of the reaction, group A2 are complexes formed during the reaction and later transformed further, and group A3 are complexes that are accumulating in the reaction mixture towards the end of the investigated reaction time. We analyzed more than 300 ion signals, which makes the one-by-one analysis of the kinetic profiles demanding (Figures S7–S14). Therefore, we moved to a more global approach based on assessing the pairwise similarity of the full set of kinetic profiles. In brief, we calculated a distance correlation matrix, which can be used to measure the similarity between the kinetic profiles of the individual ions.45 The structure of this matrix was then visualized in a 2D representation by applying non-metric multidimensional scaling (Figure 4b).
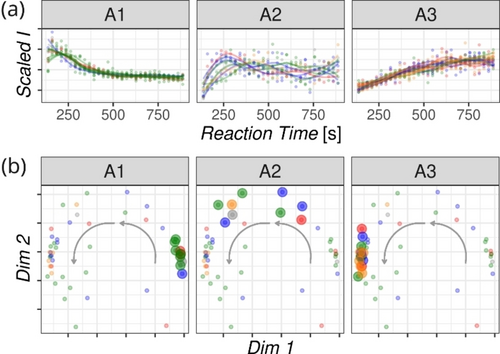
(a) Scaled ESI-MS-monitored kinetic profiles of the ions belonging to the three prototype groups A1–A3. (b) Kinetic profile similarity analysis visualized by the non-metric multidimensional scaling analysis. Each dot represents a kinetic profile of one ionic species; the larger dots highlight the position of three sub-populations (A1, A2, A3) shown in (a). The arrows denote the evolution of the kinetic profile shapes of the ions detected during the reaction.
Figure 4b illustrates the output of this analysis. Each dot in the Figure represents a particular detected ion, and the dot's position in the plane is related to the shape of the kinetic profile of those given ions (highlighted in the same color in Figure 4a). The ions with the maximum abundance at the beginning of the reaction appear on the right side of the plane (A1 group). With time, new ions are formed (A2 group), the maximum of their kinetic profile shifts to a longer reaction time, and the corresponding dots shift up and to the left in the plane (the curved grey arrow shows the progress of the reaction). The species accumulating towards the end of the monitored reaction time appear as signals with the growing ion intensity (A3 group) and correspond to the dots on the left side of the plane. Hence, the distance between the dots is a proxy to judge the similarity of the kinetic profiles, and it can be used to follow qualitatively the kinetics of the reaction mixture.
The results of this analysis for the reactions initiated by adding dihydroxyacetone, glyceraldehyde, and glycolaldehyde are shown in Figures 5a–5c. The detected ions are shown as a function of the carbon backbone length (columns) and the number of incorporated 13C atoms (rows). We used 13C-labeled formaldehyde for the investigated reaction because the isotopic labeling is easily traceable with mass-spectrometric detection, and it allows us to distinguish different origins of the detected ions. For example, C6 sugars can be formed by condensing two C3-initiators (glyceraldehyde or dihydroxyacetone) or by stepwise condensing of the C3-initiator with three formaldehyde molecules. The former process will lead to all 12C sugars (C6−0C, m/z 219; we neglect the natural 13C abundance because it is below the noise level of the experiment), whereas the latter will contain three 13C carbons (C6−3C, m/z 222).
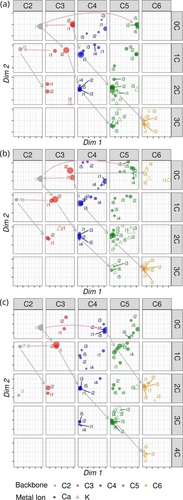
Kinetic-profile similarity analysis visualized by the non-metric multidimensional scaling. The results of the experiments performed under identical conditions (13 mM KOH/6.5 mM CaCl2, pH≈12, 70 mM 13CH2O, 20 mM initiator) with (a) dihydroxyacetone, (b) glyceraldehyde, and (c) glycolaldehyde initiators. The plots split the ion population according to the carbon chain length (C2−C6, horizontal) and the number of incorporated 13C (0C−4C, vertical). The size of the point is proportional to the relative abundance of the given ions among the species with a given carbon length (all points in a column) and represents either calcium complexes (full circles) or potassium complexes (hollow triangles). The grey arrows depict relatively slow aldol condensations, pink arrows depict fast retro-aldol and follow-up aldol reactions.
The individual ionic sugar complexes are represented by the dots, and the size of the dot is proportional to the relative abundance of the given ions (Figure 5). Each rectangle in Figure 5 shows one type of carbohydrate coordinated with calcium (full circle) or potassium (hollow triangle) ions. For example, [C3H5O3]Ca+ signals are the red dots in the rectangle denoted as C3−0C (C3-sugar with zero incorporated 13C), whereas [13C1C3H7O4]Ca+ are the blue dots in the rectangle denoted as C4−1C (C4-sugar with one incorporated 13C). The individual dots represent different isomers of the complexes (Figures S7–S14). [C3H5O3]Ca+ shows two signals (i1 and i2) corresponding to the complexes derived from dihydroxyacetone and glyceraldehyde (see also Figure 6a). The [C3H5O3]Ca+ complexes have maximum concentrations at the beginning of the reactions, showing the A1-type kinetic profile (Figure 4a, Figure 6b); therefore, they are represented by dots at the right side of the C3−0C rectangle. The [13C1C3H7O4]Ca+ ions are formed by the reaction of [C3H5O3]Ca+ with 13CH2O; therefore, their abundance culminates at a longer reaction time showing the A2-type kinetic profile (Figure 4a, Figure 6b). Accordingly, the [13C1C3H7O4]Ca+ isomers are represented by dots in the upper part of the C4−1C rectangle (Figure 5).
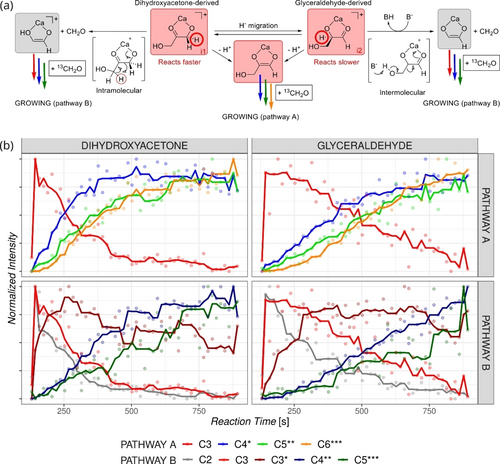
a) Suggested initial steps involving calcium complexes of the C3 initiators. b) Normalized ion abundance profiles for the growth starting with the dihydroxyacetone (left) or glyceraldehyde (right) for the series C3→C4*→C5**→C6*** (top) and C2→C3*→C4**→C5*** (bottom). The number of stars denotes the number of 13C incorporated in the given sugar complex. The Figures show the results of the experiments with 13 mM KOH/6.5 mM CaCl2, pH≈12, 70 mM 13CH2O, and 20 mM initiator being either DHA or GLA. Experiments with 10 mM initiator concentrations and with glycolaldehyde initiator can be found in the Supporting Information (Figures S17–S24).
Looking at the dot representation allows qualitative evaluation of the reaction mixture evolution in time. In general, the positions of dots in the individual fields of Figure 5 change with the size of the sugar and the number of incorporated 13C carbon atoms. The unlabeled ions (all 12C-denoted as 0C row) appear as dots on the right side of the plane, i.e., their abundance has the maximum at the beginning of the reaction and decreases with time (A1 group kinetic profile, Figure 4a). The incorporation of 13C is gradual (see the grey arrows) and happens in accordance with the evolution of the reaction mixture: the more incorporated 13C, the later the sugars are formed (A1→A2→A3). The C4 and C5 sugars show the greatest diversity of kinetic profiles (i.e., different dot positions in the plane). This diversity indicates that the C4 and C5 sugars had a central role in the evolution of the reaction mixture. In contrast, C6 sugar signals are localized at one spot of the plane associated with the kinetic profiles having an increasing intensity with time (A3 group). Hence, the reaction converges to C6 sugars within the monitored reaction time. We also detect C7 sugars, but their intensity is low, so we neglect them in this discussion.
The distance of the dots is associated with the kinetics of the given transformation. For example, the [C3H5O3]Ca+ complex (C3−0C, red, Figure 5a) quickly undergoes a retro-aldol reaction to form [C2H3O2]Ca+ (see the pink arrow from C3−0C to C2−0C in Figure 5a, see also Figure 6 and discussion below). The formed [C2H3O2]Ca+ complex quickly reacts with another dihydroxyacetone to form C5−0C (pink arrow). This reaction sequence is fast, demonstrating itself by very similar kinetic profiles and, thus, similar positions of the related dots in the planes of the corresponding fields in Figure 5a. In contrast, the reaction of the calcium complex of dihydroxyacetone with 13CH2O is slower (the grey arrow from C3−0C to C4−1C). The slower rate can be easily read from the shift of the positions in the plane of the blue dots of C4−1C compared to the starting C3−0C.
The reaction mixture evolution is similar for different initiators. However, some differences can be spotted from the multidimensional scaling analysis (Figure 5). The aldehyde initiators have a greater tendency to homo-condensation. The aldol condensation of two glycolaldehyde molecules is fast (see the dots at the same positions of the C2−0C and C4−0C fields connected by the pink arrow in Figure 5c). It is faster than the condensation of glycolaldehyde with 13CH2O (compare the dot positions in the C3−1C and C4−0C panels; see also Figure S15). The dimerized glycolaldehyde grows further by C1 units, as depicted by the grey diagonal arrows (the growth is slower, as revealed by the changing positions of the dots in the respective fields). Glyceraldehyde also undergoes homo-aldol condensation (see the pink arrow from the C3−0C to the C6−0C field in Figure 5b, and Figure S16). Following this strategy, one can quickly inspect relationships between the detected ions without inspecting all of the kinetic curves.
Toward reconstructing the topology of the network
With a qualitative overview of the global dynamics of the formose reaction in hand, we can now zoom in on the details of the individual ion signals to extract information on the observed chemical processes (see Figures S17–S24 in the SI). We will focus on comparing the reactions initiated by C3 dihydroxyacetone and glyceraldehyde. Both reactions ultimately lead to a similar population of C6 sugars.35, 36 Nevertheless, there is a striking difference at the beginning of the reaction after adding the initiators (Figure 6). The ketone initiator is more reactive (compare Figures 6b left and right). It reacts faster with formaldehyde than the aldehyde initiator, which can have different explanations. Appayee and Breslow previously argued that glyceraldehyde was mostly present as an acetal in water solutions and was, therefore, less prone to enolization.46 We detect the acetals with a low abundance, possibly due to their poor ionization efficiency or low affinity to the calcium or potassium ions (Figure S25). The signals of the detected acetals follow exactly the same abundance trends as the detected C3 sugars, suggesting that all species are in equilibrium. Both C3 initiators form two families of C3-calcium isomers (red dots i1 and i2 in Figure 5 and Figure S7–S10 in the SI). These isomers most likely correspond to the calcium complexes of aldehyde and ketone forms (Figure 6a, we do not expect the detection of an enol form because these isomers lie much higher in energy). The isomerization of the ketose to aldose can proceed via an enol form or hydride transfer (Figure 6a, the encircled hydrogen atoms can migrate as hydrides in the direct isomerization reaction; note that we always assume activated complexes with calcium ions, rather than the neutral sugar molecules or their free anions that have higher energy barriers for all observed chemistry).46 Both isomers can yield retro-aldol reactions. Given the fact that ketoses react faster in the retro-aldol reaction (see also below), we assume that the preferentially cleaved C−C bond is the one between the carbonyl and alcohol moieties coordinated to the calcium ion and the C−C bond cleavage is associated with a proton migration (see Figure 6a, see also preliminary theoretical results in Figure S26 in the SI). The retro-aldol reaction leads directly to the enol form of the C2 complex, resulting in a fast subsequent reaction with 13CH2O in solution. This chemistry is highly reproducible (see the three independent measurements in Figure S27). In addition, we repeated this experiment with C4 initiators erythrulose (ketone) and erythrose (aldehyde) and obtained the same outcome (Figure S28). The ketone initiator reacts faster with 13CH2O and is more prone to expel a C1 unit to initiate the growth reactions at one carbon smaller starter (compare Figure S28, bottom left and right).
Another dimension in the obtained results is the difference between calcium- and potassium-containing ions (full dots vs. hollow triangles in Figure 5). The C2−C4 sugars form, almost exclusively, complexes in the deprotonated form with the calcium ions. In contrast, C6 sugars are almost exclusively detected as complexes with potassium ions. C5 sugars are detected in both forms, the prevailing form depending on the initiator and the growth path. The calcium ion most likely binds between a deprotonated hydroxyl group and the carbonyl moiety of the sugar molecule. Such complexes will be prone to enolization and thus serve as intermediates in the aldol coupling.46 Larger sugars, especially those with a linear backbone, will be prone to cyclization, which might explain the preferential formation of potassium complexes for C5 and C6 sugars. Such a scenario is consistent with the observation in the experiment with the glyceraldehyde initiator (Figure 5b). The aldol condensation of two glyceraldehyde molecules leads directly to linear C6 sugars that can easily cyclize. Accordingly, these ions are detected exclusively as potassium ions (see triangles only in the C6−0C panel in Figure 5b).47, 48 Alternatively, the larger sugars can have a branched structure that could create a favorable oxygen-rich coordination site for the potassium ion.35, 36
We further tested the cyclization hypothesis for the larger sugars by comparing the Collision Cross Sections (CCS) from the ion-mobility separation of ion signals (Figure 7). Most of the detected sugars have several isomeric populations. The C4 sugars show five populations according to their CCSs (see also Figure S29). Analysis of the fragmentation patterns of the ion-mobility separated isomers reveals that the ions with the smallest CCS (i1) correspond to the calcium-bound dimers of glycolaldehyde. The population with the medium CCS (i2) likely corresponds to the branched C4 sugars, and the dominant population (i5) corresponds to the linear C4 sugars (Figure S29). We further observe the growth of both, branched and linear sugars as calcium complexes (Figure 7). The results for the C5 sugars suggest that different isomers of the linear C5 sugars are formed, and their population depends slightly on the growth initiator. The potassium complexes have distinctly different CCSs than the calcium complexes, and their size is smaller. This result is consistent with detecting potassium complexes of cyclized sugars.
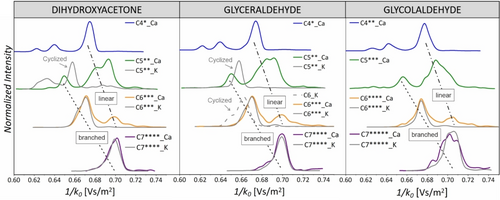
Normalized ion mobilograms. The traces refer to C4−C7 sugar complexes with either calcium or potassium ions; the number of incorporated 13C is denoted by the star symbols. The ratio of the intensities of the Ca and K ions for the experiments with: dihydroxyacetone C5: Ca/K=4/1, C6: Ca/K=1/13, and C7: Ca/K=1/9; glyceraldehyde C5: Ca/K=1/4, C6: Ca/K=1/10, and C7: Ca/K=1/8; glycolaldehyde C6: Ca/K=1/15, and C7: Ca/K=1/6.
The distribution of the C6 sugar isomers shows a distinct jump. The linear isomers with the largest CCS are no longer the dominant population. Instead, the isomers with a smaller CCS prevail. This finding suggests that the main growing C5→C6 path led to the branching of the sugar backbone. The overlap of the CCSs of the calcium and potassium ions most likely suggests that the sugars are not cyclized. Instead, the number of incorporated oxygen atoms results in favorable coordination of the potassium ions to the neutral sugars, and therefore, we detect them in addition to the calcium complexes. In agreement with this hypothesis, the C7 sugars completely lack the population of linear sugars expected at a higher CCS. The branched C7 sugars are sampled as calcium and potassium complexes with almost identical CCSs. The C6 sugars formed by dimerization of glyceraldehyde (dashed line in Figure 7b) have a different CCS than the complexes detected from the growth reaction. These sugars are likely cyclized because they are detected exclusively as potassium complexes and are somewhat smaller than the potassium complexes of branched C6 sugars formed by the growth reaction with formaldehyde. The cyclization is also consistent with their slow further growth (see Figure S30 in the SI).
Conclusion
We present a new approach to studying complex reaction mixtures based on direct monitoring using ion-mobility-separation mass-spectrometry (IMS-MS) interfaced by electrospray ionization (ESI). Monitoring of the reaction mixtures provides multidimensional time-dependent data. Chemometrics analysis of the data can capture the major components characterizing the kinetic evolution of the reaction mixture. The annotation of the major signals revealed the ions that characterize the chemistry of the investigated reaction mixture. The ESI-MS-monitored kinetic profiles of the characteristic ions were analyzed by similarity analysis and visualized in 2D space by non-metric multidimensional scaling. This approach provided a graphical representation of the dynamic evolution of the reaction mixture.
We show this approach for the formose reaction, formaldehyde condensation under basic conditions catalyzed by calcium ions. The data show calcium ions of the sugars formed during the reaction, capture the qualitative kinetics of sugar growth, and show the differences in reactivity of aldoses and ketoses. In particular, a fast retro-aldol reaction is observed for the calcium complexes with ketoses, leading more rapidly to a larger diversity of the reaction mixture if a ketone rather than an aldehyde of the same size is used as an initiator. Ion mobility separations of the individual sugar complexes reveal the cyclization of the C5 sugars and branching of the C6 and C7 sugars.
Our analysis is illustrative but by no means exhaustive. For future research, the data offer many angles for mining the information about the formose reaction. The data contain information about different isomers of the formed sugars and their reactivity. Some sugar isomers show distinctly different kinetics than most others (see the outliers in Figure 5). We believe this approach can disentangle many questions about complex reaction mixtures and can be generalized for studying reaction sups mimicking prebiotic chemistry or other complex reaction mixtures. Our pipeline also sets the stage for constructing quantitative kinetic models, although the non-linear ESI-MS response to the solution concentrations must be overcome. This can be achieved by performing the reactions under continuously changing conditions, thus breaking correlations between kinetic parameters in the model.49
Acknowledgments
This work was supported by the Dutch Research Council (NWO—OCENW.KLEIN.348).
Conflict of interest
The authors declare no conflict of interest.
Open Research
Data Availability Statement
All raw and processed data will be open access at the Radboud Data Repository (https://doi.org/10.34973/ykmp-yb68).


