Two-dimensional Pure Isotropic Proton Solid State NMR
Abstract
One key bottleneck of solid-state NMR spectroscopy is that 1H NMR spectra of organic solids are often very broad due to the presence of a strong network of dipolar couplings. We have recently suggested a new approach to tackle this problem. More specifically, we parametrically mapped errors leading to residual dipolar broadening into a second dimension and removed them in a correlation experiment. In this way pure isotropic proton (PIP) spectra were obtained that contain only isotropic shifts and provide the highest 1H NMR resolution available today in rigid solids. Here, using a deep-learning method, we extend the PIP approach to a second dimension, and for samples of L-tyrosine hydrochloride and ampicillin we obtain high resolution 1H-1H double-quantum/single-quantum dipolar correlation and spin-diffusion spectra with significantly higher resolution than the corresponding spectra at 100 kHz MAS, allowing the identification of previously overlapped isotropic correlation peaks.
Introduction
Solid-state NMR spectroscopy (in conjunction with diffraction methods and other spectroscopies) would be the method of choice for atomic-level characterization of complex materials.1 Indeed, there has been rapid development in this direction in recent years, with notable success in for example pharmaceutical compounds,2 MOFs,3 cements,4 organic semiconductors,5 biomass,6 battery science,7 catalysis,8 and hybrid perovskite photovoltaics.9 These studies validate the very broad impact that NMR can have in materials chemistry when it can be deployed.
However, a key bottleneck to further development is that 1H NMR spectra in organic solids are usually very broad, precluding the use of the 1H detected strategies that have driven the development of solution-state NMR over the last 50 years. Indeed, the state-of-the-art solution-state NMR methods have been primarily enabled by the high 1H spectral resolution obtained in solutions.
The much more limited use of these methods is because 1H NMR spectra of solids are typically two orders of magnitude less well resolved.1 However, in cases where the resolution in the proton spectrum is sufficient, the advantage provided by 1H NMR in solids is clearly established.1, 2, 10 The advent of faster magic angle spinning (MAS), which usually leads to better resolved 1H spectra, has been a key factor in enabling 1H detection in a broader range of systems. Nevertheless, poor 1H resolution is still the main bottleneck for widespread application of 1H based schemes in rigid organic materials at natural isotopic abundance.
Most approaches to improving 1H resolution rely on coherent averaging methods, that allow the suppression of 1H-1H dipolar couplings while retaining chemical shifts.11 However, coherent averaging schemes are always imperfect. For 1H MAS NMR, imperfect averaging leads to residual dipolar broadening, and these residuals limit the resolution in 1H MAS spectra.11k, 12 This constitutes a fundamental limitation: even at the fastest MAS rates (around 100–150 kHz)12d-13 possible today, the spectra obtained are hundreds of hertz broader than their isotropic linewidths.
We recently suggested new approaches to 1H line narrowing, without the need for multiple-pulse decoupling, using a combination of fast MAS and 2D correlations.14, 15 Specifically, we introduced an approach where instead of trying to optimize and perfect a coherent averaging scheme to minimize errors that cause residual dipolar broadening, the errors are instead parametrically mapped in a second dimension and therefore removed in a correlation experiment. In a proof-of-concept demonstration we were able to obtain pure isotropic proton (PIP) spectra that contain only the isotropic shifts.15 These new approaches provide the highest 1H NMR resolution available today in rigid solids.
While high-resolution one-dimensional spectra are useful, most applications of NMR spectroscopy today require two-dimensional correlation experiments. In this respect, the possibility of measuring ultrahigh-resolution 1H-1H correlations is especially attractive, as it enables both structure determination and assignment.
Here, we extend the PIP approach to a second dimension in order to obtain ultra-high resolution 1H-1H double-quantum/single-quantum16 (DQ/SQ) dipolar correlation spectra and 1H-1H spin-diffusion17 (PSD) spectra. We illustrate the method on L-tyrosine hydrochloride and ampicillin, where we obtain two-dimensional spectra with significantly higher resolution as compared to corresponding spectra acquired at 100 kHz MAS. The spectral resolution is very significantly increased in both dimensions, allowing the identification of resolved isotropic correlation peaks that were overlapped in the 100 kHz MAS spectra.
The PIP approach works by obtaining a one-dimensional pure isotropic spectrum from a two-dimensional set of MAS spectra recorded at variable spinning rates (VMAS).15 In this 2D dataset, the isotropic part of the interactions remains constant as a function of spinning rate, while the anisotropic parts that lead to broadening and shifts are scaled by the spinning. The isotropic part can be separated out by a suitable transform, so far shown either by parametric fitting,15a or more recently by a deep learning method.15b In the latter approach a modified convolutional LSTM neural network, dubbed PIPNet, was trained on millions of synthetic VMAS datasets to infer isotropic 1H NMR spectra. Both approaches, yield isotropic spectra that display linewidths in the 50–400 Hz range for crystalline molecular solids.
Here, we use three-dimensional datasets made up of two-dimensional DQ/SQ or spin-diffusion spectra acquired at different MAS rates to obtain two-dimensional 1H-1H DQ/SQ or 1H-1H PSD correlation spectra with pure isotropic lineshapes in both dimensions by transforming the data with a suitable deep learning prediction network, dubbed PIPNet2D.
Results and Discussion
In the absence of any extensive experimental databases of NMR spectra, training machine learning models on synthetic datasets (of shifts or spectra) has been to shown to be an efficient way forward.18 Here, the generation of synthetic three-dimensional datasets used to train a LSTM neural network was based on a protocol analogous to that used previously for two-dimensional VMAS datasets.15b The overall approach is illustrated schematically in Figure 1. Specifically, synthetic two-dimensional pure isotropic spectra (ground truth) were generated as the outer product of two randomly generated one-dimensional isotropic spectra. The component one- dimensional isotropic spectra and associated VMAS spectra were generated assuming that the dipolar couplings lead to a MAS rate dependent broadening, with a shape that is a sum of Gaussian and Lorentzian components, and that they also lead to a MAS rate dependent shift in the peak positions.12d, 15a We also include random parameter variations in peak positions, peak shapes, MAS dependences, phase and intensity errors, and noise, as described previously in reference15b but with an increased probability to generate broad isotropic peaks in order to promote diversity in the two-dimensional isotropic lineshapes.
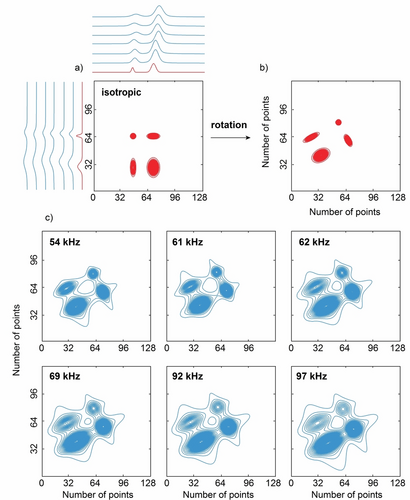
Representative example of a synthetic isotropic (red) two-dimensional spectrum a) before and b) after rotation and c) a three-dimensional dataset (blue) that consists of two-dimensional spectra at different MAS rates. In (a) the one-dimensional isotropic spectra whose outer product leads to this two-dimensional isotropic spectrum and their corresponding variable MAS rate spectra are also shown. Here the full dataset contains 12 spectra at different MAS rates but only six selected spectra are shown. The rotation angle applied here during the data generation process was 61.5°.
The corresponding synthetic three-dimensional datasets of two-dimensional spectra at variable MAS rates were generated by the outer product of the 2D VMAS datasets. To mimic varying degrees of correlation in the 2D lineshapes, the sets of isotropic and associated MAS spectra were then rotated with a probability of 50 % by a random angle uniformly sampled between 0 and 90°, in order to produce lineshapes with elongated shapes along different orientations in the 2D spectra. (Examples are shown in Figure S1). Each three-dimensional dataset generated contained 12 MAS spectra, each of which generated with a random MAS rate sampled from a uniform distribution between 50 and 100 kHz. Complete details about the data generation are given in Supporting Information. An example of a synthetic MAS dataset and its isotropic counterpart typically used for the training of the model is shown in Figure 1.
Note that the synthetic spectra generated here do not actually make any assumptions or follow any particular rules associated with a type of experimental 2D correlation spectrum. That is, they do not correspond to, e.g., COSY, or DQ/SQ spectra, with diagonal and/or cross peaks in well-defined positions. The synthetic spectra only consist of a set of two-dimensional peaks in randomized positions in the spectra, and with lineshapes that obey the rules described above. As such, the model could be applied to any 2D correlation spectrum.
Several approaches to using machine learning in NMR related problems have been proposed recently.15b, 18, 19 These range from deep and convolutional neural networks to predict chemical shifts in liquids,18k-18m to CNN models for reconstruction of two-dimensional spectra from undersampled data,18a, 18b, 18n, 18s denoising of low signal-to-noise spectra,18d performing deconvolution and deep learning-based peak picking18c, 18o and virtual decoupling.18q, 18t In the problem at hand, the LSTM type of network appears suitable since it has been shown to outperform other recurrent neural networks in processing time series,20 and since it was shown to work well to predict 1D isotropic spectra.15b The only changes used here with respect to the model to predict 1D spectra is the use of two-dimensional convolutional layers, using 4 layers instead of 6, and the use of only one model instead of a committee of 16 models. The latter being done in order to reduce the computational requirement at inference. (A link to the code used is given in Supporting Information). The model was trained on a total of 1 000 000 datasets, corresponding to 12 000 000 spectra. To process each three-dimensional dataset of MAS spectra in order to obtain the isotropic 2D spectrum, the network is incrementally given the next MAS spectrum in the series in order of increasing MAS rate, and produces an output after each step, as described previously.15b The model was trained by minimizing the mean absolute error (MAE) between the prediction after each step and the ground-truth two-dimensional isotropic spectrum.
As before, due to the sparsity of signal in the two-dimensional isotropic spectra, we initially convoluted the entire target isotropic spectrum with a 2D Gaussian function with a width of 25 Hz and weighted the loss function by the maximum between 1 and 10 times the value of the target isotropic spectrum (after convolution with the Gaussian) in order to promote the identification of signal in the spectra. After 200 000 sets of spectra, this convolution and weighting were removed for the rest of the training.
Random noise was also introduced into the generated MAS two-dimensional spectra following the typical signal-to-noise ratios observed in experimental 1H-1H correlation spectra (between 10 and 100 for the most intense peak at 100 kHz). Figure 2a shows the evolution of the loss function during the model training.
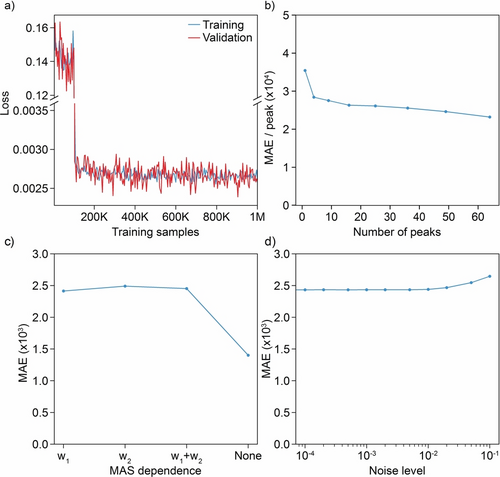
a) Evolution of the loss function during model training. b)–d) MAE between predictions and ground-truth isotropic spectra for 1024 samples of isotropic spectra with various b) numbers of peaks, c) MAS dependence (w1: first-order, w2: second-order), and d) noise levels.
The model was evaluated by computing the MAE between the synthetic ground truth and the predicted isotropic spectra for samples generated with different parameters. We investigated the effect of (i) the number of peaks in the two-dimensional isotropic spectra, (ii) different MAS dependencies of the linewidths and MAS-dependent shift (first-order, second-order, mixed first- and second-order, or MAS independent), the range of MAS rates generated, the number of MAS spectra used, as well as the amount of noise introduced into the spectra themselves and into the linewidth and shift dependences. Mean absolute errors between predictions and ground-truth isotropic spectra for 1024 samples of isotropic spectra with various numbers of peaks, MAS dependences (first order, second order, combined, or constant), and noise levels are shown in Figure 2b–d, and some selected examples are shown in Figure 3 (with more details and examples (Figure S2) given in the Supporting Information) in order to provide a more visual appreciation of the expected changes in the spectra corresponding to the changes in MAE shown in Figure 2.

a)–c) Illustrative comparisons of synthetic highest MAS rate spectra (blue), predicted isotropic (red), and ground-truth isotropic (black) spectra with a) the example of the synthetic dataset shown in Figure 1, b) a MAS independent synthetic dataset, and c) a synthetic dataset with a high noise level. In this example the spectra are made up of 128×128 points, that would correspond to a frequency range of 3 kHz with about 24 Hz/point digital resolution.
Figure 4 shows the 1D and 2D isotropic spectra obtained from two experimental sets of variable MAS 1D and 2D spectra recorded on two small organic micro-crystalline samples of L-tyrosine hydrochloride (Figure S3) and ampicillin (Figure S4). Figures 4a and b show the performance of the PIPNet2D model on sheared three-dimensional VMAS datasets for both compounds, consisting of two-dimensional BABA spectra recorded at 9 (ampicillin) and 11 (L-tyrosine hydrochloride) rates between 50 and 100 kHz MAS. The sheared SQ/SQ representation is exactly equivalent to the DQ/SQ but gives an easier to visualize rendition of the two-dimensional lineshapes.21 Full details are given in the Supporting Information.
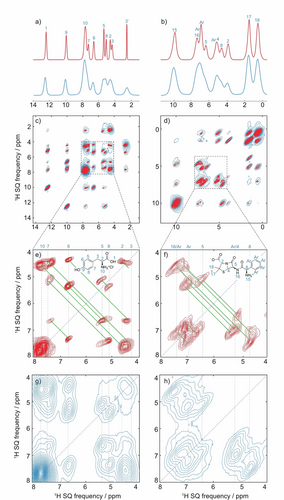
Spectra obtained from microcrystalline powdered samples of L-tyrosine hydrochloride (left) and ampicillin (right). a), b) 100 kHz MAS spectra (blue) and isotropic spectra (red) inferred with the PIPNet model15b from a VMAS dataset of 1D spectra recorded at 36 rates between 30 and 100 kHz (reproduced from Ref. 15b). c), d) Corresponding 100 kHz MAS 2D 1H-1H DQ/SQ BABA spectra (blue) and pure isotropic 2D 1H-1H DQ/SQ BABA spectra (red) inferred with the PIPNet2D model from a VMAS dataset of 11 and 9 2D spectra recorded at the MAS rates between 50 and 100 kHz, both after shearing to an SQ/SQ representation, for samples of L-tyrosine hydrochloride and ampicillin, respectively, and acquired with one rotor period of DQ recoupling. e), f) Expansions of the pure isotropic 2D spectra, and (g, h) expansions of the 100 kHz 2D spectra. In (e) to (h) the vertical dotted lines indicate the previously assigned proton shifts at 100 kHz MAS,15 the blue dotted line the diagonal of the spectrum, and the green solid lines the observed double quantum correlations.
In Figures 4c and d, the marked increase in resolution achieved in both dimensions of the pure isotropic 2D spectra, as compared with that obtained in the corresponding spectra at 100 kHz MAS, is clearly visible. This increase is most prominent in the crowded spectral regions between 4 and 8 ppm both for L-tyrosine hydrochloride and ampicillin (expansions of these regions in both the pure isotropic and corresponding 100 kHz MAS 2D spectra are shown in Figures 4e to h).
We note in particular that, as discussed above, the model was not specifically trained to recognize sheared DQ/SQ spectra, so that, for example, the inferred spectra are not constrained to have any particular symmetry. Furthermore, the model can be equally well applied to the unsheared DQ/SQ spectra, and very similar results are obtained as shown in Figures S6 and S7. Rows from the pure-isotropic and the 100 kHz MAS spectra are also shown in Figure S6 for comparison.
The two-dimensional pure isotropic spectra were found to retain the expected number of peaks from the known assignments, without displaying any significant artifacts or any additional peaks in unexpected regions of the spectra. This is impressive, especially if we consider the reduced quality of the datasets used here as compared to typical 1D MAS spectra. Compared with the one-dimensional data used before, here the 2D spectra have lower signal-to-noise ratios and display t1 noise, and baseline and cross-peak intensity distortions across the range of MAS rates. (Note for example that since the BABA mixing time is rotor synchronized, the mixing time systematically decreases as the MAS rate increases, which will lead to variations in cross-peak intensities.)
Another important point is that the isotropic two-dimensional peaks in the inferred spectra seem to retain the lineshape characteristics present in the 100 kHz MAS spectra, arising possibly from inhomogeneous contributions, correlated two-dimensional lineshapes,22 or magnetic susceptibility effects.23 PIPNet2D is therefore not simply identifying potential peaks and replacing them with uniformly narrow shapes. This can be clearly seen for protons H2 and H17/H18 of ampicillin as well as the labile protons of L-tyrosine hydrochloride. Overall, the spectra obtained using the 1D PIPNet model and PIPNet2D were found to be coherent, with good agreement between the 1D isotropic spectra obtained from a set of 1D MAS spectra using PIPNet and the projection of the 2D isotropic spectra obtained here for L-tyrosine hydrochloride and ampicillin, respectively. We do note that the 2D model does not yield the same degree of line narrowing in the projections of Figures S8 and S9 as compared to the 1D model. While the increased sources of errors discussed above could contribute to the lower level of narrowing achieved here compared to the 1D model, we do not expect them to be the limiting factor since they were explicitly taken into account in the model training. This suggests that the synthetic datasets used here do not yet fully capture the whole complexity of the experimental 2D spectra, and clearly indicates that further progress can be made in the future.
Figures 5 shows the performance of the PIPNet2D model on a three-dimensional PSD VMAS dataset for L-tyrosine hydrochloride (Figure S5), consisting of two-dimensional 1H-1H spin-diffusion spectra recorded at 6 MAS rates between 50 and 100 kHz MAS. In Figure 5d the resolution achieved in both dimensions of the pure isotropic 2D spectrum is evident and allows the clear identification of correlations between, for example, H6 and H10 or H2 and H5, that were difficult to clearly observe in the corresponding PSD spectrum at 100 kHz MAS, shown in Figure 5c.
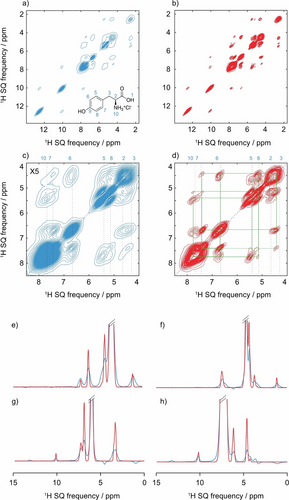
Spectra obtained from microcrystalline powdered samples of L-tyrosine hydrochloride. a), b) 100 kHz MAS 2D 1H-1H spin-diffusion spectra (blue) and pure isotropic 2D 1H-1H spin-diffusion spectra (red) inferred with the PINet2D model from a VMAS dataset of 6 2D spectra recorded at the MAS rates between 50 and 100 kHz. In the VMAS experiments, the PSD mixing time was varied from 5 to 10 ms as the spinning rate was increased to maintain similar cross-peak intensities across the dataset (as described in Supporting Information). c), d) Expansions of the 100 kHz and pure isotropic 2D spectra. (e) to (h) horizontal cross sections extracted for F1 SQ frequencies of 4.5, 5.5, 6.7, and 7.7 ppm. In (c) to (d) the vertical dotted lines indicate the previously assigned proton shifts at 100 kHz MAS,15 the blue dotted line the diagonal of the spectrum, and the green squares the observed spin-diffusion correlations.
The horizontal cross sections shown in Figure 5e–h are an additional direct illustration of the enhanced resolution of the pure isotropic 2D spectrum over the corresponding 100 kHz MAS 2D spectrum. PIPNet2D is expected to perform best for the cross peaks, as compared to the diagonal peaks, since the integral normalization of the 3D dataset was done with respect to a selected cross peak intensity.
In the VMAS experiments, the PSD mixing time was varied from 5 to 10 ms as the spinning rate was increased in order to compensate for slower spin diffusion at faster MAS rates and to maintain similar cross-peak intensities across the dataset (as described in Supporting Information). Since the spin diffusion rates between different spin pairs will have slightly different MAS rate dependencies,24 this procedure cannot be perfect and will introduce a source of error.
That the model can be successfully directly applied to DQ/SQ (whether sheared or not) or to PSD datasets illustrates that the PIPNet2D model is quite robust and can be used quite generally to obtain two-dimensional 1H-1H correlation spectra with higher resolution in both dimensions from 3D VMAS datasets, and that it is not restricted to inferences for a specific type of two-dimensional spectra.
Across the three sets of 2D spectra shown here, PIPNet2D reduced observed linewidths by a factor of 3.33±0.10 in both dimensions compared to 100 kHz MAS spectra (see Table S4).
Conclusion
We have introduced PIPNet2D, a deep learning model to increase resolution in two-dimensional NMR spectroscopy by predicting pure isotopic two-dimensional correlation spectra of solids from three-dimensional datasets of 2D spectra acquired at variable MAS rates. We have illustrated the method by obtaining isotropic spectra from experimental datasets on two different microcrystalline organic solids. The resolution obtained is very significantly improved compared with the 100 kHz MAS spectra. The residual linewidths or the quantitative character of the inferred spectra (Figure S7) can in principle be limited by several factors. Some are intrinsic to the samples, such as structural disorder or magnetic susceptibility broadening, and others might be due to experimental imperfections such as systematic noise or cross-peak intensity variations, MAS instabilities or poor shimming, or limitations in the model, such as incomplete descriptions of the lineshape and MAS-dependence. All these factors will be the subject of future study.
For example, we expect that the use of more robust pulse sequences for the DQ/SQ type experiments, that might better remove some of the experimental imperfections, should potentially improve the robustness of the model.25 Further improved results might also be obtained by training models specifically on a given type of correlation experiment.
In conclusion, the model presented here provides significant improvement in the resolution of 2D 1H-1H DQ/SQ and spin-diffusion spectra, and we expect that the approach can be used to develop models for other two-dimensional correlation experiments in the future.
Acknowledgments
This work has been supported by Swiss National Science Foundation Grant No. 200020_212046, NCCR MARVEL, and the European Union's Horizon 2020 research and innovation programme under Grant Agreement No. 101008500 (PANACEA). Open Access funding provided by École Polytechnique Fédérale de Lausanne.
Conflict of interest
The authors declare no conflict of interest.
Open Research
Data Availability Statement
The data that support the findings of this study are openly available at the following link https://doi.org/10.24435/materialscloud:xj-5f. The code and pre-trained model are also available in the GitHub repository https://github.com/manucordova/PIPNet. The data and code are available under the CC-BY-4.0 (Creative Commons Attribution-ShareAlike 4.0 International) license.


