Comprehension of Jet Physics from the Analysis of the Gamma-Ray Burst Afterglow Parameter Distributions
Abstract
The discovery of a short gamma-ray burst (GRB), GRB170817A, in association with a gravitational wave (GW) and a bright kilonova started a new era in the high-energy astrophysics. The observation of GRB170817A and more recently, GRB200826A and GRB211211A, a short and a long burst, respectively, with a possible kilonova, reinforce the concern about new ways of classification. For this reason, a new machine learning technique is applied to Swift-BAT data, searching for morphological similarities in the light curves. The resulting map is characterized by two distinct groups, although still correlated with standard T90 duration. Since a jet viewed off-axis could explain the emission from GRB170817A, the modeling of this kind of sources is of great importance. A public code called JetFit, based on the “boosted fireball” model, is applied to fit Swift-XRT afterglow light curves of short and long GRBs, with known red-shift, from 2005 to 2021. JetFit does not model the flaring activity. For this purpose, a new technique to remove the time flaring phases, is developed. This analysis provides a comprehensive study of the prompt and of the afterglow phase, trough the study of the best-fit parameters.
1 Introduction
A new era in the high-energy astrophysics began since the discovery of a short Gamma-Ray Burst (GRB)[1] in association with a gravitational wave (GW)[2] and a bright kilonova.[3] The emission from GRB170817A spans from gamma-ray to radio frequencies. The detection of an electromagnetic counterpart seen at different wavelengths by follow-up observations confirm the theoretical scenario of double neutron stars merger as progenitor of short GRBs.[4]
The observation of another short GRB, GRB200826A,[5-7] and a long one, GRB211211A, with possible associated kilonovas,[8, 9] strongly motivates the need of a new typology of classification, not only based on T90. In fact, short GRBs are believed to be associated with the merger of compact objects and long GRBs with a collapsar system. A new kind of classification could in principle attribute different progenitors to different groups of bursts, based on physical parameters. Furthermore, there is a lack of a simple classification based on the intrinsic characteristics of the GRBs, despite several efforts were made, like, for example, a distinction made using the spectral lag or peak energy[10] or the time-averaged γ-ray luminosity.[11] For all of these reasons it is necessary to try to overcome the standard T90 classification, and to find a new procedure to distinguish the GRBs in relation to their intrinsic characteristics. We then apply the same method described in ref. [12] on Swift-BAT data, extending the original GRB sample till August 2020. Moreover we fit the afterglow light curves (LCs), searching for possible average physical characteristics that could associate the new sub-classes through their best-fit parameters. The analysis of the afterglow component of our sample of GRBs represents a new contribution to the analysis done in ref. [12] Indeed the best-fit parameter distributions, studied according to the machine learning division, are capable of demonstrating that the two groups can show a related physical background.
Many models[13-15] have been proposed to describe the spectral and temporal properties of GRB170817A; however their validity cannot be easily verified due to the complexity of the parameter space and the variation of the predictions. For this reason, the necessity to use a simple and physically motivated model becomes more and more compelling. The “boosted fireball” model,[16] initially used to fit the data of GRB170817A,[17] is characterized by two Lorentz factors (η0 and ) that can describe the geometry of the outflow and its late time emission, for a typical GRB's light curve (LC) with an arbitrary viewing angle. The strength of this model lies in its capability to generate a wide range of possible jet configurations, according to the values attained by the two Lorentz factor. Low η0 and can describe a mildly relativistic quasi-spherical fireball, while high values of η0 and a highly relativistic structured jet, as well as intermediate structures for intermediate values. In this way, the jet opening angle arises naturally without approximations or external assumptions from the definition of the boosted Lorentz factor . The “boosted fireball” model allows to study the orientation of the jet, with respect to the observer angle, in an easy way. GRB170817A was observed off-axis, so understanding how the sample is observed is of great importance in order to search for possible similarities with this particular burst.
This paper is organized into two main sections: the first one is dedicated to the analysis of Swift-BAT prompt LCs using an unsupervized machine learning algorithm called t-Distributed Stochastic Neighbor Embedding (t-SNE);[18] the second one is dedicated to the analysis of the afterglow phase of Swift-XRT GRBs, with known red-shift, applying the JetFit code on the LCs. The results are summarized and discussed in the Conclusions section.
2 Prompt Emission
The Swift observatory was launched in 2004[19] and, thanks to its three instruments on board, is able to investigate both the GRB prompt and afterglow emission in a wide energy range spanning from the UV to the X-rays. In this section, we analyze the GRBs prompt data coming from the Swift-BAT online public repository https://swift.gsfc.nasa.gov/results/batgrbcat/, from January 2005 to August 2020, ending up with ≃ 1380 GRBs. Our analyzed sample includes 69 GRBs that are not contained in the original sample in ref. [12] We will apply a machine learning algorithm that is capable of distinguishing between different LCs, to overcome the uncertainty relative to the standard T90 threshold. The resulting output is a classification map in which similar GRBs should belong to the same cluster of points.
2.1 Analysis with t-SNE
Following ref. [12]. we apply t-SNE on the prompt data contained in the Swift-BAT catalog from 2005 to 2020. The data are released in four bands, 15–25, 25–50, 50–100, and 100–350 keV with different temporal resolutions, for example, 64, 128, or 512 ms. We decided to use the background subtracted, 64 ms binned, LCs, to be consistent with ref. [12]. For our analysis we use only data taken in the lowest energy channel, 15–25 keV, which has shown the largest degree of separation between LCs. Since every burst greatly differs from each other in the duration length, the first step in the analysis procedure consists in the standardization of the data. We want to obtain a set of vectors with identical dimension, one for each GRB, representing the physical content of the original BAT LC sample. Following the original idea, we decided to limit the LCs to the interval T90 and to zero-pad the data to ensure the same length requirement is satisfied. The vector length is chosen, for t-SNE performance reasons, to be the nearest power of two of the number of data points for the burst with the largest T90. The zero-pad procedure is performed by filling with zeros the extra data points for LCs with shorter durations.
- 1. select the data points that are contained in the interval T90-10% and T90+10%
- 2. apply the discrete time Fourier transform (DTFT) to the padded channel, normalized by its integral; get the modules of the Fourier transforms
- 3. apply t-SNE on the modules of the DTFT
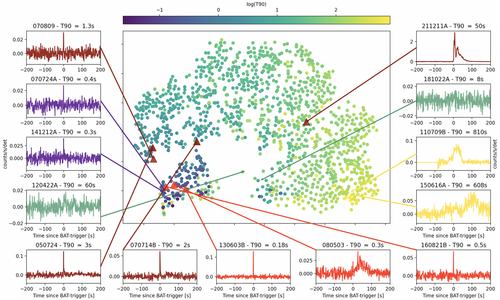
The output of the algorithm, for the whole GRB sample, can be represented as a 2D map where a classification in clusters should appear, if t-SNE is able to distinguish between different characteristics and associate the similar ones. The resulting map can be seen in the central panel of Figure 1 where two main groups can be easily identified. As can be observed from the colored bar on the top of the figure, the smaller group is mostly populated by short GRBs and the larger group by long ones. This clearly indicates that the t-SNE classification algorithm groups the bursts approximately by their duration. In the left and right panels of Figure 1, some interesting LCs, 1 s binned, are plotted and colored differently. The seven LCs presented in two different shades of red are the ones associated with a possible kilonova. In the left panel, two short GRBs in purple, are seen by t-SNE as neighbors and placed indeed in the same group. The same result could be observed for two typical long GRBs colored in yellow in the right panel of the figure.
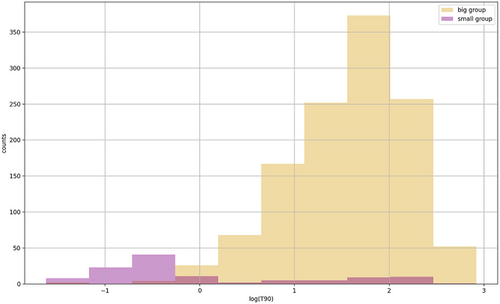
In Figure 2, the distribution of the logarithmic values of T90 duration, for the BAT sample, has the typical two-peaks shape. From this plot we can see that the two distributions cannot be easily separated by the usual classification threshold placed at ≃ 2 s. A small amount of GRBs that, based on their durations should be considered as standard long GRBs, are grouped by t-SNE in the smallest group; the same feature could be seen for the short GRBs. This could indicate that t-SNE recognizes similarities in the LCs that, if we use only a classification based on T90, we would miss. The classification map in Figure 1 and the T90 distributions in Figure 2 present similarities with the corresponding plots shown in ref. [12] The two classification maps have comparable shapes, which is expected since we enlarge the sample of only 69 bursts. The main differences between these two works basically consists of some analysis details. We use only these data in the lowest energy range (15–25 keV) and we select data points around the T90 value. Instead, in ref. [12], the analysis involves data coming from all the four channels and the cut is made based on T100. This could indicate that the analysis done with t-SNE is still robust: even if we modify some details and enlarge the sample, the algorithm can create two similar groups in an expected way. The two groups, created after the t-SNE classification, can be clearly identified, though being still correlated with the T90 value.
2.2 The Kilonova Sub-Sample
Figure 1 shows the map obtained with the application of t-SNE on BAT LCs, where the two different shades of red indicate those GRBs with a possible kilonova association. Four, out of the seven red triangles, refer to GRBs taken from the “golden sample” described in ref. [21]. The “golden sample” consists in a sub-set of short GRBs, with clear red-shift determination, which have a possible associated kilonova with characteristics similar to AT2017gfo. In addition, we also consider GRB070809, another kilonova candidate,[22] GRB211211A, a long GRB with a recently kilonova attribution[8, 9] and GRB080503, with unknown red-shift. We decide to include these bursts, to enlarge, as much as possible, our kilonova candidates. The most remarkable thing in this plot is that, nevertheless these GRBs belong to the two different groups, six out of seven of them are not so far from each other. t-SNE locates three GRBs, GRB070809, GRB050724, and GRB070714B at the bottom edge of the biggest group, while it places GRB211211A, which is a long burst, in the middle of the big group. Looking at the LC of GRB211211A, we can see that it is a typical long GRB, so it is natural for t-SNE to place this burst in the middle of the large group.
The LCs of GRB070809, GRB050724, GRB070714B, GRB130603B, and GRB160821B, shown in Figure 1, demonstrate very similar behavior with a narrow and sharp peak.
Despite the small number of GRBs with a possible kilonova association, t-SNE sees all these bursts as neighbors, except for GRB211211A that has a completely different LC. In a map in which the relative distances between points are of great importance because they represent the way with which the grouping is realized, the proximity of these bursts could represent an association also from the physical point of view.
2.3 The Non-Collapsar Sub-Sample
The fact that t-SNE produces two groups, making a distinction mainly based on the shape of the prompt LC of the bursts, does not provide information about the origin of the GRBs of the sample. Nevertheless, since t-SNE groups bursts with similar characteristics, we could expect that this method would in principle be able to give us information about a possible common origin of neighboring GRBs. Moreover, as can be seen from Figure 1, there is a clear presence of long bursts in the small group and of short bursts in the big group. In order to understand more about a possible common origin of our bursts and to investigate the mutual contamination between groups, we decided to use the results from Bromberg et al.[23] in our analysis.
Bromberg et al.[23] give a quantitative estimation of the contamination of short bursts that possibly have a collapsar origin and of long bursts that have non-collapsar origin. Using a model showing that the duration distribution of collapsars is flat, they compute the probability that a burst, with a specific duration, is a collapsar or not. One of their most interesting result is that this probability depends on the observing instruments considered. In particular, for Swift, there is a contamination of 40% of short bursts in the collapsar group and so the division, in short or long bursts, at 0.8 s is more suitable.
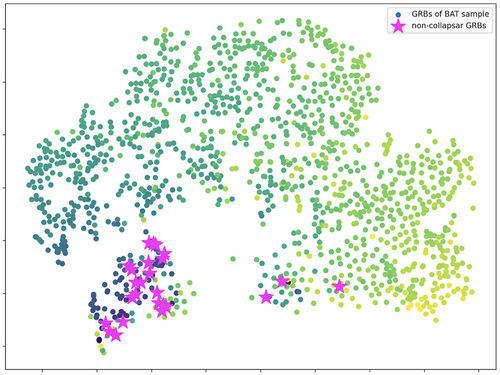
Moreover they find that 27 GRBs have a probability to origin in a non-collapsar system. We search for these 27 GRBs on our sample and find that the majority of the bursts are indeed located in the small group, as can be seen in Figure 3, suggesting a possible merger origin for those GRBs that belong to the same small group. Bromberg et al. also computed the probability of contamination between the collapsar and non-collapsar groups. From our analysis we find that, in a total amount of 119 short bursts, 29 are located in the big group, corresponding to a contamination of . We also have 1197 long bursts with a contamination of in the small group. This could indicate that, attributing a collapsar origin to the big group and a non-collapsar origin to the small one with t-SNE analysis, could be a preliminary indication of the physical progenitors of the GRBs considered, also in the absence of kilonova observations.
3 Afterglow Phase
The main purpose of the analysis of this section is dedicated to the afterglow emission, to get an average description of our GRB sample. All the LCs from the Swift-XRT online data catalog, from 2005 to 2021, with known red-shift are used. To increase the number of the bursts in the sample, we searched in the Simbad online catalog[24] for those GRBs that, at the time of their observation by XRT, do not have a measured red-shift.
Indeed, the red-shifts taken from the XRT online catalog are obtained from GCNs, while several ones were attributed with a following observation campaign. We then enlarged our sample of about 90 GRBs, for which we use the data downloaded from the XRT online catalog and the red-shift taken from Simbad online catalog linked to the recent publications. After this extension, we end up with ≃ 430 bursts with about 30 short bursts.
3.1 The “Boosted Fireball” Model
The “boosted fireball” is a two-parameter, physical and analytical model that is capable of describing the evolution of a GRB's jet, during its afterglow phase.[16] Suppose we have a fireball with energy E and mass M; after the explosion, eventually, the outflow becomes cold and attains its maximum Lorenz factor . If we see the flow in the lab frame, the fireball will be boosted by a boost factor . In the lab frame, the fireball is beamed in the launch direction with the characteristic Lorentz factor and a characteristic jet opening angle . The jet opening angle arises naturally, since it automatically satisfies the causality constraint . This two-parameter model can generate a family of outflows parameterized by η0 and , from the standard spherical fireball (obtained when ) to an ultra-relativistic flow with a narrow jet opening angle in the limit of .
Since the model is not able to describe the flaring activity usually present in the early afterglow phase of Swift LCs, we develop a new technique that tries to get rid of those points that move away from the standard negative power-law trend of the data.
3.2 Data Preparation
The Swift X-ray telescope (XRT) instrument is sensible in the energy range of 0.3–10 keV and it is mainly devoted to the observation and study of the decay of the typical X-ray GRB's afterglow. Since the set parameters used in JetFit is large, to reduce the dimensionality of the fit, we use only those GRBs with known red-shift. Therefore the red-shift and distance luminosity have to be considered as fixed by the observations. For this analysis the count-rate data are used: the LCs are automatically generated and consists of time-binned photon counts with associated uncertainties. Moreover, we use only those data points collected in Photon Counting (PC) mode because the Windowed Timing (WT) mode is usually related to data that could describe the prompt emission phase. Since we have to perform a fit described by eight parameters, it is necessary to deal with LCs with a sufficient number of points. Therefore, to ensure the success of the fit procedure, we limit our discussion to afterglows with at least ten measured points.
The “boosted fireball” model does not describe the possible flaring activity that manifests itself in the LC, so we develop a new analysis procedure that tries to filter this behavior in the data points. The method is described in the Experimental Section.
3.3 Fit with JetFit and the Off-Axis Sub-Sample
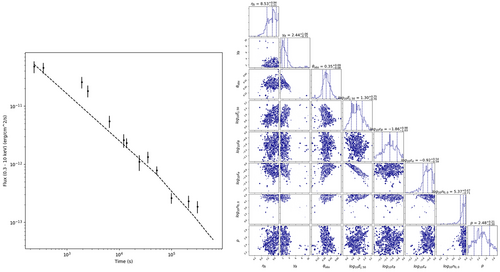
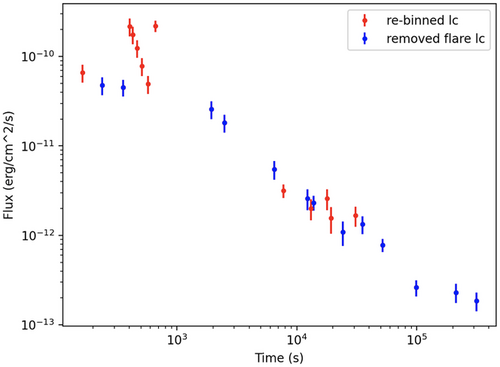
The analysis is performed by applying the JetFit code to the entire sample of GRBs, producing a set of best-fit LCs and distributions of best-fit parameters. The result for GRB131103A can be seen in the left panel of Figure 4 for which we obtain a best-fit LC. This GRB shows a flare in its original BAT LC, so it can be taken as a good example to demonstrate the various steps of our analysis. After we apply our procedure for the re-binning and the removal of the flare, JetFit is applied and a contour plot, showing distributions and errors for the best-fit parameters, can be seen in the right panel of Figure 4. Looking at the contour plot, it is clear that some parameters are not tightly constrained, probably due to the fact that we are using only X-ray data as well as for known model degeneracies.
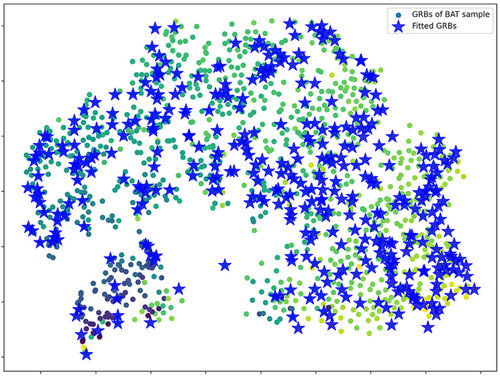
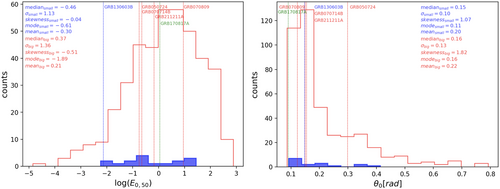
From Figure 5 we can see blue stars that mark those GRBs, from our BAT sample, have been detected by XRT and have a sufficient number of points to be fitted with JetFit. The JetFit sample is uniformly distributed into the two groups, having in the small group 16 GRBs. The distributions of the main parameters from JetFit can be used for a general description of our sample. These parameters represent the dynamical (explosion energy, circumburst density medium, the jet opening angle), the radiation (the electron spectral index, the magnetic energy fraction, the electrons energy fraction) and the observational properties (red-shift, the observer angle) of our selected GRBs. The resulting distributions for the explosion energy and for the jet opening angle can be seen in Figure 6. The events are classified according to the two groups obtained with the t-SNE analysis. As can be observed from the figures, the behavior of the two sub-samples are very similar, showing a related general jet phenomenology. The best-fit values for those GRBs with a kilonova associated are tabulated in Table 1, among with the ones obtained for GRB170817A. The GRBs with an associated kilonova fitted with JetFit are indicated by vertical dashed lines. Only GRB130603B belongs to the small group and, at the same time, has a sufficient number of data points to be fitted with JetFit. Moreover, a green vertical line indicates the values for GRB170817A, even though this GRB was not observed by Swift, and so the values are simply taken from ref. [17] for comparison.
| η0 | θobs | p | ||||||
|---|---|---|---|---|---|---|---|---|
| 050724 | 8.2 | 3.3 | 0.2 | 2.5 | −0.7 | 3.4 | −0.4 | −1.9 |
| 070809 | 7.6 | 8.1 | 0.11 | 2.7 | 0.9 | 2.5 | −0.9 | −1.9 |
| 070714B | 6.1 | 6.6 | 0.04 | 2.4 | −0.6 | 3.6 | −0.3 | −3.2 |
| 130603B | 5.7 | 6.4 | 0.12 | 2.5 | 0.8 | 4.2 | −1.4 | −1.9 |
| 211211A | 5.8 | 6.4 | 0.08 | 2.7 | −0.1 | 1.5 | −0.7 | −2.2 |
| 170817A | 8.0 | 11.6 | 0.47 | 2.154 | 0.04 | −1.4 | −0.65 | −5.9 |
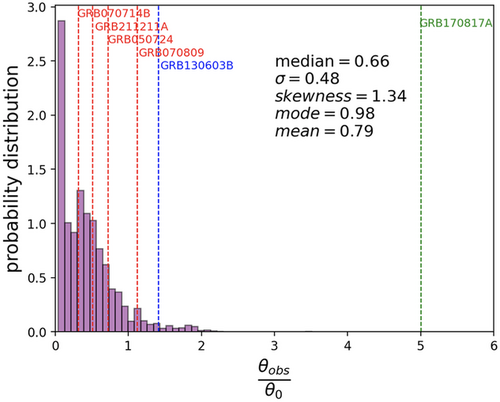
The multi-messenger observation of GRB170817A,[26] a peculiar GRB seen off-axis, has shed light on the problem of the off-axis orientation of the jet. Giving our sample of Swift GRBs, we try to compute the probability to observe a GRB which has a definite jet opening angle. From the probability distribution in Figure 7 we can see that the highest probability to observe a GRB with a definite opening angle is for on-axis GRBs, as expected. About 100 GRBs have but, given the errors in the parameters resulting from the fit, is still compatible with 1. This is not clearly true for GRB170817A that, as can be seen from Figure 7, is greatly seen off-axis.
4 Conclusions
The electromagnetic event that occurred on August 17, 2017, opened to a wide range of questions mainly devoted to understanding the physical origin of GRB170817A. This work has to be included in this context, trying to answer some basic questions related to the modeling of the off-axis emission and the effects of new possible ways of classification.
In this article, a comprehensive study of the Swift-BAT and Swift-XRT data is provided. The prompt data are inspected using an unsupervized machine learning algorithm that is capable of finding morphological similarities in the LCs. The main result of this part of the work is the construction of a new method of classification that tries to overcome the standard T90 duration distinction between long and short GRBs. The analysis, based on the idea developed in ref [12], extends the GRBs sample including the bursts observed in 2020 and confirms that, even if a classification based on the main features of the LCs is possible, a link to the T90 duration is still present. With respect to the two kilonova candidates considered in ref. [12], we also include GRB050724, GRB070809, GRB070714B, GRB080503, and GRB211211A. Of particular interest is the relation between the GRBs with associated kilonova and their relative distances in the classification map: even though they belong to different groups, they are very close among themselves. GRB211211A is the only kilonova GRB that is placeed just in the middle of the big group but, considering the shape of its LC, this is a natural consequence of the application of t-SNE. Despite the limited number of GRBs with a kilonova association, in this analysis we can see a spatial correlation between six out of seven GRBs. The LCs present very similar shapes and, actually, t-SNE preserves this characteristic considering them as neighbors. We then consider another sub-sample: the non-collapsar GRBs taken from ref. [23] We find that the majority of these bursts are placed by t-SNE in the small group, attributing a possible merger origin to all of their neighbors. This could indicate t-SNE as a interesting instrument to investigate the possible origin of a GRB. Adding more and more observed kilonova could increase the impact of this work, in order to understand whether if the considered GRB could have a collapsar or compact merger origin. At this stage, this analysis is unable to clearly group together the GRBs with an associated kilonova, maybe because t-SNE is only looking at similarities in the gamma-ray LCs. Moreover it is not clear what the LC's properties are that influence the most the t-SNE capability of classification and how these features can be linked to the astrophysical aspect of the bursts.
Regarding the afterglow analysis performed making a fit with JetFit code, a set of best-fit parameters, that could describe the LCs, is provided. In fact, the jet opening angle arises naturally, from the boosted Lorentz factor, without making external additions. The best-fit parameter distributions, that represent our sample, could be taken as an average description of the physics of the bursts. The fitted GRBs represent a large sub-sample of the bursts grouped by t-SNE. The study of their afterglow properties with JetFit demonstrates related physical characteristics, being the best-fit parameter distributions of similar shape. The off-axis orientation of the GRBs is one of the main issue that limits our capability of observation and, in our analysis, a not negligible fraction of the sample seems actually seen off-axis. Nevertheless, looking at the probability distribution we find that the highest probability to observe a GRB with a definite opening angle is related to on-axis GRBs, as intuitively expected. The application of JetFit code, and hence of the “boosted fireball” model, produces an average description of the physics of our sample. The analysis is limited by the model itself that is unable to properly constraint some parameters due to known degeneracies. For this reason we are interested in the mean values of best-fit parameter distributions, in order to have a general description of the considered sample. This work indeed can be interpreted as an intermediate step in a wider analysis: the mean values of the best-fit parameter distributions in fact could be used in future works as mean values for the prediction of the high-energy part of GRB's emission models. The mean values of the best-fit parameters, especially the one classified by t-SNE in the small group (and so the ones with a possible merger origin), could be used to construct a mean synchrotron model. The synchrotron spectrum can be then used to predict a synchrotron-self Compton model that could describe the high-energy emission of a GRB's afterglow. This work could give a more realistic choice for the main parameters of the model, because it relies on a general description of Swift bursts and on a robust classification made with t-SNE.
5 Experimental Section
- 1. divided the data points into couples and computed, for each of them, the slope of the line that ideally connected the two points; computed the standard deviation of the slopes distribution
- 2. grouped the slopes, in a way that the flare was contained in one of the groups, and computed the standard deviation of each; removed those groups that move away from the global standard deviation
- 3. finally removed all those slopes that were greater than the standard deviation computed in the second item (the selection criterion depended on the singular GRB case).
After this procedure, it ended up with an LC that presented a smooth behavior and it was ready to be fitted. As can be seen in the example LC contained in Figure 8, the procedure served to remove the flare that can be observed before 103 s and to efficiently re-bin the LC. For the case of GRB131103A it was found that, if the data points were divided into groups of 5 and the selection was fixed as 1 sigma, the initial flare was removed from the LC. The analysis strongly depended upon the binning, and hence the total number of groups, that can be choosen for an LC. This parameter was defined by looking at the data of the original LC and it was crucial for the isolation of the flare. Different binning lead to different resulting LCs and the capability of eliminating the flares depended on this value.
Acknowledgements
This work used the data supplied by the UK Swift Science Data Centre at the University of Leicester. This research also made use of the SIMBAD database, operated at CDS, Strasbourg, France. The authors thank all the Perugia multi-messenger group, for the useful and fruitful discussions.
Open access funding provided by Universita degli Studi di Perugia within the CRUI-CARE Agreement.
Conflict of Interest
The authors declare no conflict of interest.
Open Research
Data Availability Statement
The data that support the findings of this study are openly available in The Swift/BAT Gamma-Ray Burst Catalog at https://swift.gsfc.nasa.gov/results/batgrbcat/, reference number 1.


