Dyssynchronous heart failure models in canines: New insights into electrocardiographic, echocardiographic and histological features
Han Jin, Shengwen Yang, and Hao Huang contributed equally to the study.
Funding Inormation
This work was financially supported by National Natural Science Foundation of China (Nos. 82000325, 82100325, 82070349), Young Elite Scientists Sponsorship Program by Beijing Association for Science and Technology (No. BYESS2023392), The Beijing Gold-bridge project (No. ZZ21055), The Peking University First Hospital Seed Foundation (No. 2020SF19), and High-level hospital clinical research funding of Fuwai Hospital, Chinese Academy of Medical Sciences (No. 2022-GSP-GG-11).
Abstract
Background
We investigated the similarities and differences between two experimental approaches using tachy-pacing technology to induce desynchronized heart failure in canines.
Methods
A total of eight dogs were included in the experiment, four were tachy-paced in right ventricle apex (RVAP) and 4 were paced in right atrium after the ablation of left bundle branch to achieve left bundle branch block (RAP+LBBB). Three weeks of follow-up were conducted to observe the changes in cardiac function and myocardial staining was performed at the end of the experiment.
Results
Both experimental approaches successfully established heart failure with reduced ejection fraction models, with similar trends in declining cardiac function. The RAP+LBBB group exhibited a prolonged overall ventricular activation time, delayed left ventricular activation, and lesser impact on the right ventricle. The RVAP approach led to a reduction in overall right ventricular compliance and right ventricular enlargement. The RAP+LBBB group exhibited significant reductions in left heart compliance (LVGLS, %: RAP+LBBB −12.60 ± 0.12 to −5.93 ± 1.25; RVAP −13.28 ± 0.62 to −8.05 ± 0.63, p = 0.023; LASct, %: RAP+LBBB −15.75 ± 6.85 to −1.50 ± 1.00; RVAP −15.75 ± 2.87 to −10.05 ± 6.16, p = 0.035). Histological examination revealed more pronounced fibrosis in the left ventricular wall and left atrium in the RAP+LBBB group while the RVAP group showed more prominent fibrosis in the right ventricular myocardium.
Conclusion
Both approaches establish HFrEF models with comparable trends. The RVAP group shows impaired right ventricular function, while the RAP+LBBB group exhibits more severe decreased compliance and fibrosis in left ventricle.
1 INTRODUCTION
Chronic heart failure (HF) represents a major group of diseases that pose a significant threat to human health.1 Dyssynchronous heart failure refers to a condition where the coordinated contraction of the heart's chambers, particularly the left and right ventricles, is disrupted. In a healthy heart, these chambers contract in synchrony to efficiently pump blood throughout the body. However, in dyssynchronous heart failure, there is a lack of coordination in the timing of contractions, leading to decreased cardiac efficiency and compromised pumping function. This condition is often associated with conduction system abnormalities, such as left bundle branch block (LBBB). LBBB is a delay or blockage in the electrical signal along the left bundle branch, causing the left ventricle to contract later than the right ventricle. Dyssynchronous heart failure is a significant concern as it can exacerbate symptoms and worsen outcomes for individuals with heart failure.
The consequences of dyssynchrony include decreased cardiac output, impaired exercise tolerance, and an increased risk of arrhythmias. For patients with heart failure, the identification and management of dyssynchrony are crucial for improving overall cardiac function and quality of life.
Dyssynchrony often indicates that additional interventions such as resynchronization therapy are required.2 The maintenance of cardiac pump function relies on the synchrony between the ventricles and the intraventricular conduction system, with the Purkinje system playing a crucial role in this regard.3 Under pathological conditions, slow impulse conduction leads to significant temporal disparities between the electrical activity and contraction within and between the ventricles, resulting in dyssynchrony.4
There are two main clinical scenarios that can directly lead to the occurrence of dyssynchronous HF: prolonged LBBB and pacemaker dependency at the right ventricle apex.5 In both cases, patients exhibit a wide QRS complex on the electrocardiogram (ECG), often accompanied by notching.6 Although both conditions manifest as electrical dyssynchrony, characterized by a specific QRS complex, the precise development characteristics of HF and the differences in the resulting decline in cardiac function caused by these two scenarios are still unclear.7
This study constructed animal models of dyssynchronous HF based on the two aforementioned scenarios, by using the tachy-pacing technology. We collected electrocardiographic data and assessed changes in cardiac function using speckle tracking echocardiography. Additionally, we examined the histopathological features in both groups. Through a comprehensive analysis of the differences between the two model groups, we aimed to investigate the characteristics of dyssynchronous HF.
2 METHODS
Eight adult beagle dogs of either sex, weighing 12–15 kg, were included in the study. Animal preparations, the operative instruments and the following strategy were as previously described.8 All experimental procedures strictly adhered to institutional and national guidelines for the care and use of laboratory animals, and the study protocol was reviewed and approved by the Ethical Committee of the Animal Experimental Center in the State Key Laboratory of Cardiovascular Disease and Fuwai Hospital (ethical approval number: 0077-3-40-GZ(X)).
2.1 Pacing procedure
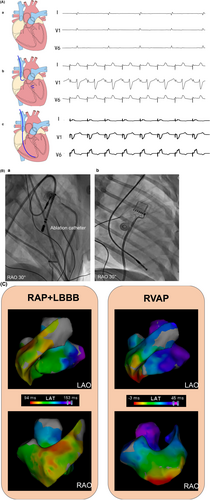
A ventricular pacing lead (Model 5076-58 cm, Medtronic, Minneapolis, MN, USA) was implanted in the right ventricular apex, and a specialized single-chamber rapid pacing device (QINMING 000038SSI, China) for rapid pacing was connected with programming settings of VOO 200 ppm. These four canines were referred to as the RVAP dyssynchronous group. The remaining four animals were paced from the right atrium, with one lead (Model 5076-52 cm, Medtronic, Minneapolis, MN, USA) implanted in the right atrium, followed by left bundle branch (LBB) ablation, as performed in our previous work.9 Lastly, the lead was connected to the same specialized single-chamber pacemaker with programming set to AOO 200 ppm and this dyssynchronous group was RAP+LBBB (Figures 1 and 2).

2.2 Electrocardiogram and acute electrical activation mapping
We continuously recorded 12-lead electrocardiogram (ECG) with the multichannel electrophysiological recording system (GE CardioLab EP Recording system) (200 mm/s sweep speed). The QRS duration (QRSd) during RVAP was measured from the onset of the stimulus artifact to the end of QRS.10 The native QRS duration and LBB-QRS duration was measured from the QRS onset to the last QRS deflection. The left ventricular (LV) and right ventricular (RV) endocardial mappings were performed during RVAP and RAP+LBBB. Global LV and RV electrical activation was mapped using contact force catheters (Thermocool SmartTouch, Biosense Webster, Inc.).
2.3 Echocardiographic examination
Echocardiographic examinations were performed using a Vivid E95 ultrasonography system (GE Medical Systems, Horten, Norway). Dynamic two-dimensional (2D) images were captured over four consecutive heartbeats from three apical views (four-chamber, two-chamber, and three-chamber) for LV and left atrial (LA) studies. The apical 4-chamber view, focused on the right ventricle, was collected for RV study. Frame rates were ≥55 frames/s for grayscale imaging.
LV end-systolic and end-diastolic volumes were measured, and left ventricular ejection fraction (LVEF) was calculated using the biplane Simpson's method.11 Peak early-diastolic (E) and peak late-diastolic (A) transmitral velocities, as well as the E/A ratio, were measured using pulsed Doppler echocardiography. The e' value represented the average of septal and lateral annular velocities, as determined by tissue Doppler, which was then used to generate the E/e′ ratio. The severity of mitral and tricuspid regurgitation was assessed using Doppler quantitative techniques, following the ASE guideline.12
2.4 Two-dimensional speckle-tracking echocardiography (2D-STE)
The 2D images were analyzed using offline workstation (EchoPAC clinical workstation software, version 203, GE Healthcare). LV global longitudinal strain (LVGLS), RV free wall strain (RVFWS) and RV global longitudinal strain (RVGLS) were measured as peak systolic strains, with the mean value of wall segments reported according to the EACVI/ASE recommendations.13 LA strain was calculated as LA reservoir strain (LASr), LA conduit strain (LAScd), and LA contraction strain (LASct), representing the LA strain during the reservoir, conduit, and contraction phases, respectively. Mechanical dispersion (peak strain dispersion, PSD) was used for the synchronization evaluation. All echocardiographic measurements and analyses were the average of three consecutive cycles.
2.5 Follow-up
Twelve-lead ECG, echocardiography, pacing parameters, and procedure-related complications were recorded during the 3-week follow-up. Subsequently, the chest was longitudinally incised along the left margin of the sternum in dogs, and the heart tissue was rapidly extracted. The extracted tissue was washed with physiological saline to remove blood and fat tissue. The left atrium, left ventricle, and interventricular septum were dissected on ice and fixed in 4% paraformaldehyde solution for one week. Routine paraffin embedding was performed, and tissue sections with a thickness of 4 μm were obtained using a microtome. The sections were stained with hematoxylin and eosin (HE) and Masson's trichrome stain. Under a light microscope, we observed the pathological morphological changes in various parts of the myocardium and the degree of myocardial tissue fibrosis.
2.6 Statistical analysis
The normally distributed quantitative data were presented as means ± SD. Paired t tests were used to analyze the echocardiographic parameters before and after pacing, and independent t tests were used for between-group statistical analysis. A significance level of p < 0.05 was considered statistically significant. Statistical analysis was performed using SPSS 22.0 software (IBM Corporation, USA).
3 RESULTS
3.1 ECG and acute electrical characteristics
Table 1 summarized the ECG durations and electrical activation times. The RVAP-QRSd (92.0 ± 4.3 vs. 45.0 ± 2.6 ms, p < 0.001) and RAP+LBBB-QRSd (101.5 ± 5.0 vs. 46.0 ± 1.6 ms, p < 0.001) were significantly longer than that at baseline. The RAP+LBBB-QRSd (101.5 ± 5.0 ms) also significantly longer than RVAP-QRSd (92.0 ± 4.3 ms, p = 0.028).
| RAP+LBBB | RVAP | p value | |||
|---|---|---|---|---|---|
| Baseline | 3 Weeks | Baseline | 3 Weeks | ||
| ECG and acute electrical characteristics | |||||
| QRSd, ms | 46.0 ± 1.6 | 101.5 ± 5.0 | 45.0 ± 2.6 | 92.0 ± 4.3 | 0.028 |
| RV activation time, ms | 26.0 ± 1.6 | 36.8 ± 2.8 | 0.001 | ||
| LV activation time, ms | 40.3 ± 2.1 | 24.8 ± 2.8 | <0.001 | ||
| Global activation time, ms | 55.3 ± 3.0 | 44.0 ± 3.7 | 0.003 | ||
- Note: p value: RAP+LBBB 3 weeks versus RVAP 3 weeks.
- Abbreviations: ECG, electrocardiogram; LBBB, left bundle branch block; LV, left ventricular; RAP, right atrial pacing; RV, right ventricular; RVAP, right ventricle apex pacing.
During RVAP, the RV apex wall was activated earliest, followed by the RV and LV septum and then the LV lateral wall. While RAP+LBBB resulted in a rapid spread of RV activation, followed by slow activation from LV septum to the LV lateral wall (Figure 2C and Supplementary Movies). The RVAP showed a significantly longer global RV activation time than RAP+LBBB (36.8 ± 2.8 vs. 26.0 ± 1.6 ms, p = 0.001). However, the global LV activation time were shorter in RVAP than RAP+LBBB (24.8 ± 2.8 vs. 40.3 ± 2.1 ms, p < 0.001). In addition, the global RV and LV electrical activation time in RAP+LBBB was significantly longer than RVAP (55.3 ± 3.0 vs. 44.0 ± 3.7 ms, p = 0.003).
3.2 Conventional echocardiographic and 2D-STE parameters
Conventional echocardiographic and 2D-STE data at baseline and at the 1-week and 3-week follow-ups are summarized in Table 2, where both groups exhibited a decrease in the most important parameter, LVEF (LVEF, %: RAP+LBBB 57.00 ± 1.63 to 30.00 ± 8.12; RVAP 53.25 ± 3.59 to 30.75 ± 4.03, p = 0.874).
| RAP+LBBB | RVAP | p value | |||||
|---|---|---|---|---|---|---|---|
| Baseline | 1 Weeks | 3 Weeks | Baseline | 1 Weeks | 3 Weeks | ||
| Tricuspid regurgitation | 0 ± 0 | 0 ± 0 | 1.25 ± 1.26 | 0.5 ± 0.58 | 1 ± 0.58 | 3 ± 0 | 0.032 |
| Mitral regurgitation | 0 ± 0 | 0 ± 0 | 1 ± 0 | 0 ± 0 | 1 ± 0.57 | 2 ± 0 | – |
| Mitral E/A ratio | 1.97 ± 0.46 | 1.68 ± 0.28 | 1.61 ± 0.44 | 1.26 ± 0.22 | 2.39 ± 0.74 | 1.25 ± 0.49 | 0.318 |
| E/e′ mean | 8.72 ± 0.78 | 7.85 ± 0.37 | 7.39 ± 1.48 | 9.62 ± 0.66 | 11.88 ± 0.88 | 10.03 ± 1.29 | 0.036 |
| RVGLS, % | −14.80 ± 0.69 | −12.23 ± 1.08 | −11.03 ± 1.53 | −17.65 ± 4.09 | −10.33 ± 0.59 | −6.88 ± 0.65 | 0.002 |
| RVFWS, % | −15.03 ± 2.18 | −13.65 ± 1.47 | −9.95 ± 0.86 | −20.30 ± 6.47 | −11.68 ± 0.97 | −6.53 ± 1.34 | 0.005 |
| RVFAC, % | 45.00 ± 0.82 | 41.00 ± 0.71 | 38.75 ± 3.30 | 47.00 ± 2.45 | 36.50 ± 1.19 | 29.50 ± 3.70 | 0.010 |
| RVD, mm | 17.75 ± 1.26 | 18.25 ± 0.25 | 19.50 ± 2.08 | 16.50 ± 1.29 | 21.25 ± 1.70 | 23.00 ± 1.16 | 0.026 |
| LASr, % | 26.00 ± 6.98 | 16 ± 5.15 | 7.75 ± 2.75 | 28.50 ± 3.00 | 26.25 ± 4.05 | 15.50 ± 6.66 | 0.075 |
| LAScd, % | −14.75 ± 3.78 | −10.75 ± 2.87 | −6.75 ± 4.43 | −23.75 ± 2.63 | −12.25 ± 2.14 | −5.50 ± 3.87 | 0.686 |
| LASct, % | −15.75 ± 6.85 | −5.00 ± 2.45 | −1.50 ± 1.00 | −15.75 ± 2.87 | −15.25 ± 3.84 | −10.00 ± 6.16 | 0.035 |
| PSD, ms | 40.50 ± 4.20 | 53.00 ± 5.55 | 63.25 ± 17.42 | 43.25 ± 9.22 | 70.50 ± 18.91 | 61.25 ± 23.00 | 0.894 |
| LVGLS, % | −12.60 ± 0.12 | −5.93 ± 1.25 | −10.45 ± 1.00 | −13.28 ± 0.62 | −9.93 ± 0.99 | −8.05 ± 0.63 | 0.023 |
| LVEDV, mL | 30.25 ± 6.45 | 32.00 ± 2.12 | 35.00 ± 6.73 | 29.50 ± 3.70 | 38.25 ± 2.78 | 41.50 ± 6.45 | 0.213 |
| LVESV, mL | 13.00 ± 2.45 | 18.50 ± 1.76 | 25.25 ± 7.93 | 14.00 ± 0.82 | 22.75 ± 2.23 | 28.75 ± 2.87 | 0.438 |
| LVEF, % | 57.00 ± 1.63 | 43.25 ± 1.93 | 30.00 ± 8.12 | 53.25 ± 3.59 | 41.50 ± 2.10 | 30.75 ± 4.03 | 0.874 |
- Note: p value: RAP+LBBB 3 weeks versus RVAP 3 weeks.
- Abbreviations: LAScd, left atrial conduit strain; LASct, left atrial contraction strain; LASr, LA reservoir strain; LBBB, left bundle branch block; LVEDV, left ventricular end-diastolic volume; LVEF, left ventricular ejection fraction; LVESV, left ventricular end-systolic volume; LVGLS, left ventricular global longitudinal strain; PSD, peak strain dispersion; RAP, right atrial pacing; RVAP, right ventricle apex pacing; RVD, right ventricular diameter; RVFAC, right ventricular fractional area Change; RVFWS, right ventricular free wall strain; RVGLS, right ventricular global longitudinal strain.
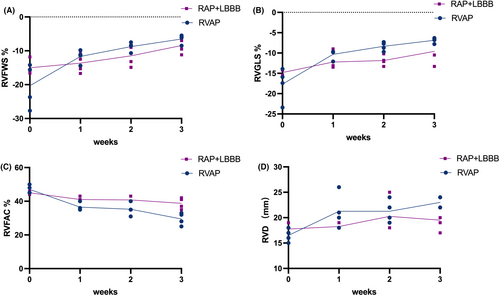
As shown in Figure 3, compared to the RAP+LBBB group, in the RVAP group we observed a significant downward trend in the right ventricular compliance: RV function declined (RVFWS, %: RVAP 20.30 ± 6.47 to −6.53 ± 1.34; RAP+LBBB 15.03 ± 2.18 to −9.95 ± 0.86, p = 0.005, Figure 3A; RVGLS, %: RVAP −17.65 ± 4.09 to −6.88 ± 0.65; RAP+LBBB −14.80 ± 0.69 to −11.03 ± 1.53, p = 0.002, Figure 3B; RV-FAC, %: RVAP 47.00 ± 2.45 to 29.50 ± 3.70; RAP+LBBB 45.00 ± 0.82 to 38.75 ± 3.30, p = 0.010, Figure 3C) and RV enlarged (RVD, mm: RVAP 16.50 ± 1.29 to 23.00 ± 1.16; RAP+LBBB 17.75 ± 1.26 to 19.50 ± 2.08, p = 0.026, Figure 3D). As in the example shown in Figure 4, a significant reduction in RV longitudinal strain parameters were observed in RVAP (Figure 4A,B). For RAP+LBBB, the RV longitudinal strain parameters seemed less reduced (Figure 4C,D). Meanwhile, the RVAP group showed a severe tricuspid regurgitation as right ventricular function declined (Severe TR vs. Mild TR, Figure 4E).
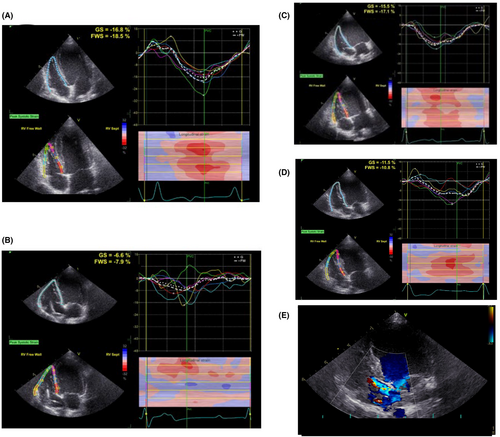
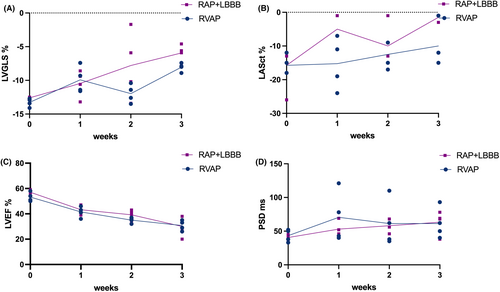
On the other hand, as shown in Figure 5, in comparison to the RVAP group, the RAP+LBBB group exhibited a more significant decrease in left heart compliance, including overall LV compliance (LVGLS, %: RAP+LBBB −12.60 ± 0.12 to −5.93 ± 1.25; RVAP −13.28 ± 0.62 to −8.05 ± 0.63, p = 0.023, Figure 5A) and LA compliance (LASct, %: RAP+LBBB −15.75 ± 6.85 to −1.50 ± 1.00; RVAP −15.75 ± 2.87 to −10.05 ± 6.16, p = 0.035, Figure 5B). Further,both the two groups showed a trend towards a decline in LVEF values and mechanical dispersion. However, there were no statistically significant differences observed between the two groups (Figure 5C,D). In the example shown in Figure 6, the dog with RAP+LBBP had a more significant reduction in LVGLS (Figure 6A,B), compared to the dog with RVAP (Figure 6C,D).

3.3 Histological examination of myocardial tissue
The RAP+LBBB group exhibited more pronounced fibrosis in the left ventricular wall, and left atrium compared to the control group, while the RVAP group showed more prominent fibrosis in the right ventricular myocardium compared to the RAP+LBBB group (Figure 7).
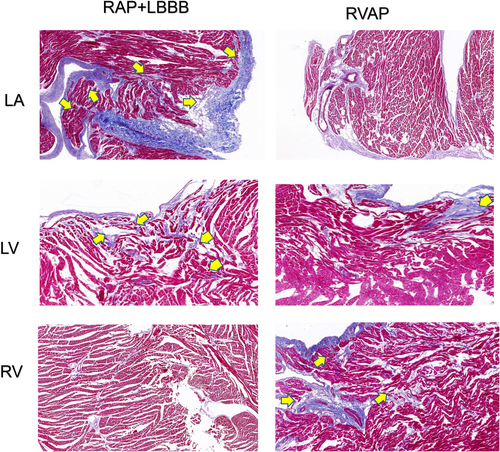
 : The portion indicated by the arrow exhibits a higher degree of fibrosis. LA, left atrium; LBBB, left bundle branch block; LV, left ventricle; RAP, right atrial pacing; RV, right ventricle; RVAP, right ventricle apex pacing.
4 DISCUSSION
Overall, both the experimental and control groups achieved HFrEF within the designated time frame. In the RVAP group, we observed a greater degree of right ventricular remodeling, decreased overall right ventricular compliance, and increased tricuspid regurgitation. The left ventricular function exhibited a continuous decline. In the RAP+LBBB group, there was a lower overall ventricular wall compliance in the left ventricle and suspected decreased compliance in the left atrium, with minimal impact on the right heart. In terms of the sequence and timing of excitation, the electroexcitation in the RVAP pattern exhibits a delayed right ventricular activation, while in the RAP+LBBB group, the left ventricular electroexcitation is delayed, and overall ventricular excitation is predominantly delayed. Consequently, corresponding to RVAP, there is a decline in cardiac function, myocardial alterations, and fibrosis predominantly affecting the right side, whereas in RAP+LBBB, the left side is predominantly affected.
The method of using rapid pacing combined with LBB ablation to induce LBBB is a commonly used experimental approach for constructing models of dyssynchronous heart failure and studying the mechanisms underlying this type of heart failure. Chakir et al.14 first reported the use of AOO pacing combined with LBBB to create a canine model of dyssynchronous heart failure. Similar studies using a canine heart model to create dyssynchronous heart failure through rapid pacing combined with LBB ablation have been conducted by several researchers.4, 15-17 However, these studies have limitations, including the predominantly surgical implantation of epicardial pacing leads for rapid pacing, and the provision of only basic echocardiographic data without the use of advanced techniques such as three-dimensional strain imaging and speckle tracking, which can assess conduction delays and ventricular strain indices. In this experiment, we constructed two models of rapid endocardial pacing-induced heart failure and compared the effects of these two methods on left and right ventricular function using a combination of echocardiographic data and three-dimensional activation mapping. Additionally, we assessed the degree of myocardial fibrosis through staining, which is a novel aspect within the field of dyssynchronous heart failure research.
As the results, both groups achieved HFrEF at 3 weeks, and there seemed to be no significant differences in the speed and trend of deterioration. Possible reasons for this include: (1) Overall cardiac function being more influenced by heart rate, despite the different pacing sites between the two groups. The differences in overall conduction might not be significant, especially under the condition of rapid pacing close to 200 beats per minute in dogs with relatively small hearts. (2) The deterioration of right ventricular function in the RVAP group contributed to the decline in left ventricular function, resulting in a similar trend of LVEF reduction as in the RAP+LBBB group.18, 19
The characteristics observed in the right ventricular pacing group include: (1) decreased right ventricular function; (2) increased tricuspid regurgitation; (3) narrower QRS complex on the overall electrocardiogram, indicating a potentially faster left ventricular activation compared to the experimental group. Delayed activation in the left ventricular free wall leads to delayed ventricular electrical and mechanical activities, mitochondrial variations, and regressive fibrosis, contributing to decreased left ventricular function possibly due to inadequate systolic and diastolic filling caused by increased heart rate. Considering the uniqueness of the canine conduction system, apical pacing may have paced the right bundle branch, resulting in impulse conduction through the conduction system. This possibility should be taken into account.20
In the RAP+LBBB group, the contradictory wall motion of the ventricular walls appeared from the beginning and continued throughout the experiment, while the right ventricle may not have been affected. In this situation, we observed a wider QRS complex compared to the RVAP group, which can be attributed to the delayed LV activation. The LV movement demonstrated significant delay and dyssynchrony from the beginning, accompanied by wall motion abnormalities. The early activated regions exhibited thinner walls, while the regions activated later contracted to withstand higher wall stress, resulting in relative wall thickening and left ventricular dilation. Extensive delay in the lateral wall may respond well to cardiac resynchronization therapy (CRT) treatment.21 The impact on the left atrium may be attributed to the greater degree of left ventricular wall motion dyssynchrony, leading to increased wall filling pressure and subsequently increased left atrial pressure, which, to some extent, increases the risk of atrial fibrillation (as observed in one dog).22
The establishment of these two animal models in this study can, to some extent, help us understand the occurrence and progression characteristics of two specific diseases in clinical practice: LBBB-induced cardiomyopathy, as well as pacing-induced cardiomyopathy. By revealing the distinctive features of these two conditions characterized by dysynchrony, this study contributes to the advancement of resynchronization therapy for heart failure. This includes the implementation of CRT and more physiologically based techniques such as His bundle pacing and left bundle branch pacing. Furthermore, understanding the specific characteristics and patterns of conduction abnormalities, as well as the associated structural changes such as fibrosis, can guide the selection of patients who are most likely to benefit from resynchronization therapy. It allows for a more personalized and targeted approach, ensuring that the therapy is applied to those who will derive the greatest benefit.
There are limitations to our study. Firstly, the number of animals was limited, the limited number of dogs in the study may have resulted in a higher likelihood of false-negative conclusions. Secondly, no atrial leads were placed in the ventricular pacing group, and no ventricular leads were placed in the atrial pacing group, resulting in inconsistent lead distribution within the cardiac chambers. Thirdly, our method of creating dyssynchrony models may not fully replicate the mechanisms underlying clinical dyssynchronous heart failure. For example, the mechanical disruption of the left bundle branch may not completely reflect the diffuse left bundle branch injury and left bundle branch block seen in chronic heart failure progression. The establishment of a right ventricular tachypacing model may involve factors of atrioventricular dyssynchrony, which also contribute to the progression of heart failure. Lastly, the use of a 200 ppm tachy-pacing method may potentially enhance the role of tachycardia in the deterioration of cardiac function, which is inconsistent with the progression of pacing-induced cardiomyopathy and isolated LBBB leading to heart failure observed in clinical practice.
5 CONCLUSION
Both experimental approaches can effectively established HFrEF models in a short time frame, with comparable trends in cardiac function decline. In the RVAP group, while the left ventricular function declines, the overall conduction in the right ventricle also becomes slower, leading to right ventricular enlargement, decreased ventricular wall strain, and increased myocardial fibrosis. On the other hand, in the RAP+LBBB group, both left ventricular and overall conduction are slower. Alongside the decline in left ventricular function, the extent of fibrosis is more pronounced, while the right ventricle is relatively less affected.
AUTHOR CONTRIBUTIONS
J.H., H.Y.R. initiated and designed the research. J.H., H.Y.R., H.P.K., W.S.X. and C.S.J. developed animal model. H.H., Y.S.W. and L.H. conducted analysis of echocardiographic indicators and examined stained tissue slices. J.H., G.M. and N.H.X. analyzed and interpreted the data. J.H. and H.W. wrote and revise the article. L.Y., W.X.W., and J.H. finally submitted the paper.
ACKNOWLEDGMENTS
None.
CONFLICT OF INTEREST STATEMENT
The authors declare that they have no conflict of interest.
ETHICS STATEMENT
The animal disposal and research protocols were approved by the Ethical Committee of the Animal Experimental Center in the State Key Laboratory of Cardiovascular Disease and Fuwai Hospital (approval ethical number: 0077-3-40-GZ(X)). All experiments were performed in compliance with Guide for the Care and Use of Laboratory Animals.
Open Research
DATA AVAILABILITY STATEMENT
The original data for this study can be accessed by the interested parties after contacting authors via the email address: [email protected].


