Growth Charts for Children With Beckwith–Wiedemann Spectrum
Funding: This work was partially supported by the Lorenzo “Turtle” Sartini Jr. Endowed Chair in Beckwith-Wiedemann Syndrome Research, and the Victoria Fertitta Fund through the Lorenzo “Turtle” Sartini Jr. Endowed Chair in Beckwith-Wiedemann Syndrome Research (JMK). LAM was supported by a grant of the Emma Children's Hospital Foundation (WAR2017-24) and by funds of the academic education and research sector plans of the Dutch Ministry of Education, Culture and Science.
Saskia M. Maas and Peter Lauffer contributed equally to this study.
Leonie A. Menke and Jennifer M. Kalish contributed equally to this study.
ABSTRACT
Beckwith–Wiedemann spectrum (BWSp) is an overgrowth disorder caused by (epi)genetic alterations in chromosome 11p15. This study aimed to develop BWSp-specific growth charts and explore genotype/phenotype correlations with respect to growth. Heights, weights, and head circumferences were retrospectively collected from 581 individuals with BWSp from the Netherlands, Italy, and the United States. The Generalized Additive Models for Location, Scale, and Shape (GAMLSS) method was employed to develop the following charts: height-for-age, weight-for-age, BMI-for-age, and head circumference-for-age for males and females. Mean height, weight, and head circumference were compared with those of the growth charts generated by the World Health Organization (WHO). Individuals with BWSp show enhanced growth rate during puberty and adolescence, and all growth parameters were increased compared to WHO charts. Mean modeled height at 18 years of age was 180.6 cm for males and 166.3 cm for females (+0.6 SDS and +0.5 SDS, respectively, compared to WHO charts). In conclusion, these growth charts offer valuable insights into the growth patterns in BWSp individuals and provide a key tool for personalized medical care for individuals with BWSp.
1 Introduction
Beckwith–Wiedemann syndrome (BWS; OMIM #130650) is an overgrowth disorder primarily characterized by macrosomia, macroglossia, and abdominal wall defects. Clinical diagnosis is based on a clinical scoring system and the variability in phenotype has led to the recent introduction of the term Beckwith–Wiedemann spectrum (BWSp) (Brioude et al. 2018). Approximately 80%–85% of clinically diagnosed individuals exhibit (epi)genetic aberrations in imprinting center regions 1 (IC1) and 2 (IC2) on chromosome 11p15, affecting the expression of monoallelically expressed (imprinted) genes. The main molecular subtypes are loss of methylation at KCNQ1OT1:TSS-DMR (IC2-LOM; approximately 50% of cases), gain of methylation at H19/IGF2:IG-DMR (IC1-GOM; 5%–10% of cases), and paternal uniparental isodisomy of chromosome 11 (patUPD11; approximately 20% of cases). A smaller number of individuals have intragenic pathogenic variants in the CDKN1C gene (Brioude et al. 2018).
Pre- and postnatal overgrowth occurs in 45%–65% of individuals with BWSp (Wang et al. 2019). Postnatal growth is in the middle to upper percentiles but is described to slow in late childhood (Shuman et al. 1993). Therefore, adult height is often a concern for parents.
In pediatric healthcare, growth charts derived from healthy children and adolescents serve as crucial tools for healthcare professionals, facilitating the evaluation of a child's growth in both preventive and clinical settings. Additionally, growth charts have been developed for various genetic syndromes, for example, Turner syndrome or Marfan syndrome, offering healthcare professionals the means to plot an individual's growth data and make meaningful comparisons with individuals sharing the same syndrome (Lauffer et al. 2023; Rongen-Westerlaken et al. 1997). These specialized (syndrome-specific) growth charts play an important role in detecting aberrant growth patterns and are instrumental in providing patients and parents with insights into anticipated future growth, including adult height prediction. Currently, there are no syndrome-specific growth charts available for BWSp up until adulthood, and to date, limited data on adult height outcomes have been reported. Brioude et al. published the largest cohort of 407 individuals with BWSp with available data on adult height (Brioude et al. 2018). Compared with the French reference population, mean adult height was +1.8 standard deviation score (SDS) and 51.4% of the individuals with BWSp reached an adult height above +2.0 SDS (Brioude et al. 2013). Mean adult height was highest in the IC1-GOM group (2.8 ± 1.4 SDS) followed by CDKN1C variants (2.0 ± 1.6 SDS), IC2-LOM (1.7 ± 1.2 SDS), and the patUPD11 group (1.0 ± 1.8 SDS).
Thus far, two studies have developed BWSp growth charts. Mussa et al. developed fetal growth charts using growth data of 89 fetuses with BWSp, showing that all four molecular BWSp subgroups had a birth weight SDS and length SDS significantly higher than the general population (Mussa et al. 2016). Choi et al. developed growth charts using growth data of 51 Korean children with BWSp from 1 year up until 12.5 years of age (Choi et al. 2024). Compared with the reference population, males with BWSp exhibited greater mean height at all ages, whereas females showed a greater mean height only before the age of 7 years.
To optimize care for individuals with BWSp, the goal of this study was to develop BWSp specific growth charts for children aged 0–18 years. Additionally, we sought to explore (epi)genotype-phenotype differences with respect to growth.
2 Materials and Methods
2.1 Editorial Policies and Ethical Considerations
Clinical data from the Children's Hospital of Philadelphia were collected under exempt IRB protocol IRB 19-016459. Informed consent was not necessary as all data were anonymized prior to analysis and were collected by the physicians of the included individuals with BWSp.
2.2 Data Collection
Longitudinal heights, weights, and head circumferences of individuals with BWSp, measured at age 0–18 years, were retrospectively collected from all individuals with BWSp known to the Amsterdam UMC BWSp expertise clinic, from the BWSp Clinical Unit of the Regina Margherita Children Hospital of Torino and the Rare Diseases Unit of the S. Orsola-Malpighi Hospital in Bologna (Italy), and the BWS Program at the Children's Hospital of Philadelphia. Individuals with a molecularly confirmed diagnosis of BWSp, meeting the criteria of BWSp International Consensus Guidelines, were included in the study (Brioude et al. 2018). Exclusion criteria were preterm birth (before 32 weeks of gestation) and/or a birth weight below 1500 g, as extremely premature and very low birth weight may affect subsequent growth patterns (Hollanders et al. 2017). Growth data were included if a minimum of 3 months had passed since the prior measurements. Other information that was collected included birth year and month, sex, and genetic subgroup. An age correction was applied to children who were born prematurely (between 32 and 37 weeks of gestation) to account for developmental variations due to their gestational age. Age correction was computed by subtracting the number of weeks a child was born prematurely from their chronological age, for measurements below 2 years of age.
Growth parameters were measured by a healthcare provider. Height (cm) was measured in the supine position until 24 months of age; from 24 months of age, height (cm) was measured in the standing position using a precision stadiometer. If asymmetric growth was reported, the measurement of the shorter leg (expected to be the normal leg) was included in the data. Weight (kg) was measured using a digital scale. Head circumference (cm) was measured using a centimeter band.
2.3 Statistical Analysis
To ensure data quality, we conducted growth data curation by generating height-for-age and weight-for-age charts for each individual, which we reviewed for inconsistencies. We employed the Generalized Additive Models for Location, Scale, and Shape (GAMLSS) method, implemented in R as the GAMLSS package (Rigby and Stasinopoulos 2005), for growth chart modeling. Specifically, we utilized the untruncated Box–Cox t distribution, a continuous distribution characterized by four parameters encompassing the median (50th percentile), variation, skewness, and kurtosis. These parameters were allowed to vary with age through the use of p-splines (Stasinopoulos and Rigby 2007). All modeling procedures were carried out in R (version 4.2.2). Data for males and females were analyzed separately. Our analysis resulted in the creation of growth charts for height-for-age, weight-for-age, BMI-for-age, and head circumference-for-age, each of which was fitted with standard deviation score lines corresponding to the 2.3th (−2 SDS), 15.9th (−1 SDS), 50th (0 SDS), 84.1th (+1 SDS), and 97.7th (+2 SDS) percentiles. The World Health Organization (WHO) charts were used as reference data (de Onis et al. 2007) for visualization. The BWSp growth charts were modeled in the same way as was done for the WHO child growth standards, with breaks in longitudinal and BMI models at ages 2 and 5 years, and a break in the weight models at age 2 (de Onis et al. 2007).
Given the limited data available for each BWSp subtype, we were unable to analyze the subtypes individually. Therefore, we combined all data for analysis. To understand the impact of genotype, we incorporated it as a variable in separate GAMLSS models for height-for-age, weight-for-age, and head circumference-for-age. For this analysis, IC2-LOM was set as the reference level.
The impact of country of origin, a proxy variable of ethnicity, was also investigated by incorporating it as a variable in separate GAMLSS models for height-for-age, weight-for-age, and head circumference-for-age. For this analysis, the United States was set as the reference level.
3 Results
Table 1 shows the characteristics of the included individuals and data of the BWSp cohort. A total of 3107 height measurements, 3414 weight measurements, and 1401 head circumference measurements were analyzed. The distribution of the country of investigation and BWSp subtypes of this cohort are given in Table 1. Growth parameters at birth and age 18 years are shown in Table 2.
| Total | Males | Females | |
|---|---|---|---|
| Number of individuals | 581 | 261 | 320 |
| Country of investigation | |||
| United States (% of total) | 294 (51%) | 120 (46%) | 174 (54%) |
| Netherlands (% of total) | 209 (36%) | 102 (39%) | 107 (33%) |
| Italy (% of total) | 78 (13%) | 39 (15%) | 39 (12%) |
| Mean duration of follow-up in years (SD, range) | 3.8 (4.0, 0–18) | 3.7 (3.7, 0–17.3) | 3.8 (4.2, 0–18) |
| Mean age at last visit in years (SD, range) | 5.1 (4.7, 0–18) | 4.9 (4.5, 0–18) | 5.2 (4.8, 0–18) |
| Number of measurements a | |||
| Height | 3107 | 1344 | 1763 |
| Weight | 3414 | 1502 | 1912 |
| Head circumference | 1401 | 614 | 823 |
| Individuals in genetic subgroup b | |||
| IC2-LOM (% of total, % of visits) | 320 (56%, 49%) | 146 (56%, 49%) | 179 (56%, 49%) |
| patUPD11 (% of total, % of visits) | 173 (30%, 32%) | 79 (30%, 34%) | 95 (30%, 30%) |
| IC1-GOM (% of total, % of visits) | 66 (11%, 16%) | 28 (11%, 12%) | 38 (12%, 18%) |
| CDKN1C variant (% of total, % of visits) | 15 (3%, 3%) | 8 (3%, 4%) | 7 (2%, 3%) |
- Abbreviations: CDKN1C, Cyclin Dependent Kinase Inhibitor 1C; IC1-GOM, imprinting center region 1 gain of methylation; IC2-LOM, imprinting center 2 loss of methylation; patUPD11, paternal uniparental disomy.
- a The mean number of height measurements per individual for males was 5.4, with a range of 1–25. For females, the mean was 5.8, with a range of 1–40. Weight measurements for males showed a mean number of 5.8, with a range of 1–33, and for females, the mean was 6.0, with a range of 1–43. Head circumference measurements for males showed a mean number of 3.1, with a range of 1–19, and for females, the mean was 3.3, with a range of 1–24.
- b The percentage of visits represents the proportion of total recorded visits associated with each genotype, calculated as (number of visits for a specific genotype/total number of visits) × 100.
| Parameters | Males | Females |
|---|---|---|
| Mean length at birth (SDS) a | 52 ± 2.8 cm (+0.9) | 51.2 ± 3.1 cm (+0.7) |
| Mean height at 18 years of age b (SDS) a | 180.6 ± 8.0 cm (+0.6) | 166.3 ± 10.2 cm (+0.5) |
| Mean weight at birth (SDS) a | 4.003 ± 0.669 kg (+0.9) | 3.890 ± 0.747 kg (+1) |
| Mean weight at 18 years of age b | 75.5 kg (69.2–83.9) | 72.6 kg (56.2–93.9) |
- Abbreviation: SDS, standard deviation score.
- a SDS compared to the WHO charts. This could not be calculated for weight at age 18 years, as there are no WHO reference data at age 18 years.
- b The mean heights and weights at 18 years of age and the ranges of one standard deviation around the mean are derived from GAMLSS model results rather than direct measurements.
3.1 Height-for-Age Charts
Investigating the impact of the country of investigation, which serves as a proxy for ethnicity, we found notable differences in height among 18-year-olds. In the Netherlands, male children with Beckwith–Wiedemann spectrum (BWSp) were significantly taller than their counterparts in the United States by 2.9 cm (standard error (SE) 0.3 cm, p < 0.001). For females, again Dutch children were significantly taller compared to those in the United States by 2.4 cm (SE 0.3 cm, p < 0.001). This prompted us to normalize the Dutch height data. We used the Dutch reference height-for-age charts (Schonbeck et al. 2013) to calculate height standard deviation score (HSDS) values for each height measurement. These HSDS values were then converted to corresponding height values on the WHO reference standards, effectively normalizing the data to ensure comparability across different populations. The normalized height values were used for growth chart modeling.
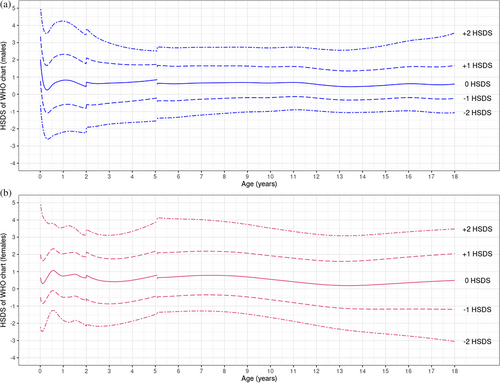
Both male and female individuals with BWSp exhibited increased linear growth across infancy, childhood, and adolescence when compared to the reference population, as illustrated in Figure 1A,B. The linear growth charts plateaued for males at 16 years of age and for females at 15 years of age, aligning with the patterns observed in the reference populations. In Figure 2, this enhanced growth is further visualized by comparing height SDS (HSDS) to the WHO reference over time. In both males and females, HSDS values remained consistently above the WHO reference.
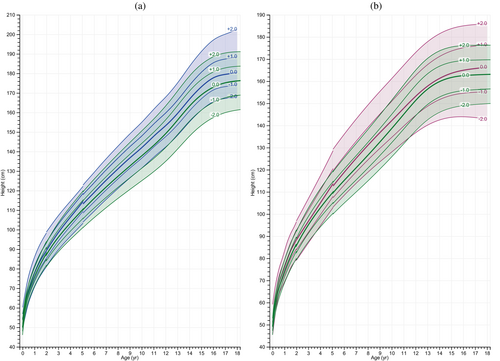
We further analyzed GAMLSS height-for-age models (including data of children with BWSp in the Netherlands) by adding the BWSp genotype as a variable to examine the effect on mean height per genotype at age 18 years. For this analysis, IC2-LOM was set as the reference level. The analysis indicated that while there were differences in height associated with specific genotypes, these were not large (Table 3). Specifically for males, the IC1-GOM subgroup was associated with a slight increase in height compared to the IC2-LOM subgroup, suggesting that individuals with this genotype may be slightly taller by 18 years of age. Conversely, the patUPD11 subgroup was associated with a reduction in height, and the CDKN1C subgroup showed a slight decrease in height, but this difference was not statistically significant. In the analysis focused on females, we observed evident differences in height at 18 years of age, though these were also modest. Notably, individuals of the CDKN1C subgroup were found to be slightly shorter, the IC1-GOM group was further reduced in height, and the patUPD11 subgroup showed the most considerable decrease in height compared to the IC2-LOM subgroup. Given the limited amount of data for each subgroup at 18 years of age, these observations did not allow for reliable estimations of adult height for each subgroup.
| Males | Females | |||||
|---|---|---|---|---|---|---|
| Difference | Standard error | p | Difference | Standard error | p | |
| Height | ||||||
| patUPD11 compared to IC2-LOM | −1.8 cm | 0.2 cm | < 0.001 | −2.4 cm | 0.2 cm | < 0.001 |
| IC1-GOM compared to IC2-LOM | 1.9 cm | 0.4 cm | < 0.001 | −1.8 cm | 0.3 cm | < 0.001 |
| CDKN1C variant compared to IC2-LOM | −0.1 cm | 0.6 cm | 0.8 | −1.3 cm | 0.6 cm | 0.04 |
| Weight | ||||||
| patUPD11 compared to IC2-LOM | 0.02 kg | 0.1 kg | 0.9 | −0.2 kg | 0.1 kg | 0.01 |
| IC1-GOM compared to IC2-LOM | 0.8 kg | 0.2 kg | < 0.001 | 0.03 kg | 0.1 kg | 0.8 |
| CDKN1C variant compared to IC2-LOM | 0.4 kg | 0.2 kg | 0.1 | −0.6 kg | 0.2 kg | < 0.01 |
| Head circumference | ||||||
| patUPD11 compared to IC2-LOM | −0.02 cm | 0.1 cm | 0.8 | −0.6 cm | 0.1 cm | < 0.001 |
| IC1-GOM compared to IC2-LOM | 0.1 cm | 0.2 cm | 0.7 | −0.6 cm | 0.2 cm | < 0.001 |
| CDKN1C variant compared to IC2-LOM | −0.6 cm | 0.01 cm | 0.02 | 0.1 cm | 0.3 cm | 0.7 |
3.2 Weight-For-Age and BMI-For-Age Charts
Looking at the impact of the country of investigation, we did not observe significant weight differences between the children in the United States, the Netherlands, and Italy for both males and females. Therefore, all weight data were analyzed together.
Weight gain in both males and females with BWSp from birth is depicted in Figure 3A,B. The weight-for-age charts exhibited a consistent upward trajectory compared to the reference population, indicating sustained enhancement with age. This suggests that the increased weight in individuals with BWSp is not solely attributed to a temporary surge but rather reflects a persistent pattern of increased weight gain compared with the general population. The mean weight SDS for females with BWSp consistently aligned with +1 SDS at all ages. In males, the mean weight SDS consistently registered at +1.2 SDS across all ages. Similarly, in both males and females with BWSp, BMI demonstrates an early and sustained increase, as illustrated in Figure 4A,B. Notably, the SDS for both sexes consistently coincided with +1 SDS.
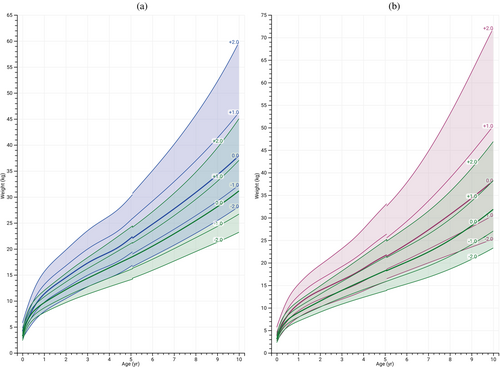
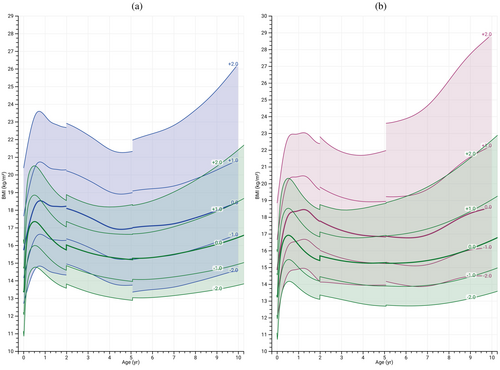
Investigating the impact of genotype (Table 3), with IC2-LOM as the reference level, for males we found a significant difference with IC1-GOM, where children with IC1-GOM were marginally heavier at age 18. IC2-LOM was not statistically different from the CDKN1C and the patUPD11 subgroups. For females, the CDKN1C and patUPD11 subgroups were marginally less heavy.
3.3 Head Circumference-for-Age Charts
Investigating the impact of country of investigation, we did not observe significant head circumference differences between the children in the United States, the Netherlands, and Italy for both males and females. Therefore, all head circumference data were analyzed together.
Growth charts for head circumference in individuals with BWSp could only be constructed up until the age of 4 years due to a lack of sufficient data beyond this point. The mean head circumference in females consistently aligned with +1 SDS until 2 years of age, after which it gradually declined to +0.6 SDS. In males, the average head circumference remained at +1 SDS until 4 years of age as illustrated in Figure 5A,B.
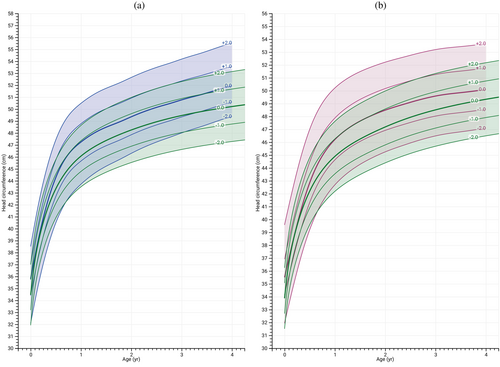
In males, the CDKN1C subgroup had significantly lower head circumference than IC2-LOM at age 4 years (Table 3). In females, the IC1-GOM and patUPD11 subgroups had significantly lower head circumference.
3.4 Supplementary Figures
In the Supporting Information (Figures S1–S40), overlapping data points are visualized for each growth chart. Separate plots for the different genotypes are included, showing the data in relation to the modeled charts.
4 Discussion
In this study, we retrospectively collected anthropometric and genetic data of 574 individuals with BWSp aged 0–18. We constructed BWSp growth charts including height-for-age, weight-for-age, BMI-for-age, and head circumference-for-age growth charts.
Our cohort includes individuals with BWSsp from the United States, Italy, and the Netherlands. The WHO growth charts are based on two studies: (1) a longitudinal study on healthy, term-born infants from six countries (Brazil, Ghana, India, Norway, Oman, United States) from 0 to 5 years under ideal conditions, and (2) a US population growth study from 5 to 19 years (de Onis et al. 2007). Therefore, the WHO reference data are suitable for comparison with US and Italian individuals because mean heights in these populations are close to WHO reference mean heights (Cacciari et al. 2006; de Onis et al. 2007). However, the WHO growth charts are not well suited as reference data for individuals from, for example, the Netherlands, where children are considerably taller (Schonbeck et al. 2013). For that reason, we adjusted Dutch BWSp data after finding a statistically significant difference in height of Dutch BWSp individuals compared to US/Italian BWSp individuals. The resulting growth charts are suitable for use in countries where growth patterns align closely with WHO standards. However, in countries where growth deviates from these standards, the HSDS-for-age charts (Figure 2) can be used as an alternative tool to evaluate linear growth since we speculate that genetic disorders affect height similarly across nations. In our study we could only investigate this for US-Italy data versus Dutch data. A detailed comparison with previous Korean BWSp data was not possible due to missing HSDS values for individuals with BWSp compared to the reference population (Choi et al. 2024). However, visual inspection of the Korean BWSp growth charts suggests that individuals with BWSp in their cohort grow approximately around +1 SDS. While this is slightly taller than the average in our population, it is broadly consistent with our hypothesis that genetic disorders like BWSp influence height similarly across populations. Future studies should further investigate this hypothesis by incorporating data from countries with shorter average heights, such as those in South-East Asia.
Reviewing the growth patterns of BWSp children in the current report, all parameters were increased compared to the WHO growth charts. Contrary to the notion that postnatal growth appears to slow around the age of 7 to 8 years, we observed enhanced growth across all ages (Figure 2) (Shuman et al. 1993). Our data confirm previous observations that individuals with BWSp had a significantly higher length, height, and weight SDS compared to the general population, both at prenatal and postnatal ages (Choi et al. 2024; Mussa et al. 2016). It should be noted that, as illustrated in Figure 2, growth rate appears to slow somewhat during the pubertal ages (compared to the WHO growth charts), whereafter it recuperates. We believe the GAMLSS modeling approach might have somewhat masked the pubertal growth spurt due to the smoothing methodology and relatively sparse data during adolescence (Figures S1–S40). Future studies with denser pubertal data or inclusion of pubertal staging may provide deeper insights into the growth trajectory during this period.
Adult height is often a major concern for parents of individuals with BWSp. Our study revealed that the mean adult height for males was highest in the IC1-GOM group, followed by IC2-LOM, CDKN1C, and the lowest in the patUPD11 group. For females, the highest mean height at 18 years of age was seen in the IC2-LOM group, followed by the CDKN1C, IC1-GOM, and patUPD11 group. The interpretation of the differences in growth between the four subgroups is difficult and may be due to the differently regulated timing of gene expression of the two domains during embryogenesis (Mussa et al. 2016). Interestingly, the sub-analysis of the impact of genotype on height revealed a distinct difference between males and females, highlighting how genetic influences on height may vary between sexes (Table 3). It is important to note that we could not accurately calculate adult heights for these subgroups. However, the observed differences in height among BWSp genotypes were modest, amounting to less than 3 cm. Mean (modeled) height at 18 years in our study was 180.6 cm for males (+0.6 SDS compared to the WHO reference population) and 166.3 cm for females (+0.5 SDS compared to the WHO reference population) (Table 2). Contrasting our findings, an earlier study showed the highest mean adult height in the IC1-GOM group (2.8 ± 1.4 SDS), followed by those with the CDKN1C variant (2.0 ± 1.6 SDS), IC2-LOM (1.7 ± 1.2 SDS), and the patUPD11 group (1.0 ± 1.8 SDS) (Brioude et al. 2013). The discrepancies in adult heights could potentially be attributed to continued growth in certain subtypes after 18 years of age, which our model did not account for. Another contributing factor may include that our analysis was based on modeled mean height at 18 years and did not capture adult heights, whereas the Brioude et al. study included the adult height of 35 individuals, offering a more direct measurement. Importantly, in the Brioude et al. study, the French reference charts of Sempé et al. were used for comparison and to calculate the HSDS (Brioude et al. 2013; Sempé et al. 1973). It was later postulated that these reference charts may underestimate the height of the current French population (Scherdel et al. 2015). This raises the possibility that the findings of Brioude et al. may have overestimated the average HSDS of individuals with BWSp. In that case, the French data would be more in line with ours.
The presented growth charts will facilitate personalized medical care of children with BWSp and allow providers to determine whether an individual's growth pattern is consistent with that of other individuals with the same syndrome. These charts in combination with bone age assessment will also allow for a more accurate prediction of an individual's future growth and thereby facilitate decision-making concerning epiphysiodesis in children with asymmetric lateralized overgrowth of the legs (Ruzbarsky et al. 2017).
This study presents several limitations. The heterogeneous nature of the BWSp cohort, encompassing various genetic subtypes and countries of investigation, is a potential source of variability. We believe that the analyses including the country of investigation as a variable should be interpreted with caution, since our dataset did not include detailed information on ethnicity. However, we believe that the country of investigation serves as a valid proxy for ethnicity. Second, the retrospective design of the study limited our control over data quality and the ability to collect additional relevant information, such as pubertal stages, bone age assessments, and parental heights. Third, a potential bias might be present due to the utilization of measurements from children attending specialized care clinics, which may not accurately reflect the entire BWSp population. Finally, due to the fact that growth in syndromes varies among different populations (e.g., Dutch individuals with Down syndrome are up to 10 cm taller than their peers in other countries) (Van Gameren-Oosterom et al. 2012), Dutch data needed to be normalized. Still, by combining Italian, US, and normalized Dutch data, a pooled syndrome-specific growth chart could be constructed (akin to the WHO growth standards) that may be useful in most parts of the world.
In conclusion, this study presents the first BWSp-specific growth charts. The findings offer valuable insights into growth patterns and potential genotype–phenotype correlations in individuals with BWSp. Despite the limitations, these growth charts hold promise for optimizing care and for providing a valuable tool for healthcare professionals managing the unique growth trajectories of individuals with BWSp.
Author Contributions
Saskia M. Maas: writing – original draft, data curation, project administration, conceptualization. Peter Lauffer: writing – original draft, data curation, methodology, formal analysis, project administration. Guido Cocchi: writing – review and editing, data curation. Madison DeMarchis: writing – review and editing, data curation. Andrew M. George: writing – review and editing, data curation. Alessandro Mussa: writing – review and editing, data curation. Francesco Pellegrino: writing – review and editing, data curation. Alexander M. J. Spaans: writing – review and editing, methodology, formal analysis, software. Emma C. van den Brink: writing – review and editing, data curation. Jan M. Wit: writing – review and editing, methodology. Leonie A. Menke: writing – review and editing. Jennifer M. Kalish: writing – review and editing, data curation.
Acknowledgments
This work was generated within the European Reference Network (ERN) ITHACA and ERN CRANIO. We thank the individuals and their families who participated in this study.
Ethics Statement
Children's Hospital of Philadelphia data were collected under exempt IRB protocol IRB 19-016459. Informed consent was not necessary as all data were anonymized prior to analysis and collected by the physicians of the included individuals with Beckwith–Wiedemann spectrum. This study conforms to the Declaration of Helsinki.
Conflicts of Interest
The authors declare no conflicts of interest.
Open Research
Data Availability Statement
The data that support the findings of this study are available on request from the corresponding author. The data are not publicly available due to privacy or ethical restrictions.


