Developmental and behavioral phenotypes of pediatric patients with PTEN hamartoma tumor syndrome
Abstract
Our study characterized the neurodevelopmental spectrum of individuals with PTEN Hamartoma Tumor Syndrome (PHTS), a syndrome that predisposes to both neurodevelopmental phenotypes and cancer risk. We aim to better understand life-impacting neurodevelopmental features of PHTS. Our study recruited 20 children/adolescents with PHTS, who were then administered assessments for autism spectrum disorder (ASD) and other neurocognitive measures, including assessment of IQ, executive and adaptive functioning, and health-related quality of life. Thirteen individuals (65%) were identified as having ASD, of which five were newly diagnosed during the study. Of those, ASD symptom severity was in the mild–moderate range for 77%. Overall, IQ was in the average range, with a mean of 92.61 (SD 24.45, p = 0.5), though there was a non-statistically significant trend toward individuals without ASD having a higher mean IQ (102.7 vs 82.3; p = 0.1). Subjects had significant impairment in processing speed (mean 75.38, SD 24.75, p < 0.05), decreased adaptive functioning skills across all domains, and a trend toward having more executive functioning problems. Individuals with PHTS are at increased risk of neurodevelopmental disorders, including ASD and impaired executive and adaptive functioning. Although clear guidelines exist for cancer surveillance for individuals with PHTS, additional guidelines and screening for neurodevelopmental disorders are warranted.
Abbreviations
-
- ADOS-2
-
- Autism Diagnostic Observation Schedule – Second Edition
-
- ASD-DIAL
-
- Autism Spectrum Disorder Diagnostic Interview and Activities – Lifespan
-
- ASD
-
- autism spectrum disorder
-
- Bayley-4
-
- Bayley Scales of Infant Development – Fourth Edition
-
- BRIEF-2
-
- Behavior Rating Inventory of Executive Function – Second Edition
-
- CARS2
-
- Childhood Autism Rating Scale – Second Edition
-
- IEP
-
- individualized education program
-
- PROMIS
-
- Patient-Reported Outcomes Measurement Information System
-
- PHTS
-
- PTEN hamartoma tumor syndrome
-
- SD
-
- standard deviation
-
- Vineland-3
-
- Vineland – Third Edition
-
- WAIS-IV
-
- Wechsler Adult Intelligence Scale – Fourth Edition
-
- WISC-V
-
- Wechsler Intelligence Scale for Children – Fifth Edition
-
- WPPSI-IV
-
- Wechsler Preschool and Primary Scale of Intelligence – Fourth Edition
1 INTRODUCTION
PTEN Hamartoma Tumor Syndrome (PHTS), inclusive of the eponymous Cowden Syndrome and Bannayan–Riley–Ruvalcaba Syndrome, is a cancer predisposition syndrome that is caused by pathogenic variants, deletions, or duplications in the phosphatase and tensin homologue (PTEN) gene, a tumor suppressor and regulator of the MAPK pathway (Ciaccio et al., 2019). The PTEN protein is involved in affecting the MAPK and AKT, with downstream effects on the mTOR pathway, and is dynamically regulated by phosphorylation. In particular, PTEN plays a specific role in neuronal growth and development (Skelton et al., 2020). There is considerable clinical heterogeneity, with individuals with PHTS being at increased risk for certain cancers such as breast, thyroid, kidney, endometrial, and colon cancer, as well as for benign tumors such as lipomas and gastrointestinal polyps (Schultz et al., 2017). Patients with PHTS typically have specific physical features, such as macrocephaly and dermatologic findings (e.g., tricholemmomas). They are also at increased risk of having autism spectrum disorder (ASD) and developmental delays (Pilarski et al., 2013). ASD describes a combination of impairments in social and communication skills, in the setting of restricted, repetitive behaviors or interests (Hoirota & King, 2023). Screening for PTEN mutations is recommended for all children presenting with macrocephaly and ASD or other neurodevelopmental issues, as well as in children presenting with other features of PHTS (Ciaccio et al., 2019).
However, research on the neurodevelopmental phenotypes, and specifically genotype–phenotype correlations, in PHTS is limited. The association between ASD and PHTS is well-established (Busch et al., 2019; Fombonne et al., 1999); however, our understanding of this association is limited. Many individuals with PHTS do not have ASD, as a recent case series suggested that only 25%–50% of children with PTEN mutations also have a diagnosis of ASD, referred to as PTEN-ASD (Ciaccio et al., 2019; Hansen-Kiss et al., 2017). However, the prevalence of ASD in PHTS is significantly higher than ASD in the general population, which is estimated to be around 2.3% (Hoirota & King, 2023). Furthermore, our understanding of PTEN-ASD is constantly evolving, and to our knowledge, this is the first study to prospectively assess the prevalence of ASD within the context of intensive neurobehavioral and developmental phenotyping across a broad spectrum of individuals with PHTS.
A study on the neurobehavioral phenotype of ASD in PHTS found that individuals with PTEN-ASD demonstrated poorer performance in every cognitive domain assessed compared with individuals with PHTS without ASD, with effect sizes for most measures being in the medium to large range (Cohen's d range 0.41–2.21; Busch et al., 2019). Caregivers of children in the PTEN-ASD group also observed greater symptoms of behavioral and sensory dysfunction than caregivers of children with PTEN without ASD, with similar range effects (Busch et al., 2019). Individuals with PTEN-ASD also have been shown to have a slightly different autism phenotype compared with those without a PTEN mutation, including overall lower autism severity and more sensory abnormalities (Busch et al., 2019).
Individuals with non-ASD PHTS have still been shown to have a distinct neurobehavioral phenotype, including reduced adaptive functioning (motor skills and internalizing problems), decreased subjective working memory, more impulsivity, and greater sensory difficulties (Busch et al., 2019). There are also reports of individuals with PHTS having other neuropsychiatric diagnoses including attention-deficit/hyperactivity disorder, anxiety, and obsessive-compulsive disorder, as well as a high prevalence of intellectual disability (Hansen-Kiss et al., 2017). Further characterization of such neurobehavioral manifestations is important in order to better inform PTEN-related screening guidelines, as current guidelines and treatments primarily focus on oncologic-related risks.
2 METHODS
2.1 Subjects
This study recruited 20 participants and their caregivers from the multidisciplinary PHTS clinic at the Children's Hospital of Philadelphia (CHOP) between October 2020 and August 2021. Participants were between 1 and 20 years old and met diagnostic criteria for PHTS. Participants were evaluated by a Developmental and Behavioral Pediatrician during the multidisciplinary clinic and later underwent neurobehavioral testing with psychologists and psychometrists through the Behavioral Neuroscience Core and formal evaluation for ASD with the Center for Autism Research, as outlined in Table 1 and described here. Where appropriate, some parts of the ASD testing were conducted virtually due to the novel coronavirus 2019 (COVID-19) pandemic. Individuals were not compensated for their time, but an overall report of the results was provided to families. All patients seen in the multidisciplinary clinic during a set time period were offered the study so as not to skew recruitment, and over 70% of families were interested despite lack of compensation for time. The study was not available to participants with limited English proficiency, as questionnaires were only available in English.
|
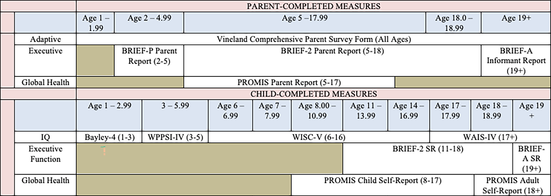
- Note: Measures are both parent-completed and subject-completed, and reflect several domains including intelligence, adaptive and executive function, and global health.
- Abbreviations: Bayley-4, Bayley Scales of Infant Development – Fourth Edition; BRIEF-2, Behavior Rating Inventory of Executive Function – Second Edition; PROMIS, Patient-Reported Outcomes Measurement Information System; SR, Self-Report; WAIS-IV, Wechsler Adult Intelligence Scale – Fourth Edition; WISC-V, Wechsler Intelligence Scale for Children – Fifth Edition; WPPSI-IV, Wechsler Preschool and Primary Scale of Intelligence – Fourth Edition.
2.2 ASD evaluation
Participants ages 1–20 years were administered a developmental history with a Developmental and Behavioral Pediatrician and an extended observation with a psychologist, both with expertise in autism assessment. The Autism Spectrum Disorder Diagnostic Interview and Activities – Lifespan (ASD-DIAL) was used to gather observations, which were then used to complete a Childhood Autism Rating Scale – Second Edition (CARS2). The ASD-DIAL is a set of clinical activities and interview prompts that provide opportunities to observe ASD characteristics over a 30–60 min period (Miller, 2020). The CARS2 is a clinician-completed diagnostic rating scale that takes ~15–20 min to complete after the clinician has completed either a developmental history or an extended observation. Either the Standard Form or the High Functioning Form of the CARS2 was utilized, as appropriate (Schopler et al., 2010). Scores are considered to be in the autism range on the CARS2-Standard if 30 or greater for children <13 years and 28 or greater for children 13 years or older. On the CARS2-High Functioning, 28 or greater is considered to be in the autism range. Administration of the Autism Diagnostic Observation Schedule – Second Edition (ADOS-2; Bieleninik et al., 2017; Randall et al., 2018) was available for any participants for whom the CARS2 may not have been diagnostically clear, but it was not needed for any participants.
2.3 Neurobehavioral testing
- Global intellectual/developmental functioning, important as a measure of cognitive development and to pick up developmental delays, was assessed using the Bayley Scale of Infant Development – Fourth Edition (Bayley-4) for participants 1–2.99 (Bode et al., 2014), Wechsler Preschool and Primary Scale of Intelligence – Fourth Edition (WPPSI-IV) for participants 3–5.99 (Wechsler, 2012), Wechsler Intelligence Scale for Children – Fifth Edition (WISC-V) for participants 6–16.99 (Wechsler, 2014), and the Wechsler Adult Intelligence Scale – Fourth Edition (WAIS-IV) for participants 17 or over (Wechsler, 2008). The validated population mean for each of these measures is 100 with a standard deviation (SD) of 15.
- To assess adaptive functioning, in order to understand how individuals interact with and navigate their environments, all caregivers were administered the Vineland – Third Edition (Vineland-3) Comprehensive Level Parent/Caregiver Form. For each domain on the Vineland-3, a standardized, norm-referenced mean is 100, with SD 15, with lower values suggesting worse function (Milne et al., 2020).
- Executive function, to assess the cognitive skills necessary for behavioral control and carrying out higher-level processes (memory, thinking, and self-control) was measured using the Behavior Rating Inventory of Executive Function (BRIEF). The BRIEF Preschool (BRIEF-P) Parent Report was used for participants ages 2–4.99 years, and the BRIEF – Second Edition (BRIEF-2) Parent Report (PR) and Self Report (SR) were used for participants ages 5–17.99 years, together which will all be collectively referred to here as the BRIEF. The validated population mean for the BRIEF is 50 with a SD of 10. T scores are considered mildly elevated if 60–64, potentially clinically elevated if 65–69, and clinically elevated if 70 or higher. Higher values suggest more executive function problems (Roth et al., 2014).
- Healthcare-related qualify of life, important to understand the impact of PHTS diagnosis on daily living, was assessed using the Global Health measure of the Patient-Reported Outcomes Measurement Information System (PROMIS) Parent Report for participants ages 5–17.99 and the PROMIS Adult Self-Report for participants 18 or over. The validated mean for PROMIS is 50 with a SD 10 (lower values suggest worse global health; Grossman & Mitchell, 2018).
2.4 Statistical analysis
Analyses were only conducted for measures completed by greater than three individuals, thus limiting analysis of certain measures (BRIEF-P, Bayley-4, WPPSI-IV, WAIS-IV). Observed scores in our study cohort were compared with population mean/accepted testing mean using one sample t-tests. In the analysis comparing individuals with and without ASD diagnosis, two-sample t-tests were used. A two-sided p-value of <0.05 was considered statistically significant.
3 RESULTS
3.1 Clinical descriptors
The mean age of participants was 9.8 years (range 1.9–16.03 years), of which 40% (n = 8) were male. PTEN mutations are included in Table 2. Of those whose inheritance was known (n = 12), mutations were de novo in 91% (n = 11). There was one pair of siblings enrolled.
| Record ID | Coding change | Protein change | Mutation type | Classification | Inherited vs. de novo | Exon |
|---|---|---|---|---|---|---|
| CHOP1 | c.293 T > G | p.Leu98Arg | Missense | CI (VUS, LP) | Unknown | Exon 4 |
| CHOP2 | c.503 T > C | p.Ile168Thr | Missense | LP | De novo | Exon 6 |
| CHOP3 | c.1211G > C | p.*404Ser | Stop-loss | P | De novo | Exon 9 |
| CHOP4 | c.1026 + 1G > A | N/A | Splice site | P | De novo | Intron 8 |
| CHOP5 | c.947 T > C | p.Leu316Pro | Missense | LP | De Novo | Exon 8 |
| CHOP6 | c.1003C > T | p.Arg335* | Nonsense | P | Unknown | Exon 8 |
| CHOP7 | c.853G > T | p.Glu285* | Nonsense | P | De Novo | Exon 8 |
| CHOP8 | c.437 T > G | p.Leu146* | Nonsense | P | Inherited | Exon 5 |
| CHOP9 | c.407G > A | p.Cys136Tyr | Missense | P | De novo | Exon 5 |
| CHOP10 | c.737C > T | p.Pro246Leu | Missense | P | De novo | Exon 7 |
| CHOP11 | c.650 T > A | p.Val217Asp | Missense | LP | Unknown | Exon 7 |
| CHOP12 | N/A | N/A | N/A | N/A | N/A | N/A |
| CHOP13 | c.464A > G | p.Tyr155Cys | Missense | P | De Novo | Exon 5 |
| CHOP14 | c.512A > G | p.Gln171Arg | Missense | P | De Novo | Exon 6 |
| CHOP15 | c.493-1G > A | p.? | Splite site | P | Unknown | Intron 5 |
| CHOP16 | c.493-1G > A | p.? | Splite site | P | Unknown | Intron 5 |
| CHOP17 | c.658C > G | p.Leu220Val | Missense | VUS | Unknown | Exon 7 |
| CHOP18 | c.511C > T | p.Gln171* | Nonsense | P | De novo | Exon 6 |
| CHOP19 | c.635-3C > G | p.? | Splite site | LP | Unknown | Intron 6 |
| CHOP20 | c.402_404del | p.Met134del | In-frame deletion | LP | De novo | Exon 5 |
- Note: Of note, one participant (CHOP12) met clinical criteria for PHTS but testing was declined by family.
- Abbreviations: CI, conflicting interpretation; LP, likely pathogenic; P, pathogenic; PHTS, PTEN Hamartoma Tumor Syndrome; VUS, variant of uncertain significance.
- * Indicates stop codon.
3.2 ASD evaluation
Of the 20 individuals evaluated, 13 (65%) were identified as having ASD, of whom 8 had a pre-existing diagnosis and 5 were newly identified during the study. Of those with a pre-existing ASD diagnosis, the mean age at the time of their participation was 11.7 years (range 6.6–15.6 years), with a mean CARS-2 score of 35.4 (range 30–45.5). Of those newly diagnosed with ASD, the mean age at the time of their participation was 6.2 years (range 1.9–13.0 years), with a mean CARS2 score of 30.8 (range 23–37); this difference was not statistically significant (p = 0.18). Of the 13 total with ASD, 9 scored in the mild–moderate symptom range and 3 scored in the severe symptom range on the CARS; one individual was diagnosed with ASD based on clinical history and observation despite scoring in the minimal-to-no symptom range on the CARS2. Of those not diagnosed with ASD, the mean CARS score was 17 (range 15–18). The sibling results were incongruous, as only one sibling was diagnosed with ASD. Of note, there was no clustering of ASD findings with a particular variant, region, or mutation class. There was no significant difference when individuals with a missense mutation (n = 9, mean = 31) were compared with individuals with a truncating or splice site variant (n = 10, mean = 26.5; p = 0.32).
3.3 IQ testing
Of the 20 individuals evaluated, IQ was in the average range, with a mean of 92.61 (SD 24.45, p = 0.5). Of those with ASD, the mean IQ score was 82.3 (range 49–128). Of those without ASD, the mean IQ score was 102.7 (range 83–126); this difference was not statistically significant (p = 0.09). The WISC-V results (n = 15) showed that subjects had average scores in the verbal composite, visual spatial, fluid reasoning, and working memory domains. However, they showed significantly impaired processing speed with a mean of 75.38 (SD 24.75, p = 0.0068). There were also impairments in several different subscale scores, including block design, coding, and symbol search (data not shown).
3.4 Adaptive function (Vineland-3)
Eighteen participants had Vineland-3 forms available for analysis. Both composite and domain-level scores demonstrated significantly decreased adaptive function compared with population means across all domains. For parents of children ranging 1.9–16.0 years of age, the overall Adaptive Behavior Composite score mean was 81.7 (SD 21.4, p = 0.002). Of the individual domains, Communication mean was 84.1 (SD 25.1, p = 0.02), Daily Living Skills mean was 80.8 (SD 19.6, p = 0.001), Socialization mean was 81.4 (SD 23.2, p = 0.004), and Motor Skills mean was 83.9 (SD 12.1, p = 0.004). Of note, for those without ASD, the Socialization mean was 101.3, and for those with ASD, the Socialization mean was 73.6 (p = 0.001).
3.5 Executive function (BRIEF-2, SR, and PR)
Analysis of BRIEF-2SR (n = 7, age range 12.8–16.0) and BRIEF-2PR (n = 13, child age range 6.6–16.0) showed evidence of increased executive functioning problems compared with population means. Scores trended toward indicating more dysfunction in global executive function skills, with the self-reported mean being 59.3 (SD 14.7, p = 0.11) and caregiver-reported mean being 56.6 (SD 10.9, p = 0.05). Each subscale also trended toward indicating more dysfunction, with the self-reported Cognitive Regulation Index falling in the mildly elevated range (60.14, SD 14.83, p = 0.0499). Composite scales are included in Table 3.
| Total (n) | Average age (years) | Specific measure | Mean (score) | Median (score) | Standard deviation | p-Value | |
|---|---|---|---|---|---|---|---|
| IQ (WISC-V) | 15 | 10.94 | Verbal Composite | 97.57 | 100 | 29.89 | 0.8408 |
| Visual Spatial | 92.3 | 92 | 21.17 | 0.2766 | |||
| Fluid Reasoning | 90.35 | 95.5 | 23.97 | 0.1378 | |||
| Working Memory | 96.85 | 97 | 28.8 | 0.6687 | |||
| Processing Speed | 75.38 | 75 | 24.75 | 0.0068* | |||
| IQ Composite | 92.61 | 98 | 24.45 | 0.4985 | |||
| Adaptive function (Vineland comprehensive) | 18 | 9.94 | Communication | 84.1 | 86.5 | 25.13 | 0.017* |
| Daily Living | 80.77 | 79.5 | 19.58 | 0.0006* | |||
| Socialization | 81.38 | 11.5 | 4.18 | 0.0039* | |||
| Motor Skills | 83.88 | 83 | −12.09 | 0.004* | |||
| Composite Score | 81.67 | 79 | −21.43 | 0.0021* | |||
| Executive function –Parent Report | 13 | 11.51 | BRIEF-2, Behavior | 53.3 | 51 | 13.09 | 0.368 |
| BRIEF-2, Emotional | 57.07 | 58 | 9.3 | 0.011* | |||
| BRIEF-2, Cognitive | 55.84 | 55 | 11.09 | 0.0499* | |||
| BRIEF-2, Global | 56.61 | 59 | 10.87 | 0.0524 | |||
| Executive function – Self-Report | 7 | 14.63 | BRIEF-2, Behavior | 55.71 | 53 | 12.94 | 0.1934 |
| BRIEF-2, Emotional | 58.42 | 62 | 12.92 | 0.0667 | |||
| BRIEF-2, Cognitive | 60.14 | 62 | 14.83 | 0.0499* | |||
| BRIEF-2, Global | 59.28 | 59 | 14.76 | 0.1099 | |||
| Global health, Parent Report | 16 | 11.43 | PROMIS T-score | 43.29 | 40.7 | 9.35 | 0.012* |
| Global health, Self-Report | 11 | 13 | PROMIS T-score | 45.96 | 43.6 | 8.07 | 0.128 |
- Note: All measures presented as total score, mean/median/standard deviation, as well as p-value. Italics reference composite scores, and bold values are stastistically significant.
- Abbreviation: WISC-V, Wechsler Intelligence Scale for Children – Fifth Edition.
- * Statistically significant result.
3.6 Global health (PROMIS)
Sixteen caregivers reported measures and 11 child-reported measures were available for analysis. The caregiver report showed a significant impact on the subjects' global health, with a mean of 43.3 (SD 9.35, p = 0.012; Figure 1). Although the caregiver reports were statistically significant and the child reports were not, there was concordance overall between caregiver/child dyads. There was no significant difference in either caregiver child report measures when individuals with and without ASD were compared (caregiver report, p = 0.27; child report, p = 0.08).

Neurobehavioral testing results are summarized in Table 3 and Figure 1.
4 DISCUSSION
This pilot study adds significantly to the literature regarding the range of neurocognitive and behavioral differences observed in individuals with PHTS. Although prior studies have evaluated components of the neurobehavioral phenotype in PHTS, none has conducted such a comprehensive evaluation including dedicated ASD testing for all enrollees with PHTS. This study also includes caregiver and child/adolescent perception of health and wellness.
The rate of ASD diagnosis in the PHTS population has been previously reported as 25–50% of individuals (Ciaccio et al., 2019; Hansen-Kiss et al., 2017), but the rate in our study was higher at 65%, with 25% of individuals recruited to the study subsequently being newly diagnosed with ASD by a comprehensive evaluation by a Developmental and Behavioral Pediatrician and a psychologist. This suggests that the prevalence of ASD in the PTEN population may be higher than previously reported, and that additional individuals could be identified with a dedicated developmental evaluation. Of the five individuals newly diagnosed with ASD, three were <4 years old, which may suggest that these children were detected sooner than they might otherwise have been diagnosed with ASD, if at all, with routine care alone. The earlier that a diagnosis of ASD can be made, the better long-term outcomes are due to earlier implementation of therapies (Lobar, 2015). Thus, early screening for ASD in individuals with PHTS is crucial for optimizing their developmental outcomes. Additionally, our results build on prior studies, particularly by Busch et al., which similarly demonstrated in individuals with ASD and PHTS, compared with those without PHTS, that autism severity was overall lower, and individuals with PHTS also demonstrated adaptive and sensory frontal processing defects (Busch et al., 2019). Similarly, this study also demonstrated a lower IQ in individual with PHTS and ASD, compared with those without ASD (their results showed statistical significance, whereas ours did not).
This study's results reveal the need for close evaluation and monitoring of neurocognitive and adaptive functioning in individuals with PHTS in order to ensure that they obtain the necessary academic and behavioral supports, such as with an Individualized Education Program (IEP). An IEP can help to address deficiencies in executive functioning skills and processing speed, as well as with adaptive functioning impairments. Although not routinely assessed through IEP's or routine clinical visits, global health and health-related quality of life are important to address, as noted by the caregiver PROMIS results, suggesting that patients with PHTS could benefit from the support of a dedicated PHTS program, including psychology and social work supports to ensure that varied educational and healthcare needs are met. Additionally, it is notable that patient-reported Global Health was better on average than reported by their caregiver. This may be a testament to the resiliency of the children and how they may or may not actually perceive a negative impact on their own health. Interestingly, despite the mean IQ being average, both patients and parents reported difficulty in executive function skills on the BRIEF questionnaires, suggesting that patients may struggle more with “higher order” tasks despite intact core reasoning abilities.
There were several limitations to this study, including single-institution analysis and a small population size. Next steps in this research could include analyses in a larger sample size. In particular, the sample size was too small to evaluate for a difference in all neurobehavioral measures between those with or without an ASD diagnosis, nor were we able to detect genotype–phenotype correlations given the small sample size. Additionally, the single institution study design could have introduced ascertainment bias for individuals with PHTS-related developmental delay and ASD, although recruitment targeted all individuals with a PHTS diagnosis without any prior evaluation for ASD features prior to approach, and the majority of subjects approached (70%) consented to the study.
This work emphasizes the role of developmental assessments for patients with PHTS, starting at the time of PHTS diagnosis, as well as through ongoing monitoring and evaluation. Special attention should be paid to children's social and communication skills due to their risk of ASD, as well as monitoring their processing speed, executive functioning skills, adaptive skills, and global health needs.
AUTHOR CONTRIBUTIONS
SPM: Conceptulalization; study design; funding acquisition; writing; reviewing and editing. MD, RTK, SEB, and KZ: data acquisition and analysis. CB, AT, and NHT: Data acquisition. MR and GMB: Data acquisition; reviewing and editing. YL: Data analysis. JSM: Data acquisition and analysis; reviewing and editing. ES: Conceptualization; study design; writing; reviewing and editing.
FUNDING INFORMATION
The project described was supported by Grant Number UL1TR001878 from the National Center for Advancing Translational Sciences, National Institutes of Health; the content is solely the responsibility of the authors and does not 2023 JIPGP Guidelines p. 7 necessarily represent the official views of the NIH.
Open Research
DATA AVAILABILITY STATEMENT
A limited data set supporting these findings of this study is available on reasonable request from the corresponding author, with restrictions related to privacy.