Erythropoiesis-driven regulation of hepcidin in human red cell disorders is better reflected through concentrations of soluble transferrin receptor rather than growth differentiation factor 15
Conflict of interest: M.W. is an officer and has ownership interests in Intrinsic LifeSciences LLC (La Jolla, CA), holds U.S. patents on the hepcidin C-ELISA and related compositions, and has received honoraria from Centocor-Ortho R&D, Inc. G.O. is an employee and has ownership interests in Intrinsic LifeSciences LLC, and has validated the hepcidin assay for clinical testing.
Abstract
Growth differentiation factor 15 (GDF-15) is a bone marrow-derived cytokine whose ability to suppress iron regulator hepcidin in vitro and increased concentrations found in patients with ineffective erythropoiesis (IE) suggest that hepcidin deficiency mediated by GDF-15 may be the pathophysiological explanation for nontransfusional iron overload. We aimed to compare GDF-15 production in anemic states with different types of erythropoietic dysfunction. Complete blood counts, biochemical markers of iron status, plasma hepcidin, GDF-15, and known hepcidin regulators [interleukin-6 and erythropoietin (EPO)] were measured in 87 patients with red cell disorders comprising IE and hemolytic states: thalassemia, sickle cell anemia, and cobalamin deficiency. Healthy volunteers were also evaluated for comparison. Neither overall increased EPO, nor variable GDF-15 concentrations correlated with circulating hepcidin concentrations (P = 0.265 and P = 0.872). Relative hepcidin deficiency was found in disorders presenting with concurrent elevation of GDF-15 and soluble transferrin receptor (sTfR), a biomarker of erythropoiesis, and sTfR had the strongest correlation with hepcidin (rS = −0.584, P < 0.0001). Our data show that high concentrations of GDF-15 in vivo are not necessarily associated with pathological hepcidin reduction, and hepcidin deficiency was only found when associated with sTfR overproduction. sTfR elevation may be a necessary common denominator of erythropoiesis-driven mechanisms to favor iron absorption in anemic states and appears a suitable target for investigative approaches to iron disorders. Am. J. Hematol. 89:385–390, 2014. © 2013 Wiley Periodicals, Inc.
Introduction
Hepcidin is the key regulator of iron absorption in humans and its deficiency disables control of ferroportin-mediated influx of iron into the body 1. While lowering hepcidin allows iron uptake in iron-deficient states, persistent low hepcidin is associated with the development of several forms of iron overload, whether with normal erythropoiesis, such as in the hereditary hemochromatoses, or with impaired red cell production, in the so-called “iron-overloading anemias.” These anemias are characterized by intramedullary apoptosis of erythroblasts leading to ineffective erythropoiesis (IE). In this category, the link between hepcidin deficiency and spontaneous iron overload 2-4 might involve increased production of growth differentiation factor 15 (GDF-15). GDF-15 is a member of the TGF-beta superfamily overexpressed by early erythroblasts, and high plasma concentrations of GDF-15 have been demonstrated in several red cell disorders ranging from relatively uncommon congenital diseases, such as thalassemias 3, 5 and congenital dyserythropoietic anemias 2, 4, to increasingly more prevalent acquired conditions, such as myelodysplastic syndromes 6. Nevertheless, elevation of plasma GDF-15 is neither an exclusive feature of IE 7, nor exclusive of hematologic disease, as it has also been found in cancer and cardiovascular disease 8-10.
GDF-15 downregulates the transcription of the HAMP gene encoding hepcidin in hepatic cell lines, and increased production of GDF-15 is associated with low concentrations of circulating hepcidin in IE, thus offering a logical explanation for the occurrence of low hepcidin in patients with nontransfusional iron overload.
Iron overload is a frequent comorbidity in hemoglobin disorders, such as thalassemia and sickle cell disease (SCD) 11, but remarkable differences in the hepatic and cardiac iron distribution patterns between these diseases have been recognized 12-14 and could rely on the pathophysiological differences between more prominent IE in the former as compared with overt hemolysis in the latter. Milder iron overload in SCD patients has been attributed to smaller transfusion burden with the use of manual and automated exchange transfusion strategies 11 and possibly to higher production of inflammatory mediators secondary to vaso-occlusion. This may cause nontransferrin bound iron uptake by the reticuloendothelial system in SCD, sparing parenchymal tissue 7 and may increase hepcidin levels via interleukin-6 (IL-6) production, as found in anemia of inflammation 15. It remains to be demonstrated if variation in GDF-15 and hepcidin levels could explain the differences reported. Moreover, the balance between GDF-15 and hepcidin production has not been investigated in megaloblastic anemias, a classic, acquired cause of IE.
To shed light on the crosstalk between erythropoietic activity and iron absorption regulation by hepcidin, this study has aimed to investigate GDF-15 as a major determinant of hepcidin concentrations in different disorders affecting red cell production both in the presence of IE or in increased erythropoietic activity due to chronic hemolysis.
Methods
This study was approved by the local ethics board (approval number 057/2009) and blood samples from patients and controls were collected upon written informed consent in accordance with the Declaration of Helsinki.
Patients and controls
Subjects were recruited in the Hematology outpatient clinics at the Hematology and Hemotherapy Center of the University of Campinas, Campinas, Brazil, and at the Hematology and Hemotherapy Center of Pernambuco, Recife, Brazil. As models of IE, we recruited patients diagnosed with transfusion independent β-thalassemia intermedia (TI) and cobalamin deficiency (CD) anemia, an acquired form of IE. As a model of chronic hemolytic states, we recruited patients with sickle cell anemia (SCA) in steady state. Healthy volunteers (HV) with normal hemoglobin electrophoreses and complete blood count, and no personal history of transfusion were also recruited upon blood donation for comparison. Although not enrolled in a chronic transfusion program and chelation-naïve, patients with hemoglobin disorders had a known history of episodic blood transfusions, mostly with over 10 transfusional episodes in their lifetime, while the remaining patients reported no previous blood transfusions.
CD group diagnosis and treatment
The diagnosis of CD anemia was made upon the detection of cobalamin serum levels below 200 pg/mL along with typical peripheral blood smear findings (macrocytosis with macro-ovalocytes and hypersegmented neutrophils). Patients were invited to be followed for further studies 7–10 days after treatment with daily 5 mg intramuscular cobalamin injections, and after complete normalization of their blood counts. Parenteral high dose cobalamin administration was chosen, as it was the only formulation locally available. Patients were advised to undergo upper gastrointestinal endoscopy to screen for gastric abnormalities and Helicobacter pylori infection, which are common causes for CD found in our population.
Hematological and biochemical analyses
Complete blood counts were performed on a Cell Dyn equipment (Abbott Laboratories, Abbott Park, IL) and cell morphology was evaluated by optical microscopy on Leishman-stained peripheral blood films. GDF-15 plasma levels were measured with a Duo-Set enzyme-linked immunosorbent assay (ELISA; R&D Systems, Minneapolis, MN) following the manufacturer's protocol. Soluble transferrin receptor (sTfR), erythropoietin (EPO) and IL-6 plasma levels were measured with commercially available, high-sensitivity ELISA assays (R&D Systems, Minneapolis, MN; Roche Diagnostics, Mannheim, Germany). Hepcidin plasma concentrations were measured with a well validated competitive ELISA (C-ELISA; Intrinsic LifeSciences, La Jolla, CA), as previously described 16-20. Serum iron, total iron binding capacity (TIBC), ferritin, and lactate dehydrogenase levels (Ferritin-Elecsys, Fe-Roche/Hitachi, UIBC-Roche/Hitachi, LDH-Roche, Roche Diagnostics), and C reactive protein (CRP) levels (CardioPhase hsCRP, Siemens) were measured at the Clinical Pathology Laboratory of the University of Campinas. Transferrin saturation (TS) was calculated as serum iron/TIBC × 100, in %. Serum ferritin, TS, sTfR, EPO, and GDF-15 were measured in all groups, LDH only in CD, SCA and TI, and CRP and IL-6 levels only in SCA and TI.
Statistical analysis
Quantitative variables were evaluated using one-way analysis of variance (ANOVA) when comparing all groups of patients and controls, with Tukey's multiple comparison post-test. Friedman's test was employed to compare matched observations in CD patients before, during, and after treatment. Mann-Whitney test and unpaired t test were used to compare variables with non-Gaussian and Gaussian distributions, respectively, between subgroups, for example, men vs. women. Qualitative variables were evaluated using chi-square test. Spearman's rank correlation test was used in calculating correlations. A P value of <0.05 was considered statistically significant. Statistical analyses were performed using GraphPad Prism 5 for Windows software package (GraphPad Software, La Jolla, CA).
Results
GDF-15 concentrations in plasma are increased in both IE and chronic hemolysis, but are not always associated with low hepcidin
A total of 87 adult patients were enrolled in this study, including 20 patients (11 men, 9 women) with transfusion independent β-TI, 53 patients (29 men, 24 women) with SCA, and 14 patients (10 men, 4 women) newly diagnosed with CD anemia. Seventeen HV (9 men and 8 women) were recruited for comparison. A larger number of SCA patients was recruited to control for two possible confounding factors: use of hydroxyurea (HU; 17 patients), a pharmacological agent used to increase fetal hemoglobin levels, and lower lifetime transfusional burden (under 20 transfusional events, 19 patients). Hematological characteristics and biochemical analyses obtained are presented in Table 1.
| HV (n = 17) | TI (n = 20) | SCA (n = 53) | CD (n = 14) | |
|---|---|---|---|---|
| Sex, n (%) | ||||
| Male | 9 (53) | 11 (55) | 29 (55) | 10 (71) |
| Female | 8 (47) | 9 (45) | 24 (45) | 4 (29) |
| Hemoglobin (g/dL; range) | 13.2 (12.0–15.7) | 6.9abc (5.6–8.5) | 8.4a (5.7–11.6) | 9.1d (6.9–11.0) |
| Hematocrit (%; range) | 40.0 (29.9–46.8) | 23.8a (18.4–30.6) | 25.5a (17.5–36.8) | 27.8e (17.6–38.2) |
| MCV (fL; range) | 87.3 (82.3–93.2) | 69.0f, g (53.3–87.5) | 100.2d, h (74.5–104.9) | 114.7a (101.5–127.7) |
| MCH (pg; range) | 28.9 (26.4–31.0) | 20.3f, g (15.9–26.4) | 33.0d, h (22.9–41.0) | 39.1a (31.9–43.9) |
| Reticulocytes (per mm3; range) | 32,610 (25,860–41,400) | 147,235e (51,480–497,800) | 370,130a, h (48,420–425,000) | 89,281 (11,500–219,000) |
| LDH (U/L; range) | 292 (218–368) | 598f, g (322–1,319) | 1168a (365–2,420) | 2,355a (385–9,383) |
| CRP (ng/mL; range) | 0.16 (0.02–0.59) | 0.34 (0.03–1.70) | 0.55d (0.04–2.38) | 0.16 (0.04–0.26) |
| Ferritin (ng/mL; range) | 114.5 (28.5–298.0) | 1857.0a, fg (282.7–9,838.0) | 821.6d (43.2–2,639.0) | 243.0 (29.2–511.0) |
| Iron (ng/mL; range) | 89.5 (50.0–179.0) | 214.0egi (68.0–288.0) | 115.4 (39.0–281.0) | 86.5 (24.0–154.0) |
| TS (%; range) | 29.5 (14.0–46.0) | 85.0agi (21.0–100.0) | 47.0 (15.0–100.00) | 31.1 (9.7–62.3) |
| GDF-15 (pg/mL; range) | 243.3 (121.0–452.1) | 7,834.0a, f (4,690.0–13,865.0) | 2,733.9a, h (287.0–15,611.0) | 8,026a (626–23,483) |
| Hepcidin (ng/mL; range) | 42.7 (11.9–186.7) | 35.2 (<5.0–176.8) | 24.5c (<5.0–445.2) | 74.6 (20.0–297.5) |
| IL-6 (pg/mL; range) | 0.75 (0.07–1.88) | 1.16 (0.22–3.29) | 1.70d (0.11–9.93) | ND |
| EPO (mIU/mL; range) | 5.2 (2.0–27.4) | 30.3a (7.9–254.6) | 30.6a (3.6–926.0) | 24.2d (16.3–82.5) |
| sTfR (nmol/L; range) | 1.23 (0.88–1.81) | 12.54a, g (6.53–17.61) | 10.21a, g (2.84–20.15) | 2.05 (1.18–6.30) |
- Values expressed as medians.
- CD: cobalamin deficiency; CRP: C reactive protein; EPO: erythropoietin; GDF-15: growth differentiation factor 15; HV: indicates healthy volunteers; IL-6: interleukin 6; LDH: lactate dehydrogenase; MCH: mean corpuscular hemoglobin; MCV: mean corpuscular volume; ND: not determined; SCA: sickle cell anemia; sTfR: soluble transferrin receptor; TI: thalassemia intermedia; TS: transferrin saturation.
- a P < 0.001 when compared with HV.
- b P < 0.05 when compared with SCA.
- c P < 0.01 when compared with CD.
- d P < 0.05 when compared with HV.
- e P < 0.01 when compared with HV.
- f P < 0.001 when compared with SCA.
- g P < 0.001 when compared with CD.
- h P < 0.05 when compared with CD.
- i P < 0.01 when compared with SCA.
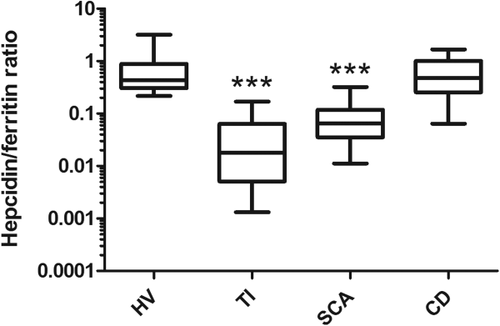
GDF-15 was significantly elevated in all patients in comparison with controls (P < 0.0001). Although the highest plasma GDF-15 concentrations were found in TI and CD patients, hepcidin levels were only significantly lower in SCA patients when compared with HV (P < 0.0001). Among SCA patients, lower transfusional burden and treatment with HU did not seem to cause significant changes to any of the laboratorial parameters analyzed, except for well-known increases in mean corpuscular volume and mean corpuscular hemoglobin and decrease in reticulocyte count (data not shown). Mean IL-6 levels were elevated in hemoglobin disorders (TI and SCA) in comparison with controls, but only reached borderline significance in SCA (P = 0.0496). Ferritin levels in the whole study population correlated positively with both hepcidin and GDF-15 levels (rS = 0.38, P = 0.0005, and rS = 0.63, P < 0.0001, respectively, Supporting Information Fig. S1, panel E). The positive correlation between hepcidin and ferritin was particularly strong in SCA patients (rS = 0.78, P < 0.0001, Supporting Information Fig. S1, panel F). Hepcidin to ferritin ratio for each participant was calculated as a marker of appropriateness of hepcidin production in relation to estimated body iron stores 21, and was found to be lower in the hemoglobinopathies patients than in the remaining groups (Fig. 1). CRP, a nonspecific biomarker of inflammation, correlated weakly with IL-6 (rS = 0.26, P = 0.03) and was not significantly different among the groups studied. Correlation of hepcidin levels with different modulators of its production previously described showed significant correlations with IL-6, ferritin and sTfR levels, but not with EPO or GDF-15 (Supporting Information Table S1; Fig. S1). Gender differences have been reported in hepcidin production 20, 22, so post hoc analysis of the data separating men and women was performed. No statistically significant gender differences were found in the variables analyzed, except for an expected difference in hemoglobin levels (P = 0.0479; Supporting Information Fig. S2).
Hepcidin production in IE by CD varies independently from GDF-15 normalization
We further analyzed the group of patients with CD anemia, a reversible, naturally occurring model of IE. Patients diagnosed with vitamin B12 deficiency had mean serum cobalamin levels of 84.9 pg/mL and, as expected, LDH levels significantly higher than controls (P < 0.0001). Only one patient presented with elevated TS, 5 had isolated hyperferritinemia and 4 had a TS below 20% in spite of normal ferritin. Despite all CD patients being advised to undergo upper gastrointestinal endoscopy, 6 refused the procedure or were lost to follow-up. From the remaining 8 patients, 6 patients presented with atrophic body gastritis, 6 tested positive for H. pylori, either by urease test or gastric histology, and one patient had only moderate enanthematous gastritis but tested positive for anti-parietal cell antibodies. All patients with evidence of H. pylori infection were offered triple therapy with omeprazole, amoxicillin, and clarithromycin.
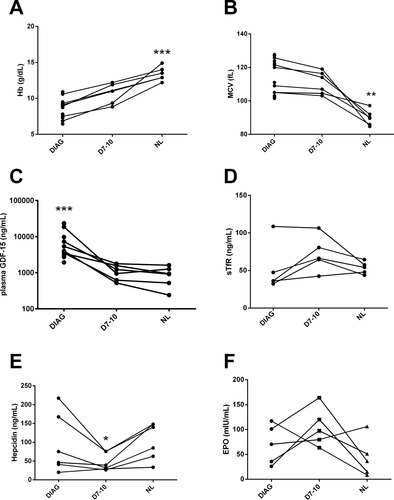
Six patients were available for follow-up in the three time points, and the comparisons of hemoglobin levels and mean corpuscular volume measurements (Fig. 2, panels A and B) at diagnosis, after 7–10 days after starting treatment and after complete normalization of blood counts demonstrate that treatment was successful. Initial high GDF-15 levels rapidly dropped after treatment was started, and decreased faster than hemoglobin levels rose (Fig. 2, panel C). Unexpectedly, hepcidin concentrations at diagnosis were similar to those found in healthy individuals and only transiently decreased during treatment with vitamin B12 supplementation (Fig. 2, panel E). Post-hoc analysis of five patients allowed paired measurements of EPO and sTfR, and showed a poorly defined behavior of these markers, although borderline significance suggested a transient increase of both EPO and sTfR during the recovery of these patients (Fig. 2, panels D and F).
Hepcidin to ferritin ratios and sTfR levels allow distinction among the study populations
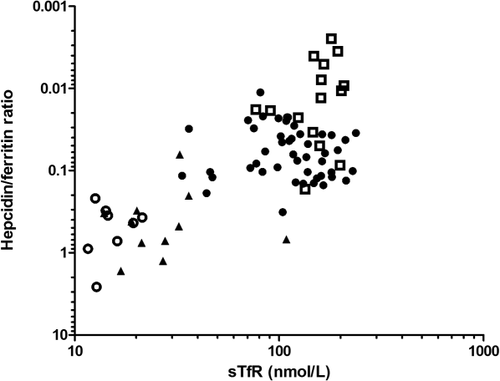
Study populations could be distinguished from each other in clusters by plotting hepcidin to ferritin ratio against sTfR as shown in Fig. 3: HV appear as “high hepcidin to ferritin–low sTfR”, while TI patients appear at the opposite corner of the graph as “low hepcidin to ferritin–high sTfR” with the other groups clustering in between. Noticeably, SCA patients tend to cluster as an intermediate group with “moderately decreased hepcidin to ferritin–moderately increased sTfR), with some overlap with TI patients.
Discussion
Current understanding of the crosstalk between erythropoiesis and iron absorption relies, among several mechanisms, on the putative modulation of the expression of hepcidin by bone marrow-derived factors. GDF-15 is the most widely studied cytokine capable of downregulating hepcidin production and is associated with IE. In this study, we have successfully shown that GDF-15 production is also increased in the first disease used to define IE 23, CD anemia, and that reversal of this type of IE is associated with a rapid decrease in the circulating levels of this cytokine. A previous report that erythropoiesis resumes to normal after 24 hr in pernicious anemia patients receiving adequate treatment 24 corroborates that GDF-15 decreases due to erythropoiesis normalization. Nonetheless, differently from what has been reported in other anemias with IE, we found high GDF-15 production in the absence of hepcidin suppression. This suggests GDF-15 overproduction may be necessary, but not sufficient to cause lower hepcidin production in the setting of increased apoptosis of erythroid precursors by itself. The transient reduction in hepcidin production observed after cobalamin replenishment is possibly secondary to an increase in bone marrow iron uptake to restore erythropoiesis, suggesting that systemic hepcidin production is more sensitive to brisk variations in iron bioavailability than to variation in GDF-15 production.
Our data agree with a previous study in a mouse model 25 that found no correlation between GDF-15 and hepcidin, add to the controversy surrounding this correlation in human studies 4, 26-28, and highlight that GDF-15 is not exclusively overproduced in IE—its production was also increased in a chronic hemolytic state. In our study, GDF-15 appears as a marker of increased erythropoietic activity in anemic states, regardless whether red cell production is effective or not, but seems to be further increased in the presence of erythroblast apoptosis. The positive correlation between ferritin and hepcidin might have reflected the contribution of inflammation in stimulating of these acute-phase reactants in the hemoglobinopathies, since many of the patients in this study suffered from SCA and presented with increased concentrations of IL-6, a known hepcidin agonist 29. Inflammation appeared insufficient to fully overcome the influence of erythropoietic drive and normalize hepcidin levels in SCA, but higher IL-6 may account for higher hepcidin to ferritin ratios in SCA than in TI patients. Our results agree with previous data 21, and suggest that hepcidin to ferritin ratio may be an adequate measure to represent relative hepcidin deficiency in anemic disorders.
Future studies should investigate why downregulation of hepcidin production with high GDF-15 seems to happen in the hemoglobinopathies and not in other red cell disorders. Some possibilities include a “priming” role for increased oxidative stress in SCA and TI 30-33 and other mediators, such as twisted gastrulation 1 (TWSG-1) 34 or the newly described erythroferrone 40. Here, we show that both red cell disorders associated with lower hepcidin display increased levels of sTfR. Augmented sTfR is associated with lack of iron 35, but in the diseases studied here, this is caused by increased erythropoietic activity 36, and our data support the suggestion that sTfR would be a more general marker of erythropoietic activity, while GDF-15 would be more specific for IE 37. Based on the inconsistent inverse correlation of GDF-15 and hepcidin, we suggest that overproduction of sTfR may be a common denominator of states in which erythropoiesis is impaired by absolute or relative deficiency of iron. Thus, increasing sTfR and decreasing hepcidin take place simultaneously, in a pathological association favoring iron uptake.
A few limitations of this study should be noted. The absence of ferritin and TS measurements in CD patients during and after treatment prevents further insights on how erythropoietic recovery affects short term regulation of iron absorption and release. More importantly, we unexpectedly found serum hepcidin in TI patients to be in the lowest part of the normal range for the C-ELISA and not significantly different from a small group of HV (n = 17) sampled in this study. While this finding could be attributed to the small size of our HV cohort, we also consider that the previous history of over 10 transfusional events in most of the TI patients must have contributed to exogenous iron overload, and possibly “corrected” the production of hepcidin to some extent. Nevertheless, hepcidin to ferritin ratios still reflected the relative hepcidin deficiency or stated in other terms, inappropriately low serum hepcidin concentrations relative to iron stores, in the TI population.
In Fig. 4, we propose a graphic model summarizing our understanding of the relationship between erythropoietic activity, represented by the most significant modulator of hepcidin production in our study, sTfR, and the appropriateness of the regulation of iron absorption. While normal individuals appear in the lower left corner, iron-overloading anemias such as TI cluster in the upper right corner. SCA tends to appear in the middle range of the graph, with a down- and leftward shift in relation to TI showing the trend that inflammation possibly imposes on the regulation of iron metabolism. We did not find enough evidence to support a threshold effect of GDF-15, considering the presence of similar high GDF-15 concentrations across CD, SCA, and TI patients with different hepcidin levels.
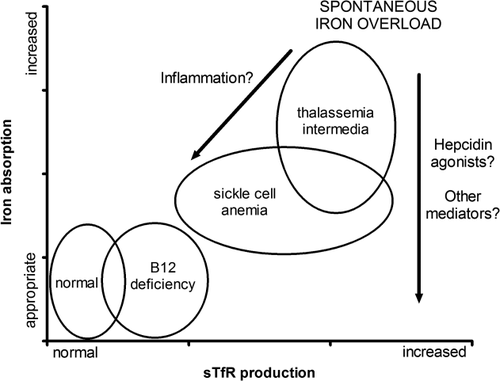
CD anemia patients are found in an area of the graph representing only mild increase in sTfR and no change in hepcidin/ferritin ratio, which possibly points out that IE in the absence of a major change in sTfR lacks additional mechanisms necessary for hepcidin suppression. Novel therapeutic approaches could intervene in these mechanisms, such as the successful approaches in thalassemic mice improving iron overload by either infusing transferrin 38 or by increasing hepcidin and transferrin production by reducing the serine protease matriptase-2 (TMPRSS6) 39, and this should be better explored in humans.
It remains to be demonstrated how the same graphic model would represent other patient populations not studied here, for example, hereditary hemochromatosis, anemia of inflammation, paroxysmal nocturnal hemoglobinuria, etc.
Taken together, our data support that particular pathophysiological characteristics of each red cell disorder influence hepcidin production and the occurrence of spontaneous iron overload due to excessive iron absorption. Moreover, we suggest that GDF-15 is a lesser determinant of hepcidin production in anemic states, despite previous in vitro findings of its suppressive effect. More importantly, sTfR variation either modulates hepcidin production, or most probably reflects alternative mechanisms involved in the crosstalk between erythroblast activity and systemic iron availability. Overproduction of sTfR may be a necessary denominator of erythropoiesis-driven suppressive mechanisms on plasma hepcidin concentrations in anemic states, and a more suitable target for investigative approaches to spontaneous iron overload.
Author contributions
K.Y.F. designed the study, collected data, and drafted the article. K.Y.F., C.L., C.F.F., B.L.D.H., M.A.C.B., M.R.B.M., and F.R.P. collected samples and performed laboratory experiments. G.O. and M.W. performed the hepcidin ELISA assays. K.Y.F., C.L., C.F.F., D.M.A., and F.F.C. analyzed and interpreted data. A.S.A., S.T.O.S., and F.F.C. are responsible for the outpatient clinics. G.O., M.W., and FFC revised the article.
Acknowledgments
The authors would like to thank Prof. Helena Zerlotti Wolf Grotto for biochemical analyses at the Clinical Pathology Laboratory of the University of Campinas.


