Are College Students More Likely to Be Food Insecure than Nonstudents of Similar Ages?
Craig Gundersen is ACES Distinguished Professor at the Department of Agricultural & Consumer Economics at the University of Illinois.
Abstract
“College hunger” has received a great deal of attention in the media and on some campuses across the US. In this article, I consider the question: Are college students more likely to be food insecure than those of similar ages who are not in college? To answer this question, I use data from the 2014 to 2018 Current Population Survey (CPS), the data used for the official food insecurity rates in the US. Across many specifications, I find zero evidence that college students are at higher risk of food insecurity than nonstudents. This holds whether one looks at those between the ages of eighteen and twenty-five or between twenty-six and thirty; whether one looks at “person is a child of the respondent” or “person is not a child of the respondent”; or whether one looks at demographic categories. In fact, food insecurity rates are up to twice as high among nonstudents in comparison to full-time college students.
Introduction
“College hunger” has received a great deal of attention in the media and on some campuses across the US. This attention has come for many reasons, one of which might be the extraordinarily high rates of food insecurity that were reported in some studies. As taken from articles cited in Nazmi et al. (2018) and Bruening et al. (2017), table 1 displays selected studies, the reported food insecurity rates, the measure used, and the sources of the surveys (plus response rates) for colleges in the US. Of the twelve studies, only two have food insecurity rates under 20% while five have rates over 40%.
| Author(s) (year) | Food Insecurity Rate | Food Insecurity Measure | Source (Response Rate if Reported) |
|---|---|---|---|
| Chaparro et al. (2009) | 21.0% | 10-item adult scale | Random sample at University of Hawai'i (33%) |
| Patton-Lopez et al. (2014) | 58.8% | 6-item scale | Convenience sample at rural university in Oregon (7%) |
| Hanna (2014) | 19.4% | 18-item scale | Convenience sample at California colleges |
| Gaines et al. (2014) | 14.1% | 10-item adult scale | Convenience sample at large public university in the Southeast (87.4%) |
| Maroto et al. (2015) | 56.0% | 10-item adult scale | Convenience sample at two community colleges in Maryland (1.8%) |
| Silva et al. (2015) | 26.9% | Selection of food insecurity questions | Convenience sample at University of Massachusetts at Boston |
| Goldrick-Rab et al. (2015) | 39.0% | 6-item scale | Random sample at 10 community colleges in 7 states (9%) |
| Bruening et al. (2016) | 32.0% | 2-item screener | Convenience sample at Arizona State University |
| Morris et al. (2016) | 35.0% | 10-item adult scale | Convenience sample at 4 public universities in Illinois |
| Maguire et al. (2016) | 53.0% | 6-item scale (30 days) | Census at Cal-State University, Humboldt (19%) |
| Martinez et al. (2016) | 42.0% | 6-item scale | Random sample at 10 campuses of University of California (14%) |
| Goldrick-Rab et al. (2017) | 56.0% | 6-item scale | Census at 70 community colleges in 24 states (4.5%) |
These reported rates at the upper end are double and even more-than-double those in groups that have historically been considered to be at high risk of food insecurity—including, for example, American Indians, those with incomes below 50% of the poverty line, and persons with disabilities. (For a review of groups that have been shown to be especially vulnerable to food insecurity see Gundersen and Ziliak 2018.) As such, at least based on these reported rates, policymakers should be much more concerned with food insecurity among college students than, say, American Indians, those with very low-incomes, and persons with disabilities. When one turns to nationally representative surveys, though, food insecurity rates are much lower among college students. (See Blagg et al. (2017) for one example of work using nationally representative data taken from the Current Population Survey (CPS). Also see Nickolaus et al. (2019) for a discussion about why the structure of the questions may lead to misleading responses on surveys of college students.)
The question as to why other surveys have such high rates of food insecurity among college students is not the focus of this study. This is not readily feasible insofar as these “college hunger” surveys have nonrepresentative sampling frames, very low response rates, different placements of the questions, different types of food insecurity questions, etc., making comparisons with nationally representative data impossible. What is feasible, though, is to pose the question: Are college students more likely to be food insecure than those of similar ages who are not in college? If the answer is “yes,” then even if the rates found in the “college hunger” surveys are not plausible, at least the relative food insecurity rates of college students may be of concern. If the answer is “no,” then we may wish to consider whether the emphasis on food insecurity among college students is misplaced given the higher rates of persons of similar ages not in college.
To answer this question, I use data from the Current Population Survey (CPS) from 2014 to 2018, the most recent years available. This is the data that is used to establish the official food insecurity rates in the U.S. (e.g., Coleman-Jensen et al. 2019). My goal is to find at least some evidence that college students have higher rates than nonstudents of similar ages. I find none. Instead, I find that food insecurity rates are substantially higher among nonstudents in comparison to full-time college students under various specifications. Even for part-time college students—who constitute a small proportion of persons in the population of interest—I find no evidence of higher rates among these students.
Data and Methods
Data from the CPS is used for this study. The CPS is the official data source for poverty and unemployment rates in the US. Since 1995, the CPS has also been used as the official data source for food insecurity rates in the US (see, e.g., Coleman-Jensen et al. 2019). It has additional advantages, including a sample size (about 50,000 households per year) that allows for comparisons across a number of categories of interest; use of the official food insecurity measure; wide usage in many other studies (see Gundersen and Ziliak 2018 for a review of some of these); collection on an annual basis, allowing for year-by-year comparisons and the aggregating of data across years; etc.
The standard measure of food insecurity is used for these analyses. This is measured through responses to a series of eighteen questions found on the Core Food Security Module (CFSM). Ten of the items pertain to all households, while eight focus on children. The items include: "Did you or the other adults in your household ever cut the size of your meals or skip meals because there wasn't enough money for food?", “Did you or the other adults in your household ever cut the size of your meals or skip meals because there wasn't enough money for food?,” “Did you ever cut the size of any of the children's meals because there wasn't enough money for food?,” and “Did any of the children ever not eat for a whole day because there wasn't enough money for food?” (the most severe for households with children). Based on the survey responses, households are classified into the categories of food secure (two or fewer affirmative responses), low food secure (three to seven affirmative responses in households with children; three to five in households without children), and very low food secure (eight or more affirmative responses in households with children; six or more in households without children). This article's interest is in food secure versus food insecure (i.e., low or very low food secure).
The reports of food insecurity are based on the respondents' characterization of all household members. Except for cases of one-person households, then, the food insecurity reflects the respondent's views of the situation facing all household members rather than, say, reports of each household member about their food security status. Due to this approach, there may be an upward bias (i.e., respondents overstate the “true” food hardships facing other individuals in the household) or a downward bias (i.e., respondents understate the “true” food hardships facing other individuals in the household). Whether there is an upward or downward bias is not known. One thing that is known, however, is that the relationship over time and across demographic groups has remained remarkably consistent (conditional on changing economic conditions) over time (Coleman-Jensen et al. 2019).
In the context of this article, one may be concerned that parents who are respondents may overreport or underreport the food insecurity status of college students. This may be especially a problem if a child is living away from home. So, in these analyses, I consider two sets of college students. The first is the set of college students for whom a parent (or other caregiver) reports on their food insecurity status. These students may be living at home or away from home. The second is the set of college students who were asked to report on either only their own food insecurity status (i.e., a one-person household) or only on their own and for other people living in the household. I call the first set “person is a child of the respondent” and the second set “person is not a child of the respondent.” Since my interest is in comparing college students with nonstudents of similar ages, the same approach is used for nonstudents. College students are also separated according to whether they attend school full or part time.
All analyses use the household-level weights established in the December Supplement of the CPS. When looking at whether the differences between categories (e.g., nonstudent versus full-time college student and nonstudent versus part-time college student) are statistically significant, I use a Wald test and consider these differences according to whether p < 0.05 and p < 0.01.
For the primary analyses, I restrict the sample to persons between the ages of eighteen and twenty-five. This constitutes 78.7% of full-time college students and 72.7% of full-time or part-time students. Another 12.8% of full-time college students are between the ages of twenty-six and thirty and 15.1% of full-time or part-time students. For some of the further analyses, I consider this age group, although in some cases the sample sizes are too small for analysis.
In the top panel of table 2, there are some demographic characteristics of the persons in the sample of eighteen- to twenty-five-year-olds, broken down by nonstudent/full-time student/part-time student. As expected, those who are nonstudents are more likely to not be a child of the respondent, almost half fall into this category versus about one-third and four-in-ten for full-time and part-time students. For both whites and Blacks, the proportion of the sample not in college is higher than for full-time or part-time students. For the other race category, non-Blacks and nonwhite (predominantly Asian American), the proportion attending college full or part time is higher than for not being in college. For Hispanics, the proportion in the part-time status is more than the other two categories. Those with disabilities are far more likely to not be in college than in college full-time (5.2% versus 1.8%) but there is no statistically significant difference between those not in college and those attending part-time. The bottom panel of table 2 has information for those in the twenty-six to thirty age range. The results are roughly similar except for the category of not being the child of the respondent—a much higher proportion of those in this age range are in this category.
| Nonstudents | Full-Time Students | Part-Time Students | |
|---|---|---|---|
| 18–25-Year-Olds | |||
| Not a child of the respondent | 0.484 | 0.336 ** | 0.41** |
| White | 0.754 | 0.737** | 0.725* |
| Black | 0.165 | 0.132** | 0.152 |
| Not white or black | 0.081 | 0.131** | 0.123** |
| Hispanic | 0.25 | 0.184** | 0.3** |
| With a disability | 0.052 | 0.018** | 0.045 |
| N (unweighted) | 28,864 | 13,353 | 2,171 |
| 26–30-Year-Olds | |||
| Not a child of the respondent | 0.798 | 0.753** | 0.737** |
| White | 0.754 | 0.651** | 0.749 |
| Black | 0.148 | 0.164** | 0.156 |
| Not white or black | 0.098 | 0.185** | 0.095 |
| Hispanic | 0.207 | 0.142** | 0.216 |
| With a disability | 0.042 | 0.033 | 0.029* |
| N (unweighted) | 26,995 | 2,132 | 1,083 |
- Notes: All results are means with the exception of the population size. Data is from the 2014 to 2018 Current Population Survey. **denotes p < 0.01 in comparison to the non-student category; *denotes p < 0.05 in comparison to the non-student category.
Results
In table 3, the primary results of interest are displayed. Namely, the food insecurity rates for each group along with the proportion in the category. For those between the ages of eighteen and twenty-five who are not children of the respondent, full-time college students have food insecurity rates of 9.9% while nonstudents have rates of 16.8%. The rates of nonstudents are 69.7% higher. When I look at reports from parents the differences are even more stark: 9.1% versus 18.4% for a difference of 102.2%. The only case whereby the rates of college students are close to nonstudents is for those who are not the children of respondents and are attending school part time. Those who are attending part time constitute a small proportion of the population in this age group: 4.9% for those who are not children of the respondent and 5.4% for those who are.
| Nonstudents | Full-Time Students | Part-Time Students | |
|---|---|---|---|
| 18–25-Year-Olds | |||
| Not a child of the respondent | |||
| Food insecure | 0.168 | 0.099** | 0.162 |
| Proportion in category | 0.717 | 0.234 | 0.049 |
| Child of the respondent | |||
| Food insecure | 0.184 | 0.091** | 0.121** |
| Proportion in category | 0.590 | 0.356 | 0.054 |
| N (unweighted) | 28,864 | 13,353 | 2,171 |
| 26–30-Year-Olds | |||
| Food insecure | 0.143 | 0.113** | 0.115* |
| Proportion in category | 0.893 | 0.072 | 0.036 |
| N (unweighted) | 26,995 | 2,132 | 1,083 |
- Notes: All results are means with the exception of the population size. Data is from the 2014 to 2018 Current Population Survey. ** denotes p < 0.01 in comparison to the nonstudent category; * denotes p < 0.05 in comparison to the nonstudent category.
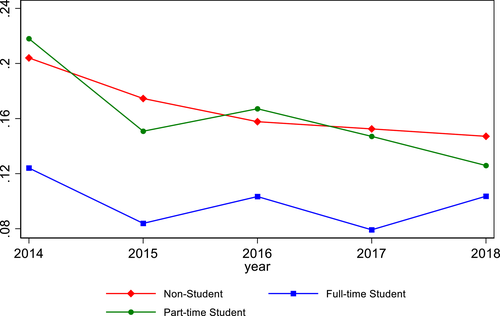
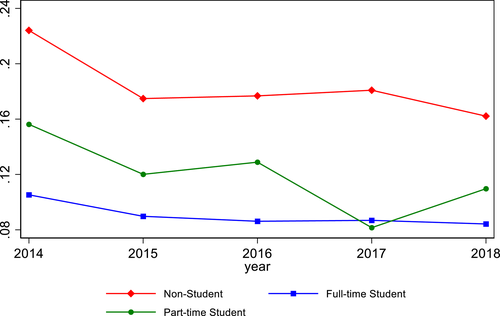
Figures 1 and 2 display the food insecurity breakdowns from table 3 by year for 2014–2018 for cases where the person is not a child of the respondent and where the person is a child of the respondent, respectively. In all years, the food insecurity rates of nonstudents are substantially higher than for full-time college students. The same holds true for part-time college students in figure 2, although in some years, rates are more similar to nonstudents in figure 2.
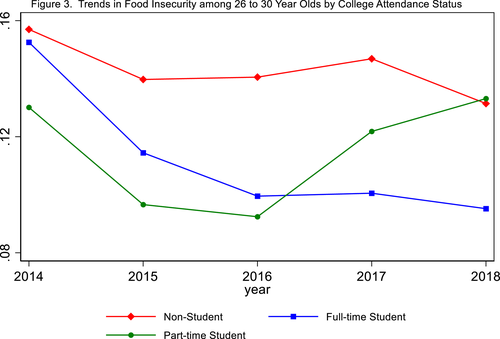
The bottom panel of table 3 displays the results for those between the ages of 26 and 30. (In light of the substantial proportion in the “not the child of the respondent” category, I do not break this down as I do in the top panel.) As seen there, a much higher proportion of the sample falls into the nonstudent category: 89.3% versus 7.2% for full-time students and 3.6% for part-time students. Like for eighteen- to twenty-five-year-olds, nonstudents have statistically significantly higher rates of food insecurity. The gap is smaller, though, than for the younger category. Figure 3 is akin to figures 1 and 2 and shows similar patterns as found in figure 2.
While nonstudents have much higher rates of food insecurity than college students of similar ages, this may not hold for all demographic categories. In table 4, then, I consider whether this does hold across the demographic categories found in table 2. With the exception of persons with disabilities, for each of the demographic categories nonstudents have statistically significantly higher rates of food insecurity than college students. The same holds in some but not all cases for part-time students. For no demographic category, however, are there statistically significantly higher rates of food insecurity for even part-time students in comparison to nonstudents. (The sample sizes for the twenty-six- to thirty-year-old group is too small to construct a table akin to table 3.)
| Nonstudents | Full-Time Students | Part-Time Students | |
|---|---|---|---|
| White | |||
| Not a child of the respondent | 0.153 | 0.094** | 0.172 |
| Child of the respondent | 0.162 | 0.075** | 0.106** |
| Black | |||
| Not a child of the respondent | 0.249 | 0.189* | 0.147** |
| Child of the respondent | 0.284 | 0.178** | 0.232 |
| Not White or Black | |||
| Not a child of the respondent | 0.149 | 0.054** | 0.119 |
| Child of the respondent | 0.179 | 0.089** | 0.083** |
| Hispanic | |||
| Not a child of the respondent | 0.195 | 0.097** | 0.195 |
| Child of the respondent | 0.222 | 0.147** | 0.128** |
| Person with a Disability | |||
| Not a child of the respondent | 0.376 | 0.337 | 0.241 |
| Child of the respondent | 0.274 | 0.194 | 0.302 |
- Notes: All results are means. Data is from the 2014 to 2018 Current Population Survey. ** denotes p < 0.01 in comparison to the nonstudent category; * denotes p < 0.05 in comparison to the non-student category.
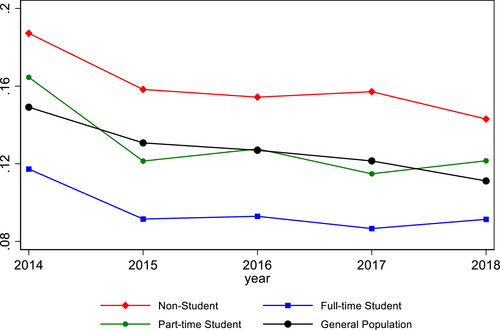
The central focus of this article is on comparisons of food insecurity among college students and nonstudents of similar ages. Another question, though, is whether college students and nonstudents between the ages of eighteen and thirty have different food insecurity rates from the general population. Figure 4 is constructed in a manner similar to figures 1-3 except it now (i) is for all college students and nonstudents between the ages of eighteen and thirty and (ii) includes the general population minus those in the eighteen-to-thirty age range (denoted as “general population”). As seen there, in every year the food insecurity rates of nonstudents is higher than for the general population, while the opposite holds for full-time college students and the general population. The only group of college students that displays results similar to the general population is part-time college students. In table 5 I do a similar analysis, but broken down by the categories in table 4. For all three racial categories, nonstudents have statistically significantly higher food insecurity rates than the general population of these categories while full-time college students have statistically significantly lower rates. There are no statistically significant differences in these groups between part-time students and the general population of these categories. Hispanic nonstudents have food insecurity rates that are not statistically significantly different than all Hispanics but both groups of Hispanic college students have food insecurity rates that are lower than all Hispanics. For persons with a disability, all three groups of those in the eighteen-to-thirty age range have higher food insecurity rates than for all persons with disabilities, but only for nonstudents is the difference statistically significant.
| Nonstudents | Full-Time Students | Part-Time Students | General Population | |
|---|---|---|---|---|
| White | .142** | .084** | .120 | .112 |
| Black | .261** | .186** | .210 | .232 |
| Not White or Black | .132** | .072** | .086 | .111 |
| Hispanic | .201 | .134** | .147** | .199 |
| Person with a Disability | .321** | .258 | .240 | .22 |
- Notes: All results are means with the exception of the population size. Data is from the 2014 to 2018 Current Population Survey. **denotes p < 0.01 in comparison to the non-student category; *denotes p < 0.05 in comparison to the general population.
Conclusion
The results of this study demonstrate that full-time college students (who constitute the overwhelming majority of college students) have much lower rates of food insecurity than nonstudents. This holds whether one looks at those between the ages of eighteen and twenty-five or between twenty-six and thirty; at whether a person is a child of the respondent or not a child of the respondent; or at demographic categories. While the evidence is slightly weaker for part-time students versus nonstudents, there is no breakdown for which even part-time students have higher rates than nonstudents. In addition to there being no evidence showing that college students are worse off than nonstudents, there is no evidence that college students are worse off than the general population. Again, it is nonstudents who have higher food insecurity rates than the general population.
As stated at the outset of the article, at least part of the reason for why there has been a concern about “college hunger” is due to the extraordinarily high rates of food insecurity found in the studies summarized in table 1. There are only three studies of food insecurity among college students that have rates even remotely similar to those found in this article—Chaparro et al. (2009), Hanna (2014), and Gaines et al. (2014). All the other studies have rates that are much higher. Even in the group of college students most at risk in this study (i.e., persons with a disability), the rates are lower than those found in other studies.
Based on these results, one should not conclude that “college hunger” is a myth. Indeed, roughly one in ten college students are food insecure and, while this is lower than the national average, the challenges facing these students should be taken seriously and efforts to address this issue are worth pursuing. However, if our concern is horizontal equity within an age group to help populations that are most vulnerable in the U.S. we should be much more concerned about nonstudents who are between the ages of eighteen and thirty than about college students. This is especially the case insofar as nonstudents have rates that are, depending on the sample, more than twice as high as full-time college students. Moreover, from a longer-term perspective, given that college students are likely to earn more than nonstudents upon graduation (e.g., Avery and Turner 2012), the higher food insecurity rates among nonstudents should be especially troubling.
In light of the findings of this article, future researchers may wish to concentrate on the food insecurity status of those who are not in college at either the four-year or two-year institutions. Instead, researchers may wish to pose questions such as “what are determinants of food insecurity among nonstudent young adults?,” “how can food assistance programs be designed to most effectively help nonstudent young adults?,” “what are the short-term health consequences facing nonstudent young adults?,” and “what are the long-term health consequences facing nonstudent young adults?”


