Profiling Heterogeneous Circulating Tumor Cells (CTC) Populations in Pancreatic Cancer Using a Serial Microfluidic CTC Carpet Chip
Abstract
Although isolation of circulating tumor cells (CTCs) from pancreatic adenocarcinoma patients is feasible, investigating their clinical utility has proven less successful than other cancers due to the limitations of epithelial cellular adhesion molecule (EpCAM)-only based CTC assays. An integrated technology- and biology-based approach using a microfluidic “Carpet Chip” is presented to study the biological relevance of heterogeneous CTC populations. Both epithelial CTCs (EpCs) and epithelial-to-mesenchymal transition (EMT)-like CTCs (EMTCs) are isolated simultaneously from the whole blood of pancreatic cancer (PaCa) patients (n = 35) by separately targeting two surface markers: EpCAM and CD133. Recovery of cancer cell lines spiked into whole blood is ≥97% with >76% purity. Thirty-four patients had ≥5 EpCs mL−1 and 35 patients had ≥15 EMTCs mL−1. Overall, significantly higher numbers of EMTCs than EpCs are recovered, reflecting the aggressive nature of PaCa. Furthermore, higher numbers of EMTCs are observed in patients with lymph node involvement compared to patients without. Gene expression profiling of CTCs from 17 patients reveals that CXCR1 is significantly upregulated in EpCs, while known stem cell markers POU5F1/Oct-4 and MYC are upregulated in EMTCs. In conclusion, successful isolation and genomic profiling of heterogeneous CTC populations are demonstrated, revealing genetic signatures relevant to patient outcomes.
1 Introduction
Pancreatic adenocarcinoma (PDAC) is the fourth leading cause of cancer-related death in the United States.1 The median survival time is less than 6 months, with a bleak 5-year survival rate of 8%, making it one of the most lethal malignancies in humans.1 Lack of early symptoms and reliable screening tests for early detection are major reasons why over 85% of PDAC patients are inoperable at the time of diagnosis.2
Since access to tumor biopsies in pancreatic cancer (PaCa) is quite challenging due to its anatomical positions, biomarkers are required to provide better diagnosis and explore alternative therapies. One avenue that holds promise in developing accurate predictive tools and pharmacodynamic biomarkers to guide patient care is the analysis of circulating tumor cells (CTCs).3-9 Detection, quantification, and molecular characterization of CTCs in peripheral blood have been recognized as highly valuable emerging techniques in the diagnosis of cancer and detection of metastasis.3, 7, 10, 11 CTCs are cells that extravasate from the primary tumor, enter the blood stream, enabling their transportation to distant sites and potential formation of metastatic tumors.2, 3, 12 CTCs may enter the blood circulation in two ways: by passive shedding of tumor cells from the primary tumor, which may occur in large numbers and in early stages of tumor formation, or by an active mechanism involving the epithelial-to-mesenchymal transition (EMT).2 EMT is a complex molecular and cellular program by which cells of epithelial origin lose their apical-basal polarity and adhesiveness to neighboring cells and gain mesenchymal features including aggressiveness, motility, invasiveness, and resistance to apoptosis.2, 5 Thus, EMT can be molecularly defined by tumor cells losing intracellular adhesions, with down-regulation of epithelial markers (e.g., epithelial cell adhesion molecule (EpCAM) and cytokeratins) and upregulation of mesenchymal markers (e.g., CD133, vimentin).13
Cancer stem cells (CSCs) and cells undergoing EMT play important roles in tumorigenesis, metastasis, and chemo and radioresistance.14, 15 Therefore, detecting and analyzing these cells among CTCs in circulation could lead to better understanding of EMT, and tumor metastasis. CD133 expressed on the cell surface is now recognized as a prospective marker for the isolation and characterization of pancreatic stem and progenitor cells.16-18 CD133+ pancreatic CSCs showed more aggressive behavior such as increased cell proliferation, migration, and invasion compared with the CD133− cells because they underwent EMT more readily.19-21
Detection and isolation of CTCs is challenging due to the low number of CTCs in the blood (on the order of 1 CTC per 106–109 normal blood cells) and the biological heterogeneity of CTCs.22 Multiple approaches have been considered to overcome the limitation of low numbers of CTCs in peripheral blood, including immunoaffinity based methods, size-based separation, Ficoll density gradient, dielectrophoresis, negative depletion, and inertial methods.23 Microfluidic isolation techniques have become attractive since the development of the first microfluidic CTC Chip4 due to their high sensitivity, high throughput, low cost, and enhanced spatiotemporal control abilities.4, 9 However, although antibody-based capture methods offer high specificity, most reported technologies lack the ability to capture biologically heterogeneous populations of CTCs. The main approach for enrichment thus far has been to capture cells of interest by using specific epithelial markers such as EpCAM on the cell surface to distinguish CTCs from leukocytes.3 However, EpCAM-based approaches could potentially miss a substantial portion of CTCs that have lost expression of epithelial markers and have undergone the process of EMT.11, 24
Herein, we present an integrated technology and biology-based translational approach using two CTC Carpet Chips in sequence to identify and study the biological relevance of rare heterogeneous population of circulating cells, including both epithelial CTCs (EpCs) and EMT-like CTCs (EMTCs), simultaneously from the peripheral blood of PaCa patients (Figure 1). We have focused on a novel strategy based on obtaining separate populations of phenotypically distinct CTCs.
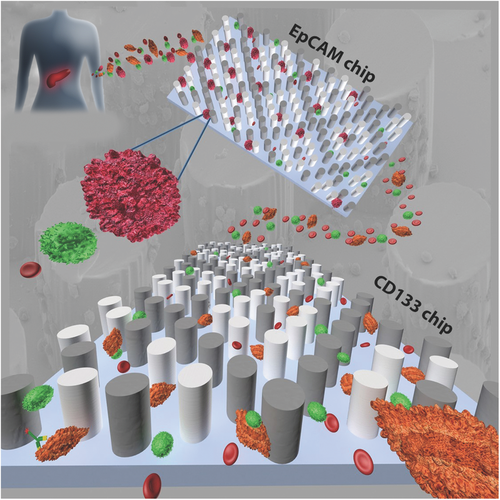
Obtaining pure CTC populations is crucial for a robust downstream gene analysis. Herein, by applying the novel sequential microfluidic Carpet CTC Chip with different spacing between posts and arrays, we demonstrated enumeration, detection, and downstream mRNA genetic analysis of distinct CTC populations (EpCs and EMTCs) from PaCa patients. We profiled the mRNA expression of both of these populations using a panel of 96 cancer-related genes (Table S1, Supporting Information).
In the current work, for a more thorough representation of biologically diverse CTCs in patients with pancreatic cancer sequential microfluidic devices were set up using antibodies against EpCAM, to capture EpCAM+ CTCs, and antibodies against CD133 to capture more stem cell like cells, or putative EpCAM- CTCs.25
2 Results and Discussion
2.1 CTC Carpet Microfluidic Chip Technology
The CTC Carpet Chip is designed to capture heterogeneous populations of rare CTCs using antibody-coated microposts.4 In order to increase the sensitivity of capture phenotypically distinct CTCs, the previous CTC-Chip design developed by Nagrath et al. was modified by implementing an 18° rotation of hexagonal arrays of 100 µm × 100 µm microposts with an average distance of 50 µm between them (Figure S3A, Supporting Information). We have incorporated novel rearrangements of the posts which greatly enhances the capture of EpCs on one chip, while reducing off-target capture, including EMTCs. This employs a dual immunoaffinity and physical discrimination approach enabled by the lateral flow distribution and cell post interactions within the CTC Carpet Chip. The CTC Carpet Chip has around 80 000 microposts and the overall size of the microfluidic device is 44.6 mm × 16.9 mm. The design of the CTC Carpet Chip and representative SEM images of the microposts are shown (Figure 2A).
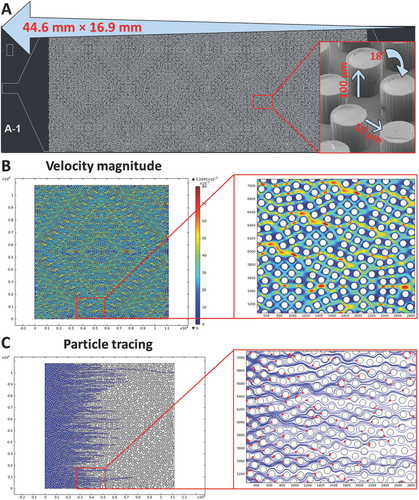
Successful capture of each population with high specificity and sensitivity was dependent on the flow velocities and shear forces within the device. The flow velocity was optimized to allow maximal contact between cells and microposts, while shear forces were sufficient to prevent nonspecific cell attachment to posts. Different micropost geometries and arrangements of the arrays and other parameters were explored in the process of optimization of the CTC Carpet Chip (Figures S2 and S3, Supporting Information). The aspect ratio, spacing, angle, micropost distribution, along with streamlines were optimized to increase capture efficiency for target cells while maintaining minimal nonspecific binding. The velocity magnitude profile and particle tracing plot on a portion of the diamond shape of the CTC Carpet Chip are shown in Figure 2B,C. Cell trajectories (blue lines) are based on particle tracing and the end position of the cells is shown by red dots (Figure 2C). The simulations clearly had shown the lateral distribution of fluid around the Carpet design as well as effective cell post interactions. The CTC Carpet Chip was fabricated using standard photolithography techniques to create a silicon mold, followed by PDMS replica molding, and functionalized as previously described (Figure S1, Supporting Information).26
2.2 Single/Dual CTC Carpet Chip Optimization
Four cancer cell lines with different levels of EpCAM expression and one cell line with high CD133 expression were used for testing and optimization of the CTC Carpet Chip: colon cancer line HT-29 and pancreatic cancer line Panc-1 (high EpCAM expression), prostate cancer line PC-3 (low EpCAM expression), breast cancer line Hs-578T (no EpCAM expression/negative control) and pancreatic cancer line Capan-1 (high CD133 expression).27 These cell lines were labeled with green CellTracker dye (GCT) (described in the supplementary) and spiked into blood at a concentration of 1000 cells mL−1 to test the capture efficiencies of the single CTC Carpet Chip functionalized with either anti-EpCAM or anti-CD133 antibodies. The CTC Carpet Chip yielded the following efficiencies across the different cell lines; 97.5% ± 2.2 (HT-29) and 94.9% ± 2.4 (Panc-1), 87.7% ± 13.9 (PC-3), 13.6% (Hs-578T), and 73% ± 16.6 (Capan-1) (Figure 3A). Thus, high capture efficiencies were observed using different cell lines using single CTC Carpet chip.
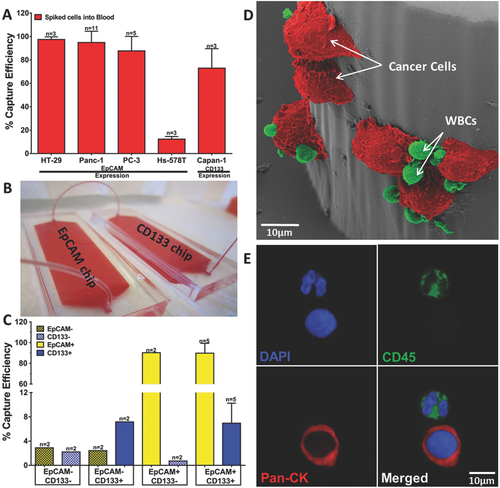
To capture different subpopulations of CTCs (EpCs and EMTCs) simultaneously from the same blood, we connected two devices functionalized with different antibodies (anti-EpCAM in one device and anti-CD133 in the other device) in series as shown in Figure 3B. Therefore, distinct populations could be easily identified and separately made available for downstream gene analysis. Blood was passed through the connected chips at a flow rate of 1 mL h−1 through the inlet of the first device. Four different setups were tested in order to evaluate the sensitivity and specificity of the capture rates of the chips, each coated with and without the antibodies of interest (anti-EpCAM and anti-CD133), using Panc-1 spiked into blood. Chips coated with no antibodies (EpCAM− and CD133−) showed <3% capture efficiency (false positive). However, in the presence of antibodies (EpCAM+ and CD133+), efficiency rates increased to 89.8% ± 9.5 EpCAM+ cells and 6.6% ± 3.3 CD133+ cells. EpCAM+ and CD133− dual chips showed 90.2% and 0.7% EpCAM+ and CD133+ cells capture efficiencies. EpCAM- and CD133+ dual chips captured 2.4% and 7.2% EpCAM+ and CD133+ cells capture efficiencies (Figure 3C), demonstrating high specificity and consistent yields for both of the captured antibodies in the dual isolation. In summary, applying dual CTC Carpet chip technology in terms of isolating different type of cancer cells was quite sensitive and specific.
A pseudocolored SEM image of captured cancer cells spiked into blood on the CTC Carpet Chip is shown in Figure 3D. After capture, cancer cells were detected by immunofluorescence staining protocol described in Methods. Pan-CK+/CD45−/DAPI+, and Vim+/CD45−/DAPI+ phenotypes were determined and enumerated as EpCs and EMTCs, respectively. Figure 3E shows confocal images of captured cancer cells stained for Pan-CK (red) and CD45 (green) to distinguish EpCs and WBCs. The captured EMTCs in the CD133 chip are shown in Figure 4C, with Vim (orange) and CD45 (green) used as detection antibodies for the EMTCs and WBCs respectively.
2.3 Application of Technology to Evaluate Heterogeneity in Clinical Samples
We used the microfluidic chip to analyze fresh blood samples from PaCa patients. Thirty-five patients with histologically documented PDAC of varying stages were analyzed, with clinical data provided in Table S2 (Supporting Information). Blood samples from nine healthy controls (HC) were used for comparison.
The dual CTC Carpet Chips were connected in the sequential order of EpCAM first followed by CD133 in order to capture the EpCs and EMTCs (Figure S4, Supporting Information) and then whole blood collected from the patients was flowed through the chips at 1 mL h−1 (Figure 3B). However, to increase the throughput in the future, one can apply a predepletion step like RBC removal using inertial separation utilizing spiral devices.28
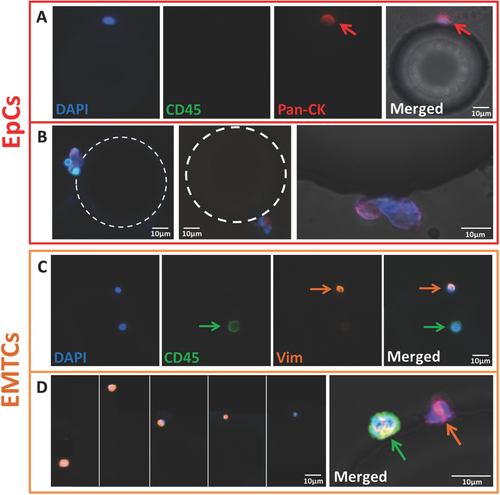
Figure 4A,B shows representative images of EpCs cells (Figure 4A) on the EpCAM chip captured from PaCa patients. EpCs demonstrating varied morphologies, ranging from round to oval in shape and in some cases occurring as cluster (Figure 4B). Figure 4C shows images of an EMTC and a leukocyte. As shown in Figure 4D, EMTCs captured on the chip had a wide range of cell sizes. Red, orange, and green arrows indicate Pan-CK, Vim, and CD45 staining respectively. Figure 4E shows a representative confocal image of a EMTC (pink) and a WBC (green) captured from a PaCa patient on the CD133 chip. To determine the presence of EpCs+ in the CD133 chip and EMTCs+ in the EpCAM chip, 16 patient samples were tested through triple staining of each chip (Pan-CK and Vim along with CD45) (Figure S5, Supporting Information). A small number of double positive (Pan-CK+/CD45+) cells were found in some samples and were excluded from this study due to unknown origin and significance.
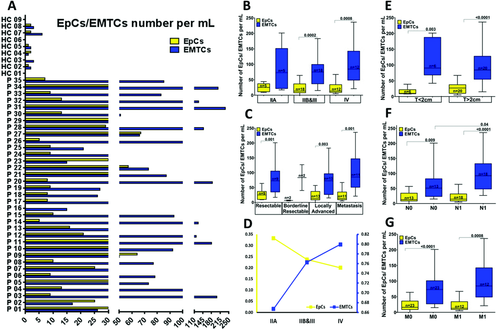
We quantified the captured EpCs and EMTCs on EpCAM and CD133 chips and found that 97.5% of the patients had EpCs+ (≥5 Pan-CK+ CTCs mL−1) with a mean of 22.4 ± 17.7 mL−1, while all 35 patients had EMTCs (≥15 Vim+ CTCs mL−1) with a mean of 85.7 ± 59.5 per mL. In contrast, low numbers of EpCs (0.9 ± 0.9 per mL) and EMTCs (1.9 ± 2 per mL) were observed in the HCs (Figure 5A). In summary, the results indicate significant differences between the overall number of CTCs in PaCa patients samples (108.1 ± 63.5) versus HCs (2.8 ± 2.6) (p < 0.0001), as well as the number of EpCs (20.8% of overall CTCs) versus EMTCs (79.2% of overall CTCs). We found significantly higher numbers of EMT-like CTCs in circulation in PaCa patients compared to epithelial CTCs (p < 0.0001).
2.4 CTCs Enrichment by Using the CTC Carpet Chip to Explore Associations with Clinical Outcomes
To further explore the relationship of EpCs and EMTCs and clinical outcomes in the PaCa patient cohort (n = 35), the CTC counts from these two cell populations were analyzed based on clinical disease stages (Figure 5B–G). All stages except stage IIA showed significantly higher numbers of EMTCs compared to the number of EpCs (Figure 5B). Patients with stage IV disease showed higher numbers of EMTCs than EpCs (p = 0.0008), suggesting the strong role of the EMT process in the metastatic progression of pancreatic cancer.2, 5, 10, 29-31
Also, patients were categorized based on the tumor status as resectable (n = 9), borderline resectable (n = 2), locally advanced (n = 13), and metastatic (n = 11) groups. There were significantly higher numbers of EMTCs than EpCs between all these groups, except borderline resectable patients due to the small sample numbers (Figure 5C). The ratio of EpCs/EMTCs to total number of CTCs has a decreasing/increasing trend with later stages (Figure 5D). The percentage of EpCs decreased toward late stages, whereas the percentage of EMTCs increased. Figure 5E–G summarizes the frequencies of EpCs and EMTCs characterized in different patient subgroups, including tumor size <2 cm versus >2 cm, no lymph node involvement (N0) versus lymph node involvement (N1), and nonmetastatic (M0) versus metastatic (M1) groups. Significantly higher numbers of EMTCs (p = 0.04) were observed when the patients were grouped based on lymph node involvement (N1) compared with no lymph node involvement (N0) patients. This supports the observations from other studies, where the associations of EMT with lymph node metastasis have been reported.32-34 However, we were not able to observe any significant correlation between CTC abundance, tumor size, metastatic burden, operability, and survival rate in this cohort which could be due to the limited sample size.
2.5 Gene Expression Profiling of EpCs and EMTCs by Quantitative Reverse Transcription Polymerase Chain Reaction (qRT-PCR)
RNA was extracted from captured CTCs and utilized for gene expression profiling by RT-qPCR. The gene expression profiles of CTCs isolated from blood samples of PaCa patients (n = 17) which were run through the dual CTC Carpet Chip are shown in Figure 6. Figure 6A presents the heat map of expression levels of genes. Figure 6B presents the median log fold change of select genes with logFC > 1.5. Among these genes, ERCC1 showed >1.5 logFC in the CTCs captured on EpCAM coated chip which is correlated with significantly better overall survival (OS) and progression free survival (PFS). The histological staining and immunohistochemistry (IHC) analysis of some of these markers in the primary PDAC tissues are shown in Figure S6 (Supporting Information).
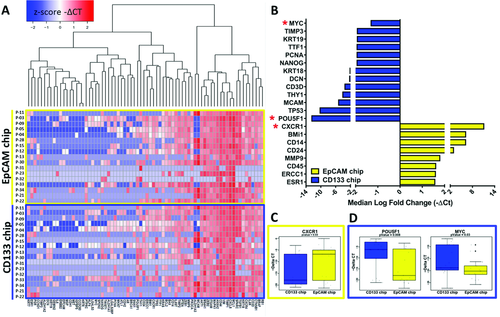
Figure 6C–D presents box plots showing expression of significant differential expression of genes in patient CTCs isolated by EpCAM and CD133 chips. CXCR1 (p = 0.03) in the EpCAM chip (Figure 6C), and POU5F1 (or Oct-4) (p = 0.008) and MYC (p = 0.03) in CD133 chip (Figure 6D) were significantly differentially expressed. Given the phenotypic differences we have observed between EpCs and EMTCs, it is not surprising that the stem cell related gene POU5F1 (OCT4) is highly expressed in EMTCs. Based on our results, over expression of this gene was significantly correlated with worse PFS.
Signaling pathways based on analysis of captured CTCs on EpCAM chip compared to CTCs on CD133 chip with iPathwayGuide suggested that these two genes (POU5F1 and MYC) were involved in signaling pathways regulating pluripotency of stem cells.
To further explore the gene signatures in different stages of disease, the patients were grouped based on their disease stages (Figure 7). The summary of selected genes (p < 0.05) is shown in the box plots. Stage IIA patients showed significant differential expression of genes including ATL1, BMi1, CD14, CDH2, ERCC1, MKi67, TTF1, and Vim compared to all other stages (Figure 7A-i). We also compared protein level expression of select differentially expressed markers by immunohistochemistry of primary tissues. The hematoxylin and eosin (H&E) staining of the primary PDAC tissues of early stage patients is shown in Figure 7A-ii. The corresponding primary tumor tissues were highly positive (intensity of 3, 100% positivity) for BMi1 protein expression and moderate positive (intensity of 2, 10% positivity) for MKi67 protein expression shown by IHC analysis (Figure 7A-iii).
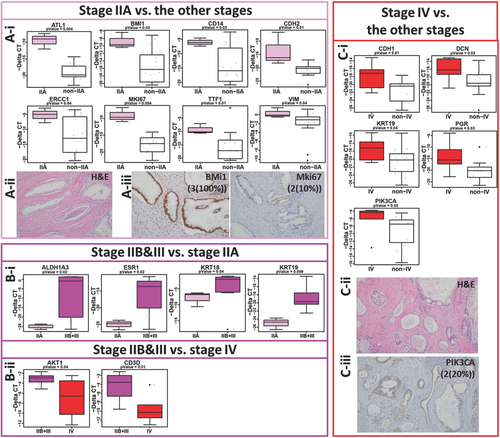
PaCa patients in stages IIB&III showed significant differential expression of ALDH1A3, ESR1, KRT18, and KRT19 compared to stage IIA (Figure 7B-i). Comparing stages IIB and III with stage IV patients reveled significant differential expression of genes including AKT1 and CD3D (Figure 7B-ii). Stage IV patients showed significantly elevated expression of CDH1, DCN, KRT19, PGR, and PIK3CA genes compared to the rest of the stages (Figure 7C-i). The H&E staining of the primary PDAC tissue of late stage PaCa patients is shown in Figure 7C-ii. The protein expression of PIK3CA in the corresponding primary tumor tissues was moderate (intensity of 2, 20% positivity) (Figure 7C-iii).
2.6 Molecular Signature and Prognosis
In the cohort considered in this study, the median OS of all patients was 15 ± 10.2 months (2.5–33.7) and the median PFS was 5.6 ± 10.5 months (1.7–33.5). The survival estimated by Kaplan–Meier (KM) were significantly better for patients with high expression of AKT1 (21.1 vs 6 months, p = 0.08 for OS, and 11.6 vs 4.6 months, p = 0.03 for PFS), BMi1 (20.4 vs 13.6 months, p = 0.04 for OS, and 9.2 vs 4.6 months for PFS), CDH2 (30.2 vs 14.8 months, p = 0.04 for OS, and 6.9 vs 5.1 months for PFS), ERCC1 (22.3 vs 10.6 months, p = 0.04 for OS, and 11.7 vs 4.6 months, p = 0.02 for PFS), IL8 (21.1 vs 6 months, p = 0.08 for OS, and 11.6 vs 4.6 months, p = 0.03 for PFS), TTF1 (20.4 vs 12.8 months, p = 0.08 for OS, and 9.3 vs 2.5 months, p = 0.04 for PFS), and TP53 (18 vs 11.4 months for OS, and 10 vs 4.6 months, p = 0.03 for PFS) (Figure 8A–G). The H&E staining of the primary PDAC tissue of a PaCa patient is shown in Figure 8H-i. IHC analysis of TP53 protein expression in the corresponding primary tumor tissue showed high positivity (intensity of 2, 90% positivity) of this marker (Figure 8H-ii). PaCa patients with higher expression of metastatic marker GEMIN2 (5 vs 18 months, p = 0.01* for OS, and 4.6 vs 7.7 months for PFS), and stem marker POU5F1 (13.4 vs 20.4 months for OS, and 4.6 vs 10.1 months p = 0.04* for PFS) showed worse OS or PFS respectively (Figure 8I,J).
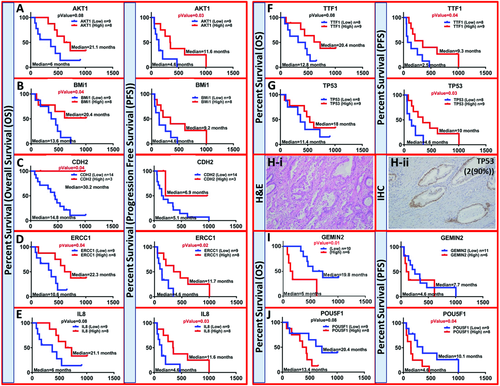
Among these analyzed genes, as mentioned before, BMi1, CDH2, ERCC1, and TTF1 which showed higher expression in early stage patients (stage IIA) compared to the rest of stages which were also significantly associated with prolonged OS and/or PFS. However, PaCa patients with higher expression of stem marker POU5F1 showed worse PFS. Overall, isolating different CTC populations separately may help us predict the patient's outcome.
3 Conclusion
CTC detection based only on EpCAM might miss a substantial number of other CTCs, which might have an aggressive phenotype such as EMTCs.11, 35 We were able to detect distinct heterogeneous CTC population (EpCs and EMTCs) simultaneously from PaCa patient samples by utilizing the novel sequential microfluidic Carpet CTC Chip. Different spacing between posts and arrays, enabled us to increase the capture efficiencies (>97%) and purity (>76%), which is crucial for downstream gene analysis.
Recent advances have enabled the detection of CTCs in various cancer types, however, the clinical utility of CTCs in pancreatic cancer needs to improve.36 By detecting and analyzing primary tumor-derived circulating tumor cells, we would obtain useful information about disease status noninvasively. This data could provide valuable information to improve diagnosis and treatment of pancreatic cancer. There have been no prior reports correlating the EpCs and EMTCs circulation in PaCa.
Hence, we have developed sequential microfluidic CTC Carpet Chip using antibodies against EpCAM, to capture EpCAM+ CTCs, and antibodies against CD133 to capture more stem cell like cells, or putative EpCAM- CTCs in simultaneously from the peripheral blood of PaCa patients.25 Although, the current study are performed with sequential devices, once can combine both the chips into a single device with a multilayer fabrication approach. Our results indicate that enumeration, detection, and molecular characterization of these CTC populations show a great promise as a diagnostic and therapeutic tool for detection of cancer and metastasis. Our findings on gene expression profiling of CTCs from early stage PaCa patients may improve prediction of survival and outcomes. Finally, based on our observations on EMTCs and lymph node involvement, targeting the genes involved in the EMT process and individualized therapy could reduce metastasis, thereby increasing the survival rate of PaCa patients.29
4 Experimental Section
Computational Analysis of the Microposts: Finite element simulations were performed in COMSOL Multiphysics 4.2 (Comsol Inc.) with an inlet flow rate of 1 mL h−1 on a portion of diamond shape of the CTC Carpet Chip. A symmetry boundary condition was applied on the two similar boundaries flanking the posts. A wall (no slip) boundary condition was applied on the post outlines. The particle tracing plot was simulated with rigid particles 15 µm in size with a condition of sticking to any encountered wall being applied.
Capture Efficiency of Single CTC Carpet Chip: Four different cancer cell lines with different EpCAM expression levels, colon cancer line HT-29, pancreatic cancer line Panc-1, prostate cancer line PC-3, and breast cancer line Hs-578T, and CD133 positive pancreatic cancer line Capan-1 were fluorescently labeled with green CellTracker dye (GCT) (Invitrogen). To determine the percentage of cells captured on a functionalized CTC Carpet Chip, coated with either anti-EpCAM (for EpCAM expression cell lines) or anti-CD133 (for CD133 expression cell line), 1000 cells from each of the fluorescently labeled cancer cell lines were spiked into whole blood collected from HCs and flowed through the microfluidic device at a constant flow rate (1 mL h−1). Then cells were fixed and permeabilized on the chip by using Cytofix/Cytoperm (BD Bioscience) followed by staining with DAPI (Invitrogen) to identify DNA content. Capture efficiency was calculated as the percentage of captured cells on the device divided by the total number of cells flowed through the chip. Captured cancer cells were identified and enumerated by scanning the entire micropost chamber of the device using a Nikon Eclipse Ti fluorescence microscope.
Capture Efficiency of Dual CTC Carpet Chip: In order to facilitate separating circulating epithelial (EpCAM-expressing) and EMT-like (CD133-expressing) cells in different devices in sequential order from the same sample, two separate CTC Carpet Chips were connected to each other using a 2-inch piece of connective tubing (Fisherbrand Tygon S3 E-3603 Flexible Tubings). The first chip was coated with anti-EpCAM and the second one with anti-CD133. The blood sample was then processed through each chip in succession. After this step, the chips were disconnected from one another, and washed with PBS (10 mL h−1) for the immunofluorescence staining process.
Patient CTC Capture and Immunofluorescence Staining: This study was approved by the institutional review board (IRB) of the University of Michigan. 1 mL of whole blood from each PaCa patient was processed through two CTC Carpet Chips connected in series at the designated flow rate (1 mL h−1), followed by fixation and permeabilization with 4% paraformaldehyde (Pierce) and 0.2% Triton X-100 (Sigma) respectively, followed by blocking with 3% bovine serum albumin (BSA) (Sigma) plus 2% goat serum (Invitrogen).
In order to identify and characterize subpopulations of CTCs and distinguish them from other blood cells, the following criteria were used: cells that were captured on the anti-EpCAM coated chip and stained positive for pan-cytokeratin (Pan-CK) (AbDSerotec), negative for CD45 (AbDSerotec), and positive for cell nucleus staining (DAPI) (Invitrogen) were characterized as EpCs; and cells that were captured on the anti-CD133 coated chip and stained positive for Vimentin (Vim) (BD Bioscience), negative for CD45, and positive for DAPI were characterized as EMTCs.3 Alexa Fluor 488/546/647-conjugated secondary antibodies (Invitrogen) were applied in order to detect CD45, Pan-CK, and Vim respectively.
RNA Extraction and qRT-PCR Analysis: The mRNA extracted from CTCs were analyzed for gene expression for the selected panel of 96 cancer-related genes (Table S2, Supporting Information). Isolated CTCs within the device were incubated at 42 °C for 30 min with extraction buffer (Arcturus PicoPure kit, Invitrogen) to lyse the cells. Then RNase free water was passed through the chip to collect the cell lysate. Total RNA was then prepared from the CTC lysate using the Arcturus PicoPure kit (Invitrogen) and was subjected to a reverse transcription reaction followed by 18 cycles of preamplification of cDNAs of 96 genes of interest using the pooled TaqMan Gene Expression Assays and Cell-to-CT Kit (Ambion, Invitrogen). Finally, the gene expression pattern of preamplified cDNAs was determined using TaqMan Gene Expression Assays for 96 genes and the BioMark HD qPCR platform (35 cycles). Nondetect values were replaced by a pseudo cycle number of 40 and in the analyzed samples typically out of 96 genes, around 50% of them showed positive data. Also a cut off n > 2 (greater than 2 patients displaying gene expression in each group for each gene) was applied when genes in different groups were compared to each other, and 75 of 96 genes met this criterion. GAPDH was used as an internal reference to normalize cycle threshold (Ct) values for the genes of interest by subtracting each gene expression value by GAPDH to generate a −ΔCt. Median fold changes were generated by dividing the median gene expression () of group A by that of group B. Finally, statistical analysis of data was done on the −ΔCt values for each gene in the studied samples.
Immunohistochemistry: A gastrointestinal pathologist reviewed each patient's H&E stained resection specimen and identified a representative section of formalin-fixed, paraffin-embedded tumor, and normal tissue. The unstained 5 µm thick tissue section was reacted with anti-BMi1 (Cell Signaling), anti-MKi67 (Cell Marque), anti-PIK3CA (Abcam), anti-P53 (Cell Marque), MCAM (Abcam), and CD133 (Miltenyi Biotec) antibodies using IHC technique to determine levels of tumoral protein expression of BMi1, MKi67, PIK3CA, TP53, MCAM, and CD133. The staining intensity and percentage of positive cells out of total tumor cells were graded by a pancreatic pathologist who was blinded to patients' outcomes. The intensity of IHC staining is graded on a scale of 0–3, where 0 is no staining, 1 is weak, 2 is moderate, and 3 is strong staining.
Statistical Analysis: All results present as mean ± standard deviation. Unpaired t-tests (two-tailed) were used to compare the differences between total CTCs of patient samples (n = 35) versus healthy controls (n = 9). Paired t-tests (two-tailed) were used to compare the differences between EpCs and EMTCs (n = 35). Unpaired t-tests (two-tailed) were used to evaluate the effect of stage, resection, tumor size, lymph node involvement, and metastasis on EpCs and EMTCs levels (n = 35). Statistical significance was defined as a two-sided p < 0.05. The Wilcoxon signed-rank test was used in RNA expression for paired samples (n = 17). The Mann–Whitney test was used to quantify differences in RNA expression for nonpaired samples using the average −ΔCt value across both sample chips (n = 17). Analyses were conducted using GraphPad Prism, Python, R software environment, and iPathwayGuide (Advaita). p-values were not adjusted for multiple testing due to the small number of patient samples. The median expressions of genes () across all patients were used as cutoff points for the Kaplan Meier graphs. Log-rank (Mantel–Cox) tests were used to analyze the Kaplan–Meier OS and PFS graphs in all patient CTCs samples (n = 17). p values threshold of 0.05 were used in the iPathwayGuide analysis.
Acknowledgements
This work was supported by the National Institutes of Health (NIH) Director's New Innovator Award (1DP2OD006672-01) (SN), a Department of Defense (DoD) Office of the Congressionally Directed Medical Research Programs (CDMRP) Career Development Award (SN), and funding from the Lefkofsky Scholar award to S.N. The authors express their gratitude to all the patients who participated in this study and the healthy volunteers who contributed blood samples. The authors also thankfully acknowledge the clean room facility available at the Lurie Nanofabrication Facility and the Microscopy and Image Analysis (MIL) of the University of Michigan. IHC of primary tumors was performed by the Research Histology and Immunoperoxidase Laboratory at the University of Michigan Comprehensive Cancer Center under support of grant P30CA046592. The author would like to thank clinical specimen coordinator Kara Schradle and Kirk Herman. The authors are also grateful to Meggie Grafton and Mostafa Ghannad-Rezaie for their help in AutoCAD design of the devices, Saeedeh Noroozi, and Ali Attari for helping with animations images and video, Rork Kuick for his help with statistical analysis and review of the manuscript, and Molly Kozminsky and Ramdane Harouaka for reviewing the manuscript and giving valuable feedback.
Conflict of Interest
The authors declare no conflict of interest.


