A PANoptosis-Based Signature for Survival and Immune Predication in Glioblastoma Multiforme
Funding: The authors received no specific funding for this work.
ABSTRACT
Objective
PANoptosis is a concept of total cell death characterized by pyroptosis, apoptosis, and necroptosis. We aimed to explore the clinical significance of PANoptosis-related genes (PARGs) in glioblastoma multiforme (GBM).
Methods
Expression profiles of GBM were downloaded from the XENA database as a training dataset to construct a differentially expressed PARGs (DE-PARGs)-based risk score (RS) model, and the prognostic prediction role was validated in the CGGA database and GSE108474 using Kaplan–Meier (KM) curve and receiver operating characteristic (ROC) curve. Meanwhile, independent prognostic clinical factors were screened, and their prognosis predictive activity was evaluated by a nomogram model. Furthermore, the relationships between key DE-PARGs and immune cell infiltration, as well as chemotherapy drug sensitivity were analyzed.
Results
The RS model consisting of five DE-PARGs was constructed, including NOD2, NLRP2, NLRP7, GATA3, and TERT. ROC and KM curves confirmed the good potency of the RS prognostic model both in XENA database and GSE108474. Three clinical prognostic factors, including chemotherapy, pharmaceutical therapy, and RS model, were selected as individual prognostic factors. The nomogram model showed RS contributed most to survival probability, followed by chemotherapy and pharmaceutical therapy. In high- and low-risk groups, B cell memory, NK cell resting, and macrophage M1 had significant differences. As compared with the immune checkpoint therapy non-responder group, the responder involved a higher ratio of patients sub-grouped into the low-risk group. Three drugs between high- and low-risk groups had significant differences, including Cisplatin, Gefitinib, and Vorinostat.
Interpretation
Our data exhibit the prognostic value of PARGs in GBM and offer new insights for GBM pathogenesis and immune treatment.
1 Introduction
Glioblastoma multiforme (GBM), originating from astrocytic glial cells, is one of the most aggressive primary tumors of the central nervous system and brain, with only 15 months median overall survival (OS) [1]. According to published statistics, the incidence of GBM varies from 3.19 cases per 100,000 person-years [2] to 4.17 per 100,000 person-years [3]. Currently, the combination of surgery along with radiotherapy and chemotherapy is still the widely used treatment strategy for GBM patients. Unfortunately, the strategy could not give satisfactory results. Until now, the pathophysiological mechanism of the disease remains not fully understood; GBM could not be diagnosed until clinical symptoms occur. Thus, the current medical management goal is to improve the quality of life and extend the lifespan in the clinic. Although our understanding of the GBM molecular mechanism has improved with the development of genomic technology, a more detailed pathogenesis of GBM is urgently needed for improving its diagnosis and treatment.
Programmed cell death (PCD), as a normal physiological process, plays important roles in eliminating risk factors, such as tissue homeostasis maintenance and aging, and damaged cell elimination. Notably, PCD regulation is closely connected with the pathogenesis and progression of tumors, including GBM [4, 5]. Pyroptosis, apoptosis, and necroptosis, as the most genetically well-defined PCD pathways, show extensive crosstalk. PANoptosis, proposed by Malireddi et al. in 2019, is characterized by these well-defined PCD pathways but cannot be explained by any of them alone [6]. Previous evidence has reported that PANoptosis is closely related to host immune responses and can control the invasion and immune evasion of pathogens [4]. Thereafter, the role of PANoptosis in multiple diseases has been reported, including infectious diseases and tumor diseases [7, 8]. Recent evidence showed dysregulated PANoptosis-related genes (PARGs) in the development process of GBM [9]. Furthermore, Sun et al. highlighted the biological functions and prognostic value of PARGs in GBM [10]. PARG clusters divided by an artificial neural network model showed their potential prognosis predicting roles in low-grade gliomas [11]. However, in GBM, the roles of PARGs-based signatures have not been fully clarified, which should be further explored to investigate the potential application of PARGs in the disease.
In recent years, owing to the development of multi-omics technologies, such as genomics, metabolomics, and proteomics [12, 13], the application of these high-throughput data in drug discovery, elucidating disease mechanisms, or establishing prognosis prediction tools is rapidly advancing. Thus, in the study, multiple datasets were enrolled to screen differentially expressed PARGs (DE-PARGs) in GBM. Furthermore, prognosis-related DE-PARGs were further selected for constructing a risk score (RS) prognostic model. Meanwhile, a novel prognostic nomogram model for GBM was successfully constructed by combining important clinical indicators and the DE-PARGs. Our data exhibit the valuable prognosis role of PARGs in GBM and offer new insights for GBM pathogenesis and immune treatment.
2 Materials and Methods
2.1 Data Source and Preprocessing
GBM-associated expression profiles were downloaded from the XENA database (https://xenabrowser.net/datapages/; standardized log (FPKM+1, 2) expression values) as the training dataset, which includes 173 samples (168 GBM tumors and 5 solid tissue normal samples), and the data file was obtained from the platform Illumina HiSeq 2000 RNA Sequestration.
Meanwhile, the expression profile of GSE108474 [14] was downloaded from the NCBI GEO database [15] as validation data for PARGs score evaluation, which was detected based on the platform of GPL570 [HG-U133-Plus_2] Affymetrix Human Genome U133 Plus 2.0 Array. The profile includes 550 human brain tissue samples and 249 samples (221 GBM samples and 28 normal control samples) out of 550 human brain tissue samples were selected for the analysis.
Finally, the mRNA sequencing profile of mRNAseq_693 was downloaded from the Chinese Glioma Genome Atlas (CGGA) database (http://www.cgga.org.cn/download.jsp) [16], which was detected based on the Illumina HiSeq platform. The profile includes 693 glioma tumor samples. Among them, 140 samples were primary GBM tumors, and 135 samples out of these 140 samples provided survival information. Thus, 135 primary GBM tumor samples were selected as the validation dataset.
2.2 Screening of Characteristic DE-PARGs Related With GBM
2.2.1 Screening of DE-PARGs Related to GBM
DEGs of 168 GBM samples versus five normal controls were screened using R4.3.1 limma (Version 3.34.7, https://bioconductor.org/packages/release/bioc/html/limma.html) [17]. The threshold was set as false discovery rate (FDR) < 0.05 and |Log2fold change (FC)| > 1. Then, more than 300 PARGs were obtained from previously published research (Table S1). Thereafter, the overlapping genes of DEGs and PARGs were screened as DE-PARGs. Furthermore, based on the expression levels of DE-PARGs, these genes were displayed using heatmaps [18] with the tool of Reuse R4.3.1 pheatmap Version 1.0.8 (https://cran.r-project.org/package=pheatmap) [19].
2.2.2 Screening of Modules Related to the Status of GBM Based on Weighted Correlation Network Analysis (WGCNA) Algorithm
WGCNA is a systems biology method of correlation networks–based gene screening methods, which can be used for finding modules correlated with disease and identifying candidate biomarkers or therapeutic targets [20]. Based on expression data of TCGA samples, disease status–related modules were filtered using WGCNA (Version 1.61, https://cran.r-project.org/web/packages/WGCNA/index.html) [21] in R4.3.1. Meanwhile, the relationship between the module and the status of disease was calculated. Genes involved in disease-related modules were retained as disease-related candidate genes. Then, the overlapping genes of disease-related candidate genes and DE-PARGs were retained as disease-related DE-PARGs. The module partitioning screening threshold was set as the module set contains at least 100 genes, and cutHeight = 0.995.
Furthermore, GO functional and KEGG signaling pathway enrichment analyses were performed using DAVID (Version 6.8, https://david.ncifcrf.gov/) [22, 23] based on expression levels of disease-related DE-PARGs. FDR < 0.05 was defined as the threshold for enrichment significance.
2.3 Construction and Validation of PARGsScore-Based Prognosis Model
PARGsScore of samples involved in the training dataset was evaluated based on the expression levels of disease-related DE-PARGs using GSVA package (Version 1.36.3, http://www.bioconductor.org/packages/release/bioc/html/GSVA.html) [24] in R4.3.1. Afterward, the samples were divided into high- and low-PARGsScore groups based on their PARGs Score values. Principal component analysis (PCA) was further performed using the PCA function in R4.3.1 language based on the PARGsScore values. Wilcox was then used to compare the distribution differences in expression levels of disease-related DE-PARGs in high- and low-PARGsScore groups. Finally, the receiver operating characteristic (ROC) curve was used to evaluate the prognosis prediction performance of PARGsScore using pROC (Version 1.18.5, https://cran.r-project.org/web/packages/pROC/index.html) [25] in R4.3.1. Meanwhile, the prognosis prediction ability of PARGsScore was further verified in the validation data GSE108474.
2.4 Identification of Immunological and Biological Functional Characteristics Based on Different PARGs Scores
The infiltration of various immune cells in each sample was firstly evaluated using CIBERSORT (https://cibersort.stanford.edu/index.php) [26] based on the expression level of genes in the training dataset, and then the distribution differences of various immune cells in high- and low-PARGsScsore groups was compared using Wilcox. Afterward, gene ontology (GO) functions related to PARGsScsore risk enrichment were screened using clusterProfiler (https://bioconductor.org/packages/release/bioc/html/clusterProfiler.html) [27] in R4.3.1. FDR < 0.05 was selected as the screening threshold. Finally, the Kyoto Encyclopedia of Genes and Genomes (KEGG) signaling pathway related to PARGsScsore grouping was screened and displayed based on MSigDB from Gene Set Enrichment Analysis (GSEA, http://software.broadinstitute.org/gsea/downloads.jsp) [28] and the R4.3.1 GSVA package Version 1.36.3 [24].
2.5 Construction and Validation of Prognostic Prediction Model
2.5.1 Construction of Prognostic Prediction Model
First, DE-PARGs significantly associated with survival prognosis were screened using single-factor Cox regression analysis based on the survival package (Version 2.41-1, http://bioconductor.org/packages/survivalr/) [29] in R4.3.1, and then, the LASSO algorithm in the R4.3.1 lars package (Version 1.2, https://cran.r-project.org/web/packages/lars/index.html) was used to perform regression analysis on DE-PARGs sets that are significantly correlated with survival prognosis to select the optimal DE-PARG combination.
2.5.2 Evaluation of the Efficacy of Survival Prognostic Prediction Models
RS values of training and validation datasets were calculated separately, and the samples were divided into high-risk (RS score higher than or equal to the RS median value) and low-risk (RS score lower than the RS median value) samples according to the RS median value. The correlation between the predictive high- and low-risk samples and the actual survival prognosis information was evaluated by the Kaplan–Meier curve method of the survival package Version 2.41-1 [29] in R4.3.1. Finally, the predictive survival performance of 1-year, 3-year, and 5-year was assessed using the ROC curve method in R4.3.1 pROC version 1.18.5 [25].
2.6 Construction of Independent Prognostic Factors–Based Nomogram Model
2.6.1 Screening of Independent Prognostic Clinical Factors
Independent prognostic clinical factors were explored using the survival package Version 2.41-1 [29] in R4.3.1 based on clinical data from TCGA GBM tumor samples. In the analysis, log-rank p-values < 0.05 were selected as the threshold for significant correlations.
2.6.2 Construction of Nomogram Model
To further investigate the prognostic independence between independent prognostic clinical factors and RS factors, nomogram models for predicting overall survival at 1, 3, and 5 years were constructed using the rms package (Version 5.1-2, https://cran.r-project.org/web/packages/rms/index.html) [30] in R4.3.1, as well as corrective lines. Afterward, the C-index coefficient of the nomogram prognostic model (C-index can be seen as the score of all individual pairs correctly ranked based on Harrell C statistics for predicting survival time [31]) was calculated using R4.3.1 survcomp (Version 1.34.0, http://www.bioconductor.org/packages/release/bioc/html/survcomp.html) [32]. Additionally, decision curve analysis was performed by the rmda package (Version 1.6, https://cran.r-project.org/web/packages/rmda/index.html) [33] in R4.3.1 to observe the net return rate of each factor on survival prognosis results.
2.7 Immune Correlation and Network Analysis Based on Characteristic DE-PARGs
Firstly, DE-PARGs between high- and low-risk groups were screened using Wilcox, and then, the correlation between the expression level of DE-PARGs and the infiltration of each immune cell was analyzed using the Cor function in R4.3.1. Furthermore, molecules associated with DE-PARGs were explored using online software of GeneMANIA (http://genemania.org/) [34] to construct a characteristic DE-PARGs-based network. To further explore the potential function of DE-PARGs genes, GO biological process and KEGG signaling pathway enrichment analyses were also performed, and FDR < 0.05 was defined as the threshold for enrichment significance.
2.8 Analysis of Characteristic DE-PARGs Mutations
The mutation information of TCGA GBM samples was downloaded from GDC (https://portal.gdc.cancer.gov/repository). We further visualized the mutation status and gene location of DE-PARGs used for model construction by maftools (Version 2.6.05, https://bioconductor.org/packages/release/bioc/html/maftools.html) [35] in R4.3.1.
2.9 Immune Checkpoint Response Analysis
The response of TCGA GBM patients to immune checkpoint therapy was predicated using the database of Tumor Immune Dysfunction and Exclusion (TIDE, http://tide.dfci.harvard.edu/) [36]. The response types of each patient to treatment were predicted by TIDE score. The correlation between different immune therapies and prognosis was first examined, and then, the distribution of immune therapy response in high- and low-risk groups was also analyzed.
2.10 Drug Sensitivity Analysis
The sensitivity of each patient to various chemical drugs was estimated based on expression levels of TCGA GBM sample combined with Genomics of Drug Sensitivity in Cancer (GDSC, https://www.cancerrxgene.org/) [37] using R4.3.1 pRRophetic [38] (http://127.0.0.1:22402/doc/html/Search?objects=1&port=22402). IC50 values of each patient were obtained. Then, the difference of IC50 values in high- and low-risk groups was analyzed using the Wilcox test. Meanwhile, the association between expression levels of DE-PARGs and IC50 values was also estimated.
2.11 Cell Culture
The U87 MG and U251 cells were purchased from Cell Bank of the Chinese Academy of Sciences (Shanghai, China) and the human glioma cell line HEB was purchased from Wuhan Procell Life Science & Technology Co. Ltd. (Hubei, China). The cells were cultured in DMDM supplemented with 10% fetal bovine serum and 1% double antibiotics (100 U/mL penicillin and 100 μg/mL streptomycin) (Thermo Fisher, Waltham, MA, USA) at 5% CO2 and 37°C.
2.12 Western Blot
Total protein was extracted by RIPA lysis (Beyotime, Shanghai, China) on ice and quantified by a bicinchoninic acid kit (TransGen Biotech, Beijing, China). After being separated on SDS-PAGE, transferred to PVDF membrane and blocked with 5% skim milk, the samples were incubated with primary antibodies against NOD2 (Cat. no.: bs-7084R, BIOSS, Beijing, China; 1:1000), NLRP2 (Cat. no.: bs-6717R, BIOSS; 1:1000), NLRP7 (Cat. no.: bs-6866R, BIOSS; 1:1000), GATA3 (Cat. no.: WL02447, Wanleibio, Shenyang, Liaoning, China; 1:1000), TERT (Cat. no.: WL02685, Wanleibio; 1:1000) and GAPDH (Cat. no.: 60004-1-lg, Proteintech, Wuhan, Hubei, China; 1:5000) overnight at 4°C. The secondary antibodies goat anti-rabbit IgG (H + L)-HRP (Cat. no.: 111–035-003, Jackson ImmunoResearch, West Grove, PA, USA; 1:5000) or goat anti-mouse IgG (H + L)-HRP (Cat. no.: 115–035-003, Jackson ImmunoResearch; 1:5000) were added on the second day. Proteins were developed by enhanced chemiluminescence reagents (Beyotime).
2.13 Statistical Analysis
All analyses were conducted using R version 4.3.1 or Graphpad Prism 9 (San Diego, CA, USA). Continuous variables between two groups were compared by the nonparametric Wilcoxon rank sum test, while comparisons among three or more groups were conducted by the Kruskal-Wallis test. Prognosis and patient survival were compared using Kaplan–Meier survival analysis and the log-rank test. Univariate and multivariate Cox regression (R package “survival”) analyses were used to identify clinical traits with prognostic potential in the high- and low-risk groups.
3 Results
3.1 GBM-Associated DE-PARGs
3.1.1 A Total of 131 DE-PARGs in GBM Were Screened
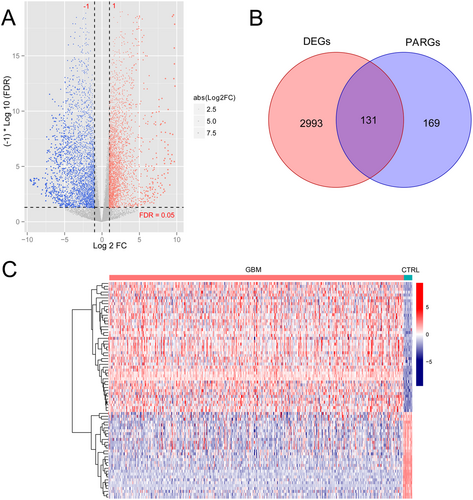
First, a total of 3124 DEGs in GBM versus normal control, including 1402 upregulated genes and 1722 downregulated genes, were obtained (Figure 1A). After combining with 300 PARGs from previously published research, 131 DE-PARGs were obtained (Figure 1B). The heatmap showed obviously different expression levels of 131 DE-PARGs in GBM and normal control (Figure 1C).
3.1.2 23 DE-PARGs Related With GBM Status Were Screened
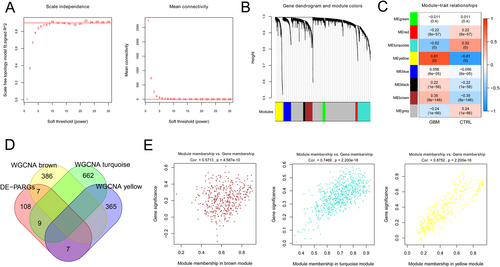
As shown in Figure 2A, when the square value of the correlation coefficient reaches 0.9 for the first time, power equals 10. The dissimilarity coefficient between nodes was calculated, and a systematic clustering tree was obtained. The minimum number of genes for each module and cutHeight were set as 100 and 0.995, respectively. Figure 2B shows that eight modules are obtained. Afterward, the correlation between the calculation module and the disease state was analyzed, and three modules with correlation coefficients higher than 0.3 were obtained, including brown, yellow, and turquoise (Figure 2C). Figure 2D shows that 23 overlapping genes in the modules of brown, yellow, and turquoisewere defined as GBM-related DE-PARGs. Meanwhile, the correlation between gene significance (GS) and module membership (MM) in brown, yellow, and turquoise was assessed (Figure 2E).
Furthermore, functional analysis (Figure S1) showed that 23 GBM-related DE-PARGs were enriched in 10 biology process terms, such as “apoptotic process,” “regulation of inflammatory response,” and “positive regulation of apoptotic process,” six cellular component terms, seven molecular function terms, and seven KEGG pathways, such as “pathways in cancer,” “NOD-like receptor signaling pathway,” and “Proteoglycans in cancer.”
3.2 PARGsScore Might Be a Valuable Prognosis Marker for GBM
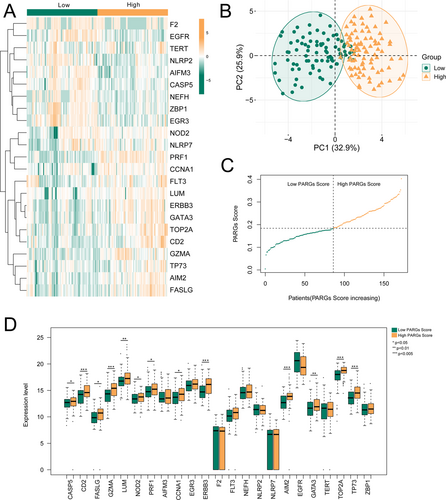
PARGsScore was obtained based on the expression levels of 23 GBM-related DE-PARGs, and then, the patients were divided into high- and low-PARGsScore groups according to the median value of PARGsScore. Figure 3A shows that 23 GBM-related DE-PARGs in the high- and low-PARGsScore groups had obviously different expression levels. The results of PCA showed that the high- and low-PARGsScore groups could be clearly distinguished (Figure 3B). Meanwhile, the values of PARGsScore in the high- and low-PARGsScore groups are shown in Figure 3C. Furthermore, the expression levels of 12 genes were significantly higher in the high-PARGsScore group than in the low-PARGsScore group, including CASP5, CD2, FASLG, GZMA, LUM, NOD2, PRF1, RRF1, CCNA1, ERBB3, AIM2, GATA3, TOP2A, TP73 (Figure 3D).
Furthermore, PARGsScore of GBM was significantly higher than that in control from TCGA, which was also confirmed in samples from GSE108474 (Figure S2). Meanwhile, ROC based on PARGsScore had an AUC of 0.937 in TCGA, and the AUC of ROC in GSE108474 was 0.868.
3.3 Immunological and Biological Functional Characteristics of Different PARGs Scores
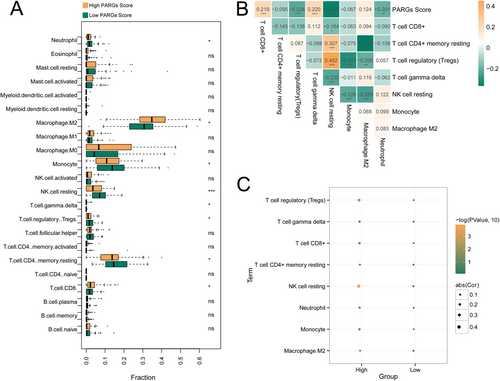
As shown in Figure 4A, eight kinds of immune cells of GBM versus control had significant differences, including T cell CD8+, T cell CD4+ memory resting, T cell regulatory (Tregs), T cell gamma delta, NK cell resting, Monocyte, Macrophage M2, and Neutrophil. The association of the eight immune cells and PARGsScore was shown in Figure 4B, and PARGsScore was negatively related to Tregs, NK cell resting, and Neutrophil, and positively related to T cell CD8+. Furthermore, no significant association was found between PARGsScore and immune cells in the low-PARGsScore group. Notably, in the high-PARGsScore group, PARGsScore was negatively related to Tregs, NK cell resting, and Neutrophil, and positively related to T cell CD8+ (Figure 4C).
Then, functional analysis showed that 73 KEGG pathways were significantly different between high- and low-PARGsScore groups. Moreover, the heatmap of KEGG pathways enriched by high- and low-PARGsScore groups was shown in Figure S3A. The high-PARGsScore group was significantly enriched in 323 GO items (Figure S3B), and the low-PARGsScore group was significantly enriched in 23 GO items (Figure S3C).
3.4 Five DE-PARGs–Based Signature Is a Valuable Model for Predicting GBM Prognosis
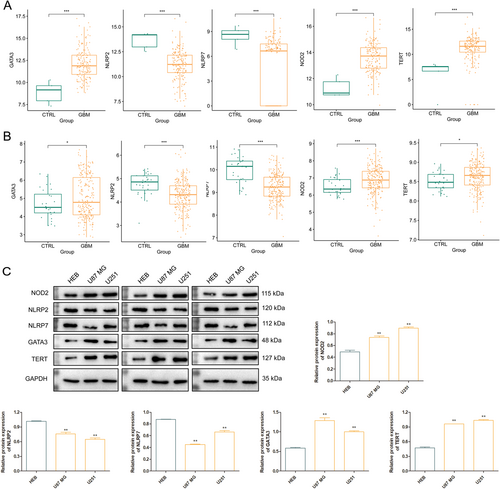
Single-factor Cox regression analysis was used to screen DE-PARGs that are significantly correlated with survival prognosis, and seven genes significantly correlated with GBM survive. After LASSO algorithm for screening optimal gene combinations, five optimal DE-PARGs combination were obtained, including NOD2, NLRP2, NLRP7, GATA3, and TERT (Figure S4). According to the previous functional enrichment of DE-PARGs, NOD2 and NLRP7 were involved in the KEGG pathway of “NOD-like receptor signaling pathway,” NOD2, NLRP2, and NLRP7 were involved in the GO-BP term of “regulation of inflammatory response,” GATA3 and TERT were involved in the GO-BP term of “positive regulation of miRNA transcription,” and TERT was involved in the KEGG pathway of “Pathways in cancer.” The expression levels of NOD2, GATA3, and TERT were significantly higher while the expression levels of NLRP2 and NLRP7 were significantly lower in GBM samples compared with those in control samples (p < 0.05) in both TCGA (Figure 5A) and GSE108474 (Figure 5B). In addition, we validated the protein expression level of these genes using western blot and confirmed their significantly higher or lower expression levels at protein level (Figure 5C). KM showed that low expression levels of these five DE-PARGs had better survival performance (Figure S5).
Furthermore, RS values of five DE-PARGs in TCGA and CGGA were calculated, and the samples were divided into high- and low-risk groups by median RS value. Figure 6 confirmed that the low-risk group had better survival performance as compared with that in the high-risk group. ROC of 1-year, 3-year, and 5-year overall survival had AUC of 0.876, 0.832, and 0.820 in TCGA, and ROC of 1-year, 3-year, and 5-year overall survival had AUC of 0.833, 0.798, and 0.777 in CGGA.

3.5 Chemotherapy, Pharmaceutical Therapy, and RS Model-Based Nomogram Survival Model Can Accurately Predict the Survival Performance of GBM
Three clinical prognostic factors were selected as individual prognostic factors using the Cox regression model based on nine risk factors, including chemotherapy, pharmaceutical therapy, and RS model (Table 1). The KM curve showed significantly better survival time in patients with chemotherapy and pharmaceutical therapy (Figure S6).
| Clinical characteristics | Univariables Cox | Multivariables Cox | ||||
|---|---|---|---|---|---|---|
| HR | 95% CI | p | HR | 95% CI | p | |
| Age (years) | 1.029 | 1.014–1.045 | 1.34E-04 | 1.008 | 0.991–1.026 | 3.47E-01 |
| Gender (male/female) | 0.987 | 0.683–1.425 | 9.43E-01 | — | — | — |
| Radiotherapy (yes/no) | 0.163 | 0.0986–1.269 | 8.88E-02 | — | — | — |
| Chemotherapy (yes/no) | 0.311 | 0.199–0.487 | 7.00E-08 | 0.277 | 0.178–0.497 | 3.73E-06 |
| Hormonal therapy (yes/no) | 1.194 | 0.763–1.868 | 4.37E-01 | — | — | — |
| Pharmaceutical therapy (yes/no) | 0.408 | 0.274–0.608 | 5.85E-06 | 0.411 | 0.269–0.624 | 3.18E-05 |
| Targeted therapy (yes/no) | 0.883 | 0.525–1.484 | 6.34E-01 | — | — | — |
| Recurrence (yes/no) | 0.766 | 0.429–1.368 | 3.66E-01 | — | — | — |
| RS model | 1.911 | 1.327–2.751 | 4.20E-04 | 2.637 | 1.729–4.022 | 6.75E-06 |
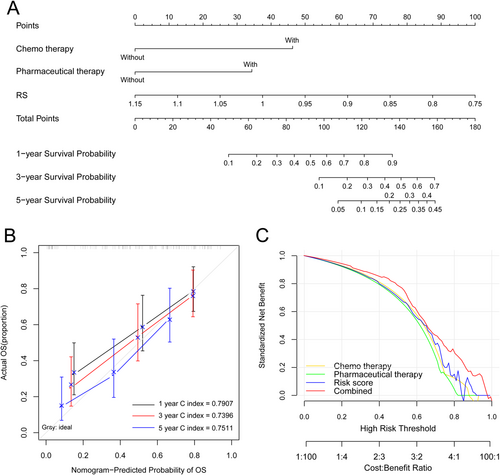
A clinical nomogram was further conducted for predicting 1-year, 3-year, and 5-year survival probability in patients with GBM. RS contributes most to survival probability, followed by chemotherapy and pharmaceutical therapy (Figure 7A). Then, the ability of the model is measured by the C index. The nomogram could accurately predict the survival performance of GBM with a 1-year C index of 0.7907, a 3-year C index of 0.7396, and a 5-year C index of 0.7511 (Figure 7B). The combined three individual prognostic factors-based nomogram had a better overall net benefit (Figure 7C).
3.6 Five DE-PARGs–Related Immune Cell Infiltration and Functional Analysis of Five DE-PARGs–Related Genes
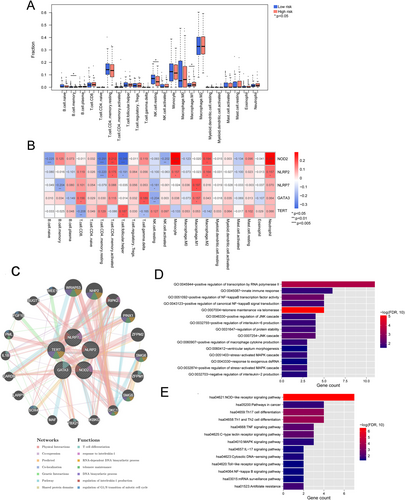
The infiltration of immune cells in high- and low-risk groups was compared, and the results showed that three kinds of immune cells in the two groups had significant differences, including B cell memory, NK cell resting, and macrophage. M1 (p < 0.05, Figure 8A). Then, the correlation between immune cell infiltration and five DE-PARGs was analyzed, and NOD2 was significantly related to eight kinds of immune cells (Figure 8B). Thereafter, based on the GeneMANIA network, five DE-PARGs were significantly related to 20 genes, such as WRAP53, NHP2, RIPK2, etc. (Figure 8C). These genes were significantly enriched in 15 GO biological processes, such as telomere maintenance via telomerase, positive regulation of transcription by RNA polymerase II, and positive regulation of NF-kappaB transcription factor activity (Figure 8D). Meanwhile, these genes were significantly enriched in 13 KEGG pathways, such as the NOD-like receptor signaling pathway, Th1 and Th2 cell differentiation, and Th17 cell differentiation (Figure 8E).
3.7 Mutation Signatures of Five DE-PARGs
The mutation information of GBM samples from TCGA was downloaded from GDC database. Figure S7 shows that missense mutation occurs in more than 25 patients, followed by nonsense mutation and frame shift ins. The variant type included SNP and INS, and C>T occurred in 33 samples. The mutation of five DE-PARGs was observed among 17 samples out of 27 samples. In detail, NLRP7 mutation was observed in 26% of samples, NLRP2 mutation in 22% of samples, followed by TERT (19%), NOD2 (11%), and GATA3 (4%).
3.8 Subjects in the Low-Risk Group May Achieve More Benefit From Immune Checkpoint Therapy
Based on TIDE database, the response of GBM in TCGA was predicated by TIDE score, and the patients were divided into responder and non-responder. Figure S8 shows that responders have better survival performance as compared with non-responders. In the responder group, 42 patients were involved in the high-risk group, and 46 patients were involved in the low-risk group. In the non-responder group, 39 patients were involved in the high-risk group, and 35 patients were involved in the low-risk group. As compared with the non-responder group, the responder involved a higher ratio of low-risk subjects.
3.9 The Response of GBM to Cisplatin, Gefitinib, and Vorinostat Could Be Estimated by Five DE-PARGs–Based Signatures
IC50 values for 19 small molecule drugs were obtained using R4.3.1 pRRophetic, and three drugs between high- and low-risk groups had significant differences, including Cisplatin, Gefitinib, and Vorinostat (Figure 9A–C).
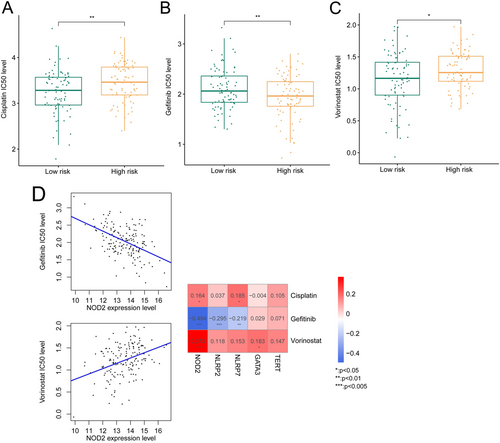
Furthermore, the association between IC50 values for Cisplatin, Gefitinib, and Vorinostat and expression levels of five DE-PARGs was assessed. We observed that NOD2 expression level was positively related to IC50 values for Cisplatin and Vorinostat, and negatively related to IC50 values for Gefitinib (Figure 9D).
4 Discussion
GBM, as one of the most aggressive diffuse astrocyte lineage gliomas, remains incurable. The pathogenesis of the disease is closely mediated by genetic factors and epigenetic changes. Multiple molecular markers have been published facilitating the understanding of tumor processes and the improvement of GBM therapy, such as ATRX, TERT, TP53, and BRAF V600E. These molecules have been reported as prognostic and predictive biomarkers. Meanwhile, these factors were involved in multiple regulated cell death programs. PANoptosis, proposed by Malireddi et al. in 2019, is characterized by these well-defined PCD pathways, but cannot be explained by any of them alone [6]. Previous evidence has reported that PANoptosis is closely related to host immune responses and dysregulated PARGs were highlighted in the development process of GBM [9, 10]. In the present study, the RS model consisting of five DE-PARGs was constructed, including NOD2, NLRP2, NLRP7, GATA3, and TERT. The nomogram model confirmed that RS contributed most to survival probability, followed by chemotherapy and pharmaceutical therapy. Three kinds of immune cells between high- and low-risk groups had significant differences, including B cell memory, NK cell resting, and macrophage M1. Subjects in the low-risk group may achieve benefits from immune checkpoint therapy, and the response of GBM to Cisplatin, Gefitinib, and Vorinostat could be estimated by five DE-PARGs–based signatures.
Studies have shown that inhibition of PANoptosis is an important cause of malignant cell metastasis and the unlimited invasion and proliferation. In the present study, five DE-PARGs, including NOD2, NLRP2, NLRP7, GATA3, and TERT, were demonstrated as differentially expressed genes related with GBM prognosis. NOD2 and NLRP7 were involved in the KEGG pathway of “NOD-like receptor signaling pathway,” NOD2, NLRP2, and NLRP7 were involved in the GO-BP term of “regulation of inflammatory response,” GATA3 and TERT were involved in the GO-BP term of “positive regulation of miRNA transcription,” and TERT was involved in the KEGG pathway of “Pathways in cancer.” NOD2 is a member of the intracellular NOD-like receptor family, which could promote proinflammatory activation by detecting conserved motifs in bacterial peptidoglycan. In breast cancer, up-regulated NOD1 and NOD2 levels have been observed, which reduces cell proliferation by mediating NF-κB and MAPK signaling pathways [39]. Previous evidence confirmed the relationship between increased probability of developing GBM and single-nucleotide polymorphism in NOD2 [40]. NLRs, as a member of pattern recognition receptors, play roles in tumor pathology [41] by regulating inflammation, cell proliferation, and transcriptional reprogramming of immune genes [42]. Increased NLRP12 expression have been observed in human glioma tissue, which affect cellular proliferation [43]. Both NLRP2 and NLRP7 are responsible for innate immune and the pro-inflammatory cytokines production, such as IL-1β, and these processes could regulate tumor progression and microenvironment [44]. However, the role of these two genes in GBM remains largely unknown. GATA3 is a zinc-binding transcription factor involved in many human tissue type differentiation, which is one of the gene signatures effective for GBM prognosis and the signature would help us understanding target pathways for immunotherapy in GBM [45]. Previous data demonstrated that GATA3 was a key target promoting glioma process by involving in miR-374b–related pathways [46]. TERT, as a catalytic subunit of telomerase, was important in chromosomal stability and cancer formation. Upregulated TERT activation has been published in GBM, and the rs2853669 SNP in TERT result in shorter survival for GBM patients [47]. Thereafter, based on GeneMANIA network, the five DE-PARGs were significantly related with 20 genes, such as WRAP53, NHP2, RIPK2, etc. These genes were significantly enriched in multiple important cells signaling, such as NF-kappaB transcription factor activity, NOD-like receptor signaling pathway, and Th1 and Th2 cell differentiation, showing their potential roles in GBM progression. Altogether, these data verified the correction between GBM development and five DE-PARGs.
The five DE-PARGs are closely related to immune checkpoint therapy response, immune cell infiltration, and drug sensitivity. The present analysis showed significant differences in immune cells, including B cell memory, NK cell resting, and macrophage M1. GBM is the most lethal tumor of the central nervous system, and tumor cell infiltration is the critical factor affecting treatment efficacy. In GBM, reduced infiltration was traditionally mediated by a T cell–specific mechanism, whereas macrophages and B cells could effectively infiltrate GBM [48, 49]. Immunotherapeutic agents are now the most challenging treatments for GBM; the potential correlation between DE-PARGs and immune checkpoint therapy response may promote the understanding of the detailed process of tumor-driven immune suppression. These differences in immune cells are mediated by the expression of the five DE-PARGs suggesting that these PARGs may play important roles in regulating immune cell function and participating in immune responses.
In cancer patients, nomogram models were widely used for predicting prognosis. Previously, Bi and his colleagues divided GBM into high- and low-risk groups by a 16-gene cell death index, which was demonstrated as a promising prognostic predictor [50]. Until now, nomogram models based on PARGs in GBM have not been constructed. In the study, the nomogram model confirmed that RS contributed most to survival probability, and predicted 1-year, 3-year, and 5-year survival was consistent with the actual prognosis. All these data showed that the RS-related nomogram had good predictive performance. Although our data revealed the valuable prognostic value of PARGs, the involved mechanism of PANoptosis has not been fully elucidated in GBM, and this should be further confirmed in GBM cell lines or clinical samples.
However, there are some limitations in our study. First, we established the PARGs-based model using only mRNA level data. Almost all biological functions are directly implemented by proteins, and further exploration of the value of this model at the protein level is warranted. Second, although the differential expression of the model genes at the protein level has been validated in this study, further functional validation experiments on these genes at the cellular level and animal model experiments are still warranted for better exploration of the underlying molecular mechanism.
In summary, our data systematically showed the clinical significance of PARGs in GBM. The association between five DE-PARGs and GBM prognosis prediction was revealed, including NOD2, NLRP2, NLRP7, GATA3, and TERT. Furthermore, their roles in predicting immune checkpoint therapy response and chemotherapy drug sensitivity were also confirmed. These findings exhibit the prognostic value of PARGs in GBM and offer new insights for GBM pathogenesis and immune treatment.
Author Contributions
The author takes full responsibility for this article.
Acknowledgments
The authors have nothing to report.
Conflicts of Interest
The authors declare no conflicts of interest.
Open Research
Data Availability Statement
The data that support the findings of this study are openly available in the XENA database at https://xenabrowser.net/datapages/ and Gene Expression Omnibus at https://www.ncbi.nlm.nih.gov/geo/, reference number GSE108474, and Chinese Glioma Genome Atlas (CGGA) database at http://www.cgga.org.cn/download.jsp, reference number mRNAseq_693.


