Reconstitution of CXCR3+ CCR6+ Th17.1-Like T Cells in Response to Ofatumumab Therapy in Patients With Multiple Sclerosis
Funding: This work was supported by National Natural Science Foundation of China (grant number: 82171777), the Natural Science Foundation of Tianjin City (grant numbers: 20JCJQJC00280), and Tianjin Public Health Science and Technology Major Project (grant numbers:24ZXGZSY00030).
Shu Yang, Tian-Xiang Zhang, and Jia Liu have contributed equally to this research
ABSTRACT
Background and Objectives
Ofatumumab, a fully human anti-CD20 monoclonal antibody, is effective in reducing relapses and disability progression in patients with multiple sclerosis. This study aimed to examine immune profile changes associated with ofatumumab in a prospective cohort of Chinese patients with relapsing–remitting multiple sclerosis (RRMS).
Methods
Seventeen RRMS patients were enrolled in this uncontrolled, prospective, observational cohort study (OMNISCIENCE study) and received regular subcutaneous ofatumumab treatments. Immune cell subsets were analyzed by single-cell mass cytometry at baseline and 6 months post-treatment. Peripheral blood monoclonal cells (PBMCs) from a separate cohort of treatment-naive RRMS patients were used for cytokine analysis through ex vivo flow cytometry.
Results
Following ofatumumab treatment, B cells in peripheral blood remained depleted, with surviving cells predominantly consisting of antibody-secreting cells and transitional B cells. Increased proportions of NK cells and myeloid cells, particularly HLA-DRhi intermediate monocytes, were observed, and FOXP3 and CTLA-4 expression on CD4+ T cells was upregulated. Notably, prior to the subsequent dose of ofatumumab, Th17.1-like CXCR3+CCR6+ memory CD4+ and CD8+ T cell clusters increased significantly, with a transient CD20 expression rebound. In vitro experiments further confirmed that ofatumumab reduced these Th17.1 cell subsets and related pro-inflammatory cytokines.
Discussion
These findings suggest that ofatumumab impacts interactions among pathogenic B cells, T cells, and myeloid cells, with Th17.1 cells emerging as a potential direct target within T cells. Persistent and regular infusions of ofatumumab appear necessary to sustain clinical efficacy.
Trial Registration: ClinicalTrials.gov identifier: NCT05414487
1 Introduction
Multiple sclerosis (MS) is a chronic inflammatory and degenerative disease of the central nervous system (CNS), characterized by demyelination, axonal injury, and neuronal loss, which leads to neurological syndromes and physical disability [1, 2]. Traditionally, T cells have been considered primary contributors to inflammatory demyelination in MS. However, growing evidence suggests that interactions among T cells, B cells, and myeloid cells, along with their effector and regulatory subsets, are involved in the pathogenesis of the disease [3].
The dysregulated autoimmune T cell response associated with MS is attributed to an imbalance between proinflammatory effector CD4+ T cells (such as Th1 and Th17) and regulatory CD4+ T cells (Tregs), contributing to disease pathology [2, 4, 5]. Th1 and Th17 cells are known to activate macrophages and microglia, stimulate CD8+ T cells, and promote B cell activation [6-10]. Additionally, Th17 cells can disrupt the blood–brain barrier and induce ectopic lymphoid structures [11-14]. Reduced interleukin (IL)-10 and elevated granulocyte macrophage-colony stimulating factor (GM-CSF) expression in Th1 and Th17 cells correlated with MS disease activity [15, 16]. Among the proinflammatory subsets, Th17.1 cells (CCR6+CXCR3+), which express interferon (IFN)-γ and GM-CSF, represent a significant inflammatory T cell population within the cerebrospinal fluid of MS patients and are closely linked to early disease activity [17].
In recent years, clinical trials have shown that anti-CD20 monoclonal antibodies effectively limit relapsing disease activity [18-20], highlighting the important role of B cells in MS pathogenesis. B cells contribute to MS pathology through multiple mechanisms, including antibody secretion by plasmablasts and plasma cells [21]. They also participate in antigen presentation and T cell activation [22]. Pro-inflammatory cytokines produced by B cells in MS, such as GM-CSF, tumor necrosis factor (TNF)-alpha, and IL-6, drive T cell proliferation and Th1 and Th17 differentiation [23-25]. Anti-CD20 therapies are hypothesized to curb pathogenic T cell responses through direct and indirect mechanisms, including the depletion of CD20+ T cells, a subset recently identified as having pathogenic potential [26]. By inhibiting B cell antigen presenting and cytokine production, anti-CD20 therapy may reduce proinflammatory T cell responses [27]. However, while research has characterized CD20+ T cells and their role in anti-CD20 therapy, more investigation is needed to elucidate the specific T cell subtypes within CD20+ T cells and their response to anti-CD20 treatment.
In this study, we investigated immune landscape changes in a prospective cohort of RRMS patients treated with ofatumumab, with the aim of advancing our understanding of anti-CD20 therapy's impact on autoreactive T cells.
2 Methods
2.1 Study Population
This study was an open-label, prospective, single-arm clinical study. Seventeen patients with RRMS were enrolled and followed up at the Department of Neurology of Tianjin Medical University General Hospital between April 2022 and August 2023. The inclusion criteria were as follows: (1) signed informed consent; (2) age between 18 and 55 years; (3) confirmed diagnosis of RRMS according to the 2017 McDonald revised criteria; (4) Expanded Disability Status Scale (EDSS) score between 0 and 5.5; and (5) neurologically stable for at least 1 month before screening and baseline. Exclusion criteria included: (1) primary progressive MS or secondary progressive MS without disease activity; (2) pregnancy or breastfeeding; (3) high risk for syphilis, tuberculosis, or hepatitis B reactivation; (4) a history of malignancy; (5) severe chronic conditions that might interfere with compliance; and (6) treatment with any other disease-modifying therapies (DMTs) for MS within five half-lives of elimination. Clinical data collected included demographic information, disease history, annual relapse rate (ARR), EDSS scores, nine-hole peg test (NHPT), Timed 25-Foot Walk (T25-FW), and Symbol Digit Modalities Test (SDMT) scores. Patients received subcutaneous ofatumumab at Weeks 0, 1, 2, 4, and monthly thereafter. Blood samples were taken at baseline and 6 months post-treatment initiation. All participants underwent enhanced brain MRI scans at screening, 3 months, and 12 months. Gadolinium-enhanced T1 lesions, new or enlarged T2 lesions, and T2 lesion volumes were analyzed by blinded radiologists. Two patients who were on oral teriflunomide discontinued it 1 month before baseline and completed the accelerated elimination protocol with oral cholestyramine for 21 days. Additionally, PBMCs from a cohort of treatment-naive RRMS patients were included as a validation group for in vitro cell culture experiments (Table S1).
2.2 Standard Protocol Approvals, Registrations, and Patient Consents
All participants provided written informed consent and the study received ethics committee approval from Tianjin Medical University General Hospital. The trial was registered on ClinicalTrials.gov (NCT05414487).
2.3 Cytometry by Time-Of-Flight (CyTOF) Experiments and Data Analysis
To characterize immune cell phenotypes in PBMCs, we used a CyTOF panel (Table S2) comprising canonical cell surface and intracellular markers. PBMCs were isolated from patients at baseline and 6 months post-treatment. Fresh PBMCs were counted, and then 3 × 10⁶ cells per patient were resuspended in 1.5 mL microcentrifuge tubes for staining. For distinguishing live and dead cells, cells were stained in 0.25 μM Cell-ID Cisplatin-194Pt (Fluidigm) on ice for 5 min, washed, and resuspended in FACS buffer. Cells were blocked in 50 μL block mix on ice for 20 min. Cells were stained with surface antibodies mix, then washed and resuspended in FACS buffer. For mass-based cell detection, cells were stained with 500 μM nucleic acid intercalator iridium (191Ir and 193Ir, Fluidigm) in Fix and Perm Buffer (Fluidigm) overnight at 4°C. For intracellular staining, cells were fixed with Fixation/Permeabilization set (eBioscience) and stained with intracellular antibodies mix. Samples were washed and resuspended to 0.5 million cells/mL in 1 mL ddH2O containing 10% EQTM Four Element Calibration Beads (Fluidigm) and filtered through a 40-mM filter cap FACS tube. Samples were placed on ice and acquired on a Helios mass cytometer. Data were normalized and manually gated with FlowJo software [28]. The X-shift clustering algorithm [29] was used to classify cells into distinct phenotypes based on marker expression. Cell type annotations were assigned based on marker expression heatmaps, and Uniform Manifold Approximation and Projection (UMAP) was used for visualization. We also performed Spearman correlations of the percentage of immune cell subsets with the patient characteristics and clinical data. Significant differences were indicated when p value < 0.05 or when adjusted p value < 0.05.
2.4 Single-Cell RNA Sequencing Analysis
We reanalyzed publicly available single-cell transcriptome data from cerebrospinal fluid (CSF) and PBMCs of MS patients, specifically focusing on CD20+ T cells. Data from seven pairs of MS patients and eight controls across three independent studies (GSE133028, GSE138266, Syn21904732) were integrated [30-32]. The demographic features of the samples included in the analysis were listed in Table S3. Seurat (V4.4.0) was employed for subsequent analysis in the study. We first conducted quality control on all included samples. For samples from GSE133028, quality control metrics were obtained from the original publications, and only cells that passed the quality assessment were included in downstream analysis. In the case of GSE138266 and Syn21904732, cells with fewer than 200 detected genes or belonging to the top 1% of cells with an extreme number of detected genes were excluded. Additionally, for all cells across all studies, those with more than 3% hemoglobin unique molecular identifier (UMI) counts or more than 10% mitochondrial UMI counts were filtered out; meanwhile, genes detected in fewer than three cells were excluded from further analysis. After quality control, we removed cells with extreme gene or UMI counts, ultimately including 29 samples. Data integration was performed using the Harmony method to correct batch effects, and major immune cell types were defined. Clustering was performed on CD20-expressing T cells to identify CD4+CD20+ and CD8+CD20+ subtypes and examine Th1- and Th17-related gene expression.
2.5 Cell Culture and Flow Cytometry
Firstly, different doses of ofatumumab were used to observe the effect of ofatumumab on CD20+ T cell depletion. PBMCs from treatment-naïve MS patients were isolated via density centrifugation and then seeded in 96-well plates at a density of 2 × 10⁵ per well, with a total volume of 200 μL per well. Ofatumumab or human IgG1 isotype control (A2051, Selleck) (2.5, 5, or 10 μg/mL) was added for 24 h. Then cells were acquired and stained with the following antibodies: anti-CD3 (APC; OKT3), anti-CD20 (Alexa Fluor 488; 2H7), and 7AAD (PerCP-Cy5.5) (all from BioLegend). Next, to detect T cell phenotype and cytokine production by T cells, PBMCs from treatment-naive patients were isolated and either treated with or without ofatumumab (2.5 μg/mL) for 24 h. Then cells were stimulated for the last 6 h with or without Dynabeads Human T-Activator CD3/CD28 beads (Gibco) at a bead: cell ratio of 1:3 [31]. For the last 6 h of the stimulation periods, cell stimulation cocktail (Invitrogen) was added to the cell cultures. The cells were thereafter stained with the following antibodies: anti-CD4 (APC; A161A1), anti-CD8 (APC; SK1), anti-CCR6 (APC-Cy7; G034E3), anti-CD45RA (FITC; HI100), anti-CCR3 (BV421; G25H7), anti-CCR7 (PE-Cy7; G043H7), anti-CD3 (PerCP-Cy5.5; OKT3), and then fixed for 20 min at room temperature using fixation buffer and washed twice in permeabilization wash buffer, both from Invitrogen. Finally, cells were intracellularly stained with the following antibodies: anti-IFN-γ (PE; B27), anti-GM-CSF (PE; BVD2-21C11), anti-IL-17A (PE; BL168), anti-Perforin (PE; QA16A02) and anti-Granzyme-B (PE; dG9) (all from BioLegend). Flow cytometric measurements were performed on FACS Aria III (BD Biosciences, San Jose, CA, USA). Data were analyzed using FlowJo software (Version X; TreeStar, Ashland, OR, USA).
2.6 Statistical Analysis
The experimental data were presented as mean ± standard error of the mean (SEM). Statistical analysis of the clinical demographic characteristics of patient groups was conducted using the student paired t test (parametric data) or Wilcoxon paired sign rank test (non-parametric data) for continuous variables, and the Fisher's exact test for categorical variables. To compare cell sub-clusters and in vitro experimental results before and after treatment, paired t-tests were employed for comparing parametric data between the two groups, while Wilcoxon signed-rank tests were used for non-parametric data. The comparison of non-paired experiments between the two groups was conducted using Mann–Whitney U test. Multiple group comparisons were conducted using the Kruskal–Wallis test followed by Dunn's test. A p value < 0.05 was considered statistically significant for all calculations. GraphPad Prism 9 software was used for experimental data analysis and statistical evaluation.
3 Results
3.1 Clinical Characteristics of the Study Cohort
From April 2022 to August 2023, 17 RRMS patients were enrolled in this study. The demographic and clinical characteristics are shown in Table 1. The cohort included 11 female patients (64.7%), with an average age of 34.3 years. Sixteen patients (94.1%) were of Asian ethnicity, and one (5.9%) was Caucasian. The median disease duration before enrollment was 3 years (interquartile range [IQR]: 1–4 years). The median baseline EDSS score was 1 (IQR: 0–2.5). Over 12 months, none of the patients experienced new clinical relapses, while two patients (11.8%) displayed gadolinium-enhancing T1 lesions and new T2 lesions without confirmed disability progression. EDSS scores remained stable for all patients, and significant improvements were observed in NHPT (right-hand test: t = 3.736, p = 0.002), T25-FW (t = 2.13, p = 0.049), and SDMT scores (t = −4.215, p = 0.0007) at 12 months post-treatment (Table 1).
| Demographic (n = 17) | Baseline | Month 12 | p |
|---|---|---|---|
| Age, mean | 34.3 ± 9.9 | ||
| Gender | |||
| Female, n (%) | 11 (64.7%) | ||
| Male, n (%) | 6 (35.3%) | ||
| Race, n (%) | |||
| Asian | 16 (94.1%) | ||
| Caucasian | 1 (5.9%) | ||
| Disease duration, years, median | 3 (1–4) | ||
| Annualized relapse rate before ofatumumab, median | 1.4 (1–2) | ||
| Prior DMT treatment, n (%) | |||
| Teriflunomide | 2 (11.8%) | ||
| Patients with new Gd + lesions | 2 (11.8%) | ||
| EDSS score, mean | 1.2 ± 1.4 | 1.1 ± 1.4 | 0.5 |
| SDMT score, mean | 47.7 ± 10.6 | 53.3 ± 10.3 | 0.0007 |
| T25-FW, seconds, mean | 5.7 ± 1.0 | 5.3 ± 1.0 | 0.049 |
| NHPT (left hand), seconds, mean | 23.4 ± 7.2 | 23 ± 7.6 | 0.747 |
| NHPT (right hand), seconds, mean | 20.2 ± 3.6 | 18.1 ± 3.5 | 0.002 |
- Note: Data are n, n (%), mean ± SD, or median (IQR).
- Abbreviations: DMT, Disease-Modifying Therapy; EDSS, Expanded Disability Status Scale; NHPT, Nine Hole Peg Test; SDMT, Symbol Digit Modalities Test; T25-FW, Timed 25-Foot Walk.
3.2 Overall Impact of Ofatumumab on Peripheral Blood Immune Cell Populations
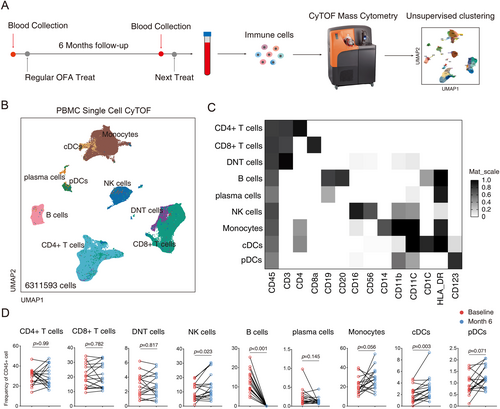
To explore the effects of ofatumumab on immune cell populations, peripheral blood samples were collected at baseline and 6 months post-treatment (before next injection). CyTOF analysis identified nine major immune cell types in PBMCs (Figure 1A–C, Figure S1). Ofatumumab treatment led to a sustained depletion of peripheral blood B cells (p < 0.001), while plasma cell frequency showed a slight decrease that did not reach statistical significance (p = 0.145). The frequency of CD4+ T cells, CD8+ T cells, and double negative T cells (CD3+CD4−CD8−) remained stable, while NK cells increased in frequency (p = 0.023). Among myeloid cells, conventional dendritic cells (cDCs) increased significantly post-treatment (p = 0.003), and monocytes and plasmacytoid dendritic cells (pDCs) also showed upward trends (p = 0.056 and p = 0.071, respectively) (Figure 1D). Notably, HLA-DRhi intermediate monocytes showed a significant increase (p = 0.002, Figure S2D).
3.3 Ofatumumab Continuously and Effectively Depletes B Cells Before Subsequent Treatment
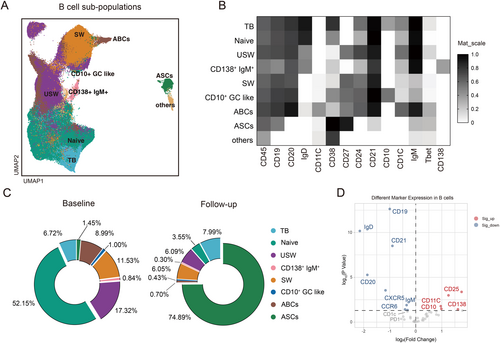
Nine B cell subtypes were identified and analyzed for changes under ofatumumab treatment (Figure 2A,B). Most B cell subtypes, including naive B cells, memory B cells, and age-associated B cells (ABCs) showed a sustained decrease (p < 0.001), while CD27hiCD38hi antibody-secreting cells (ASCs) were unaffected. The residual B cells primarily comprised ASCs (74.89%) and transitional B cells (7.99%) (Figure 2C). CD25 expression was upregulated on reconstituting B cells post-treatment, indicating a mature memory B cell phenotype, whereas CCR6 and CXCR5 expression decreased (Figure 2D).
3.4 CXCR3+ CCR6+ T Cells Exhibit Significant Alterations Before Subsequent Ofatumumab Treatment
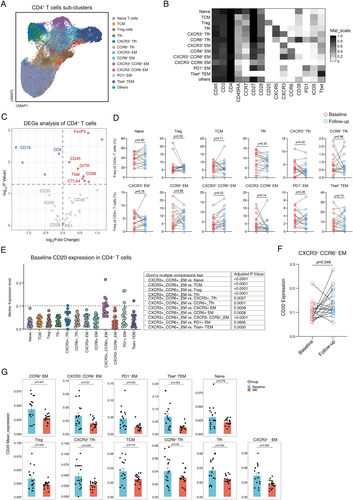
We analyzed T cell subsets to understand ofatumumab's impact on T cells. Thirteen clusters of CD4+ T cells were identified (Figure 3A,B). While regulatory T cell proportions remained stable, FOXP3 expression significantly increased post-treatment, suggesting enhanced regulatory T cell function (Figure 3C,D). Increased expression of CTLA-4, CD86, GITR, and T-bet was also observed, while PD-1, ICOS, CD28, and CD38 levels remained unchanged. Notably, memory T cells expressing CXCR3 and CCR6 (Th17.1 cells) increased significantly before the subsequent ofatumumab dose (Figure 3C). CXCR3+CCR6+ memory CD8+ T cell cluster also showed a significant increase (p = 0.02), while other CD8+ T cell clusters remained stable (Figure S3A–C). We further analyzed the characteristics of CXCR3+CCR6+ memory T cell clusters in RRMS patients. Our findings revealed that the CXCR3+CCR6+ memory CD4+ T cell cluster showed the highest levels of CD20 protein expression at baseline before treatment (Figure 3E). Additionally, within the CD8+ T cell clusters, the baseline CXCR3+ CCR6+ memory CD8+ T cell cluster also exhibited increased expression of CD20 compared to other CD8+ T cell clusters (Figure S3D). It is noteworthy that following ofatumumab treatment, there was a significant increase in the expression levels of CD20 observed in CXCR3+CCR6+ memory CD4+ T cell cluster (p = 0.0457, Figure 3F) and CXCR3+CCR6+ memory CD8+ T cell cluster (p = 0.04, Figure S3E), while nearly all other T cell clusters exhibited a decrease in CD20 expression levels (Figure 3G, Figure S3F).
3.5 Characteristics of CXCR3+CCR6+ Memory T Cells Influenced by Ofatumumab
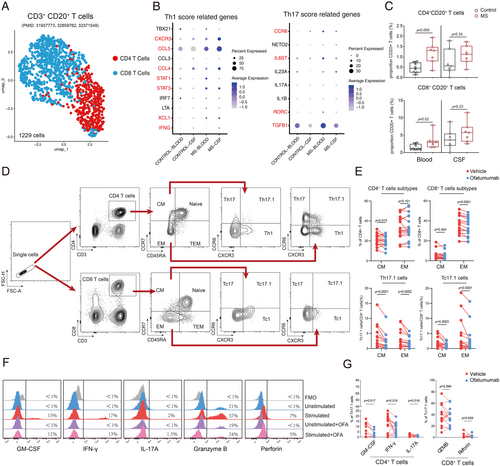
Previous studies suggest that CD20+ T cells play a role in MS pathogenesis, potentially due to increased regeneration post-CD20 depletion [33]. We previously observed an increase in the proportion of Th17.1 cells in patients undergoing ofatumumab treatment prior to their next scheduled treatment, accompanied by elevated levels of CD20 expression compared to other T cell clusters. This prompted us to investigate whether this response was indicative of a suboptimal therapeutic effect of ofatumumab on this particular cell subtype or if the Th17.1 cell subset possessed a heightened capacity for CD20 regeneration. We first reanalyzed the previously published CSF and peripheral blood single-cell RNA sequencing samples from 7 RRMS patients and 8 controls. After integrating the data, we identified 1229 T cells expressing both CD3 and CD20 for clustering. A comparison revealed that, compared to controls, CD20+ T cells in the peripheral blood and CSF of MS patients showed an increased expression trend of Th1- and Th17-related genes such as CXCR3, CCR6, STAT1, STAT3, IL-6st (Figure 4B). Additionally, there was a significant increase in the proportion of CD20+ T cells in the blood and an upward trend in the CSF (Figure 4C). Ex vivo ofatumumab treatment successfully depleted CD3+CD20+T cells (Figure S3A,B). We also investigated the impact of ofatumumab on T cell subpopulations and observed a significant reduction in the proportion of CD4+ central memory (CD45RA−CCR7+) subset, as well as a decrease in the proportion of CD8+ effector memory (CD45RA−CCR7−) subset following treatment (Figure 4E). Given that the Th17.1 subset consists primarily of central and effector memory cells [17], we next examined changes within these subtypes. We found a significant decrease in both CD4+ and CD8+ subsets of Th17.1 cells post treatment (Figure 4E), with decreased GM-CSF, IFN-γ, and IL-17A following ofatumumab treatment (Figure 4F,G). However, no difference was observed in the proportion of granzyme B and perforin positive cells in CD8+ Tc17.1 cells (Figure 4F,G).
3.6 Correlation Between Immune Cell Clusters and Clinical Characteristics
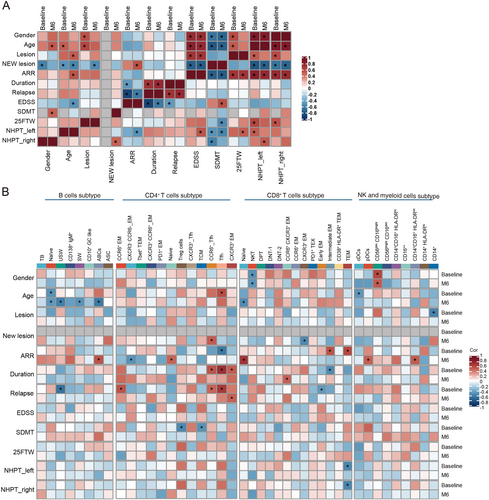
We performed further correlation analysis to explore the relationship between the changes of immune cell phenotypes and disease control in our patient cohort. First, we observed that patient age and ARR were positively correlated with EDSS scores, T25-FW and NHPT results at baseline and post-treatment respectively, but negatively correlated with SDMT scores. The baseline intracranial lesion load was positively correlated with EDSS and NHPT scores (Figure 5A). These findings suggest that increased age, ARR, and intracranial lesion load are associated with worse disability outcomes. Next, we found that patient age was negatively correlated with the frequencies of reconstituted naive B cells, switched memory B cells (SW), unswitched memory B cells (USW), and ABCs after ofatumumab treatment, indicating a decline in B cell reconstitution capacity with age. Furthermore, multiple CD4+ T cell subtypes showed significant positive correlations with clinical disease activity at baseline. Specifically, the frequencies of follicular helper T cells (Tfh), CCR6+ Tfh, and CCR6+ effector memory cells were positively correlated with disease duration and relapse history at baseline, but these correlations were significantly decreased after ofatumumab treatment (Figure 5B).
4 Discussion
This study examined the effects of ofatumumab on immune cell populations in a prospective cohort of RRMS patients, demonstrating its efficacy in reducing relapses and disability progression in an Asian cohort. Evidence increasingly supports the notion that T cells, B cells, and myeloid cells, as well as their interactions, play roles in MS pathogenesis. Our findings align with previous studies, showing that ofatumumab effectively depletes B cells, with repopulating B cells primarily consisting of antibody-secreting cells and transitional B cells. The increases observed in NK cells and HLA-DRhi intermediate monocytes post-treatment highlight the interplay between B cells and myeloid cells in the context of CD20 depletion.
After ofatumumab treatment, B cells in MS patients are mainly composed of antibody-secreting cells and transitional B cells. Transitional B cells are the least mature B cells capable of migrating from the bone marrow to the periphery [34], and are considered the main repopulating B cell after B cell depletion. Previous studies revealed that repopulating B cells appeared to have an immature and more activated phenotype after anti-CD20 depletion [27, 35]. In our study, B cells highly expressed CD25 and downregulated the inhibitory receptor CTLA-4, displaying a highly activated phenotype and enhanced antigen presentation capacities after ofatumumab treatment. Besides, this study showed a negative correlation between patient age and the frequencies of more differentiated repopulating B cell clusters (naive, SW, USW B cells, and ABCs). The capability to reconstruct B cells seems to reduce with increasing age after anti-CD20 treatment. However, unlike other studies showing that naive and memory B cell frequencies are correlated with EDSS score [35], we did not observe the association, maybe due to the low EDSS score of patients in our cohort.
Anti-CD20 B cell depleting therapy affected the T cell compartment directly or indirectly. The imbalance between the pro-inflammatory and regulatory functions of T cells was considered to contribute to the pathogenesis of MS [3, 36]. The immune regulatory function of Tregs was suppressed in patients with MS, and effector T cells exhibited resistance to the regulatory effect of Tregs [4, 37, 38]. Previous studies revealed that Tregs were increased after anti-CD20 therapy [39]. However, no significant change was detected in the frequency of Tregs in this study. But ofatumumab significantly upregulated the expression of FOXP3 and CTLA-4 on T cells, indicating that it restored the regulatory capacity to pathogenic T cells. Th17.1 cells are a subset identified by CXCR3+CCR6+, co-expressing the transcription factors RORC and T-bet and sharing proinflammatory features of both Th1 and Th17 cells [40, 41]. These cells exhibited a highly activated phenotype and produced large amounts of IFN-γ and GM-CSF. Activated peripheral Th17.1 subsets were capable of infiltrating the CNS to mediate compartmental inflammation [17]. In our study, Th17.1-like CXCR3+CCR6+ memory CD4+ and CD8+ T cell clusters showed a significant increase and upregulated T-bet expression post treatment. This is not consistent with previous studies that suggested ofatumumab might decrease Th17.1-like cells [39]. We speculate that this discrepancy may stem from differences in study design. The prior study used a cross-sectional approach with intravenous administration and samples collected 9–120 days post-infusion. However, our study was based on a longitudinal cohort. The patients received regular monthly subcutaneous ofatumumab injections. Post-treatment blood samples were drawn just before the subsequent treatment of ofatumumab. We found that compared to other T cell types, this subset exhibited a uniquely higher expression of CD20. Notably, CD20 expression on Th17.1 cells showed a rebound increase after ofatumumab treatment, while CD20 on peripheral blood B cells remained at a very low level. Previous studies showed that the frequency of peripheral CD20+ T cells was increased in RRMS [42] with a highly proinflammatory phenotype [27]. They presented in the white matter lesions associated with MS disease severity [43]. The CD20+ T cells also appeared to reconstitute faster than the B cells after B cell depletion therapy [27, 33]. In this study, in vitro experiments demonstrated that ofatumumab effectively eliminated all CD3+CD20+ T cells, leading to a decrease in the proportion of the Th17.1 subset and a reduction in the production of key cytokines (GM-CSF, IL-17A, IFN-γ) by Th17.1 cells. Consequently, it is hypothesized that these changes in Th17.1-like CXCR3+CCR6+ memory subsets may be attributed to a more rapid reconstitution of CD20-expressing Th17.1-like cells following ofatumumab treatment compared to B cells. The Th17.1 subset is also highly responsive to the anti-inflammatory effects of ofatumumab. In this study, multiple CD4+ T cell subtypes including Tfh, CCR6+ Tfh, and CCR6+ EM cells were positively correlated with baseline disease activity. Ofatumumab treatment decreased the correlation strength. This suggests that ofatumumab modulates the immune landscape, attenuates the effects of CD4+ T cell subsets on disease activity, and highlights the therapeutic benefits in MS through modulating the immune landscapes.
There are several limitations for this study. First, we recruited a relatively small number of patients owing to the rarity of MS in the Asian population. Second, given the high efficacy of ofatumumab in the treatment of RRMS, none of the patients in our cohort experienced clinical relapses and disability progression according to the EDSS score. More data will be needed to assess the associations between immune cell clusters and clinical disease activity. Third, only peripheral blood samples of patients were analyzed in our study, and future studies should include CSF to further explore the central and peripheral immune landscapes impacted by ofatumumab in RRMS.
Overall, our findings suggest that ofatumumab treatment effectively depletes CD20+ B cells and also has a deep impact on T cells and myeloid cells. Th17.1 cells may play a crucial role as a component of CD20+ T cells and may represent a subset of autoreactive T cells directly affected by CD20-targeted therapy. These results underscore the need for regular infusions of ofatumumab to sustain clinical efficacy in RRMS.
Author Contributions
C.Z., S.Y., and T.X.Z. designed the study. S.Y. was responsible for patient enrollment, clinical follow-up, and sample collection. S.Y. and T.X.Z. wrote the original manuscript. T.X.Z., J.L., Z.L., and L.Z. conducted the experiments. T.X.Z. performed the statistical analyses. Y.Y.L., B.F., and M.F. assisted with patient sample collection. C.Z. and F.D.S. critically reviewed and revised the manuscript. All authors read and approved the final version of the manuscript.
Acknowledgements
We are grateful to the National Natural Science Foundation of China (grant number: 82171777), the Natural Science Foundation of Tianjin City (grant numbers: 20JCJQJC00280), and Tianjin Public Health Science and Technology Major Project (grant numbers:24ZXGZSY00030) for providing funding support to the study.
Conflicts of Interest
Shu Yang, Tian-Xiang Zhang, Jia Liu, Zhirui Liu, Lijie Zhu, Yan-Yan Li, Bin Feng, Moli Fan, and Fu-Dong Shi declare no conflicts of interest. Chao Zhang received speaker honoraria from Novartis, and his laboratory has received research support from Zai Lab, Novartis, and Roche.
Open Research
Data Availability Statement
The data that support the findings of this study are available from the corresponding author upon reasonable request.


