Progressive brain atrophy and cortical reorganization related to surgery in temporal lobe epilepsy
Abstract
Objective
Epilepsy is associated with progressive cortical atrophy exceeding normal aging. We aimed to explore longitudinal cortical alterations in patients with temporal lobe epilepsy (TLE) and distinct surgery outcomes.
Methods
We obtained longitudinal T1-weighted MRI data in a well-designed cohort, including 53 operative TLE patients, 23 nonoperative TLE patients, and 23 healthy controls. According to seizure outcomes at 24 months after surgery, operative patients were divided into seizure-free (SF) and nonseizure-free (NSF) group. Operative patients were scanned before and after surgery, while nonoperative patients and healthy controls were rescanned with similar interval times. We measured gray matter volume (GMV) in all participants and compared longitudinal cortical alterations among groups.
Results
In nonoperative group, statistically significant GMV decrease was observed in ipsilateral median cingulate and paracingulate gyri and cerebellum crus I when compared with healthy controls. In operative group, postoperative GMV increase was discovered in many regions involving bilateral hemispheres, especially in the frontal lobe, without differences between SF and NSF group. Postoperative GMV decrease was found in ipsilateral inferior frontal gyrus, putamen, thalamus, and insula. GMV decrease in ipsilateral inferior frontal gyrus, putamen, and insula was more significant in SF group.
Interpretation
Progressive cortical atrophy existed in nonoperative TLE patients. Cortical remodeling indicated by postoperative GMV increase may arise mostly from the surgery itself, rather than postsurgical seizure outcomes. More significant GMV decrease in ipsilateral inferior frontal gyrus, putamen, and insula may imply their closer connections with resected regions in seizure-free patients.
Introduction
Epilepsy is one of the most common and serious brain disorders, affecting over 70 million people worldwide.1 As the most common drug-resistant epilepsy in adults,2 temporal lobe epilepsy (TLE) is thought to be a network disorder involving widespread structural alterations beyond the putative temporal lobe structures.3-8 Accumulating evidences show that brain atrophy is a crucial structural characteristic in TLE and the atrophy may progress over time.8-14 Recently, using a machine-learning algorithm (Subtype and Stage Inference, SuStaIn) based on cross-sectional data, we identified three distinct trajectories of brain atrophy in TLE, characterized by initial atrophy from left/right hippocampus or bilateral cortex and then extended to extensive cortical and subcortical regions.15 Furthermore, many clinical features were reported to affect the progression of atrophy exceeding normal aging, including disease duration, seizure frequency, seizure lateralization, and the occurrence of focal to bilateral tonic–clonic seizures (FBTCS).8, 9, 11-13, 16, 17 Even in TLE patients with a prolonged period of seizure freedom after antiseizure medications (ASMs) treatment, progressive gray matter atrophy also existed, suggesting other pathologic mechanisms except recurrent seizures may also contribute to the atrophy.18 Up to now, little has been known about how to prevent or slow ongoing atrophy in epilepsy.
Anterior temporal lobectomy (ATL), a well-established surgical approach for TLE, provides a favorable seizure-free rate of approximately 60–70%.19 However, there was limited evidence about how epilepsy surgery affects cortical atrophy. Longitudinal neuroimaging studies revealed relatively increased gray matter volume (GMV) after TLE surgery, especially in seizure-free patients, suggesting postoperative cortical remodeling or recovery.20-22 In our previous study, we also observed postoperative cortical thickening in seizure-free TLE patients.23 Similar cortical thickness increase was also reported in TLE patients across different operative methods and seizure outcomes, indicating subsequent effect of surgery.24 Even taking normal aging into consideration, no more progressive cortical thinning was found in seizure-free patients, while continued accelerated cortical thinning was observed in patients with postoperative seizures, suggesting successful surgery may prevent progressive cortical atrophy in TLE.25 Nevertheless, postsurgical cortical recovery was not consistently discovered in some other studies. Furthermore, there are still 30–40% carefully selected TLE patients who remain to have seizures after surgery. Underlying mechanism remains unclear, and it remains difficult to distinguish patients who may not benefit from the surgery.
In this present study, we aimed to explore pre- and postoperative GMV alterations in TLE patients with distinct surgery prognosis. At the same time, we enrolled nonoperative TLE patients and healthy controls (HC) for longitudinal comparison. These results may help us figure out the correlation between progressive brain atrophy and surgery outcomes and further confirm cortical remodeling related to surgery.
Materials and Methods
Participants
Patients with unilateral TLE diagnosed according to the International League Against Epilepsy (ILAE) criteria26 were prospectively screened at West China Hospital. Semiology, ictal and interictal EEG, brain MRI and sometimes positron emission tomography (PET) were combined to localize the seizure focus. Patients with normal brain MRI or ipsilateral hippocampal sclerosis (HS) in accordance with EEG findings were included, while patients with other neurological/psychiatric disorders or other structural lesions that may contribute to seizures were excluded. We acquired detailed clinical information and high resolution T1-weighted structural data from all patients.
Anterior temporal lobectomy was advised to all patients after multidisciplinary preoperative evaluation. If patients accepted the surgery, they would be followed up every 3 months for their postoperative seizure outcomes and would be rescanned at 2 years after surgery. According to ILAE classification,27 they were further divided into seizure-free (SF) and nonseizure-free (NSF) group. If patients refused the surgery, they would be also followed up and rescanned after 2 years.
We also included age- and gender-matched healthy controls without any psychiatric or neurological disorders for comparison. They would be scanned twice with similar scanning interval and the same scan protocol.
All participants were native Chinese speakers and were assessed by the Edinburgh Inventory handedness test. This study was approved by the ethics committee on biomedical research, West China Hospital, Sichuan University (ethics number: 2022–906). Informed consent was acquired from all participants.
Image acquisition
All MRI data were acquired from a 3.0 T MRI scanner (Tim Trio; Siemens, Erlangen, Germany) at the MRI center of West China Hospital, Sichuan University. We used a spoiled gradient-recalled sequence in sagittal orientation to obtain the structural data. Detailed parameters were as follows: repetition time/echo time = 1900/2.26 ms; field of view = 256 × 256 mm2; slice thickness = 1 mm; voxel size = 1.0 × 1.0 × 1.0 mm3; flip angle = 9°. An eight-channel phased array head coil was used for all subjects. All participants were instructed to relax with their eyes closed and keep their heads still during the whole scanning. We used foam pads to reduce the head movement and earplugs to reduce the scanner noise.
Image processing
We applied software SPM12 (https://www.fil.ion.ucl.ac.uk/spm/software/spm12/) to process all structural data. Similar to our previous and some other studies,28, 29 we right–left flipped all right-sided TLE images to obtain datasets ipsilateral and contralateral to the seizure focus, and created a symmetric template by averaging the Montreal Neurological Institute (MNI) template and its right–left flipped counterpart. To minimize right-to-left bias when comparing with controls, we also right–left flipped a matched sub-sample of HC according to a reported group-matching algorithm.30
Gray matter volume was estimated using the Computational Anatomy Toolbox (CAT12, http://www.neuro.uni-jena.de/cat/) running in the SPM12, which was proved to be validated and reliable.13, 25 The main preprocessing procedures includes bias field correction, spatial normalization, segmentation, and resampling. For preoperative and nonoperative images, we used nonlinear transformation to normalize them to the symmetric MNI template directly. For postoperative images, to minimize the impact of cerebral cavity and possible brain shift induced by surgery, we manually delineated resection masks in all surgical patients and used affine transformation to co-register to corresponding preoperative images.25 All images were first segmented into gray matter, white matter, and cerebrospinal fluid. The resulting segmented images were then normalized to the symmetric MNI template using nonlinear transformation and resampled into 1.5 × 1.5 × 1.5 mm3 to match the resolution of the standard tissue probability maps. We visually checked all segmentation results to ensure image quality. Finally, an isotropic Gaussian kernel with 8-mm full-width-half-maximum (FWHM) was adopted for smooth and further GMV calculation, after masking out the resection regions in all postoperative images.
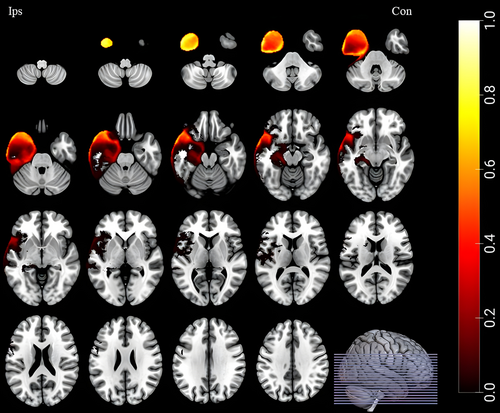
To avoid the bias induced by different ranges of resection, we only enrolled patients underwent standard ATL and compared the resected volumes between SF and NSF group. We did not find any difference in resection regions. A group-level resection mask (including SF and NSF group) was applied for all surgical patients (see Fig. 1 for details).

Statistical analysis
We adopted SPSS (version 26.0) and the statistical analysis tools in CAT12 to perform the statistical analysis. Continuous variables were analyzed using two-sample t-test, while categorical variables were analyzed using the chi-square test or Fisher's exact test. We used 2*4 mixed analysis of covariate (ANCOVA) to detect brain regions with statistically significant interaction among different groups, with age, gender, and scan intervals as covariates. We adopted family wise error (FWE) correction for multiple comparisons. FWE corrected p < 0.05 was considered statistically significant. Because of excessive grouping, we applied post hoc t-test about group-level GMV change (GMV change = post-test GMV – pretest GMV) to find out differences between any two of the four groups. Bonferroni correction was adopted for multiple comparisons. Bonferroni corrected p < 0.05 was considered statistically significant.
Results
Participants
Finally, 53 operative TLE patients (SF/NSF = 37/16) were included in final analysis. Twenty-eight of them participated in our previous study on dynamic changes of cortical thickness in TLE.23 We also included 23 nonoperative TLE patients and 23 healthy controls for comparisons. All participants were native Chinese speakers, right-handed, and scanned twice with similar scanning interval. Detailed clinical characteristics are demonstrated in Table 1.
| SF (n = 37) | NSF (n = 16) | NO (n = 23) | HC (n = 23) | p value | |
|---|---|---|---|---|---|
| Gender (male/female) | 18/19 | 9/7 | 13/10 | 9/14 | 0.627 |
| Age at 1st scan (year) | 25.43 ± 6.98 | 26.56 ± 10.10 | 27.04 ± 7.35 | 28.26 ± 9.21 | 0.623 |
| Scanning interval (month) | 30.41 ± 7.67 | 29.44 ± 7.08 | 37.13 ± 16.14 | 37.35 ± 19.10 | 0.072 |
| Age at seizure onset (year) | 12.27 ± 7.35 | 12.94 ± 7.51 | 16.91 ± 7.98 | – | 0.067 |
| Disease duration (year) | 13.05 ± 9.51 | 13.63 ± 8.02 | 10.13 ± 7.90 | – | 0.364 |
| Seizure focus (L/R) | 19/18 | 11/5 | 9/14 | – | 0.191 |
| Seizure type (FS/FS, FBTCS) | 17/20 | 6/10 | 10/13 | – | 0.850 |
| Seizure frequency (daily/weekly/monthly/yearly) | 3/19/12/3 | 2/11/3/0 | 1/7/13/2 | – | 0.167 |
| History of febrile seizure | 18 (48.65%) | 8 (50%) | 8 (34.78%) | – | 0.514 |
| Number of ASMs (1/2/3/4) | 12/16/7/2 | 5/8/2/1 | 9/9/5/0 | – | 0.801 |
| Hippocampal atrophy on MRI | 34 (91.89%) | 13 (81.25%) | 17 (73.91%) | – | 0.167 |
| Volume of resected region (cm3) | 33.81 ± 12.17 | 32.03 ± 9.21 | – | – | 0.599 |
- ASMs, antiseizure medications; FBTCS, focal to bilateral tonic–clonic seizure; FS, focal seizure; HC, healthy controls; L, left; NO, nonoperative patients; NSF, nonseizure-free operative patients; R, right; SF, seizure-free operative patients.
No statistical differences in age, gender, and scanning interval were found among all patients and controls. There were also no significant differences in age at seizure onset, disease duration, seizure focus, seizure type, seizure frequency, history of febrile seizure, number of ASMs, and MRI findings among SF patients, NSF patients, and nonoperative patients.
Regions with longitudinal GMV changes among groups
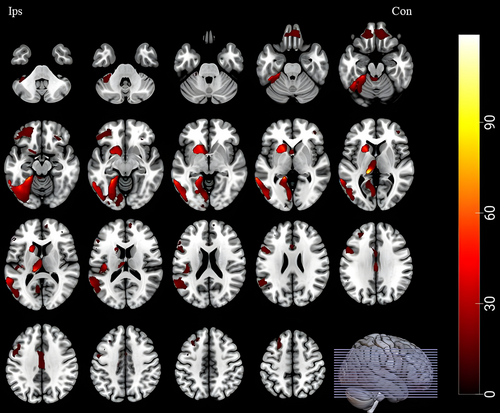
As showed in Figure 2 and Table 2, many brain regions demonstrated significant longitudinal GMV changes among patients (surgery or not) and healthy controls. These regions involved bilateral hemispheres and the cerebellum, including (1) ipsilateral middle frontal gyrus, inferior frontal gyrus (orbital part), inferior frontal gyrus (opercular part), inferior frontal gyrus (triangular part), fusiform gyrus, putamen, thalamus, insula, median cingulate and paracingulate gyri and cerebellum crus I; (2) contralateral medial superior frontal gyrus and middle frontal gyrus; and (3) vermis 3.

| Brain regions | MNI | F value | Cluster size | ||
|---|---|---|---|---|---|
| X | Y | Z | |||
| Ips-middle frontal gyrus | −27 | −36 | 30 | 13.9676 | 120 |
| Ips-middle frontal gyrus, orbital part | −22.5 | 48 | −18 | 22.4169 | 2620 |
| Ips-inferior frontal gyrus, opercular part | −52.5 | 12 | 27 | 22.3514 | 1516 |
| Ips-inferior frontal gyrus, triangular part | −51 | 30 | 12 | 14.0705 | 131 |
| Ips-fusiform gyrus | −25.5 | −45 | −12 | 87.6381 | 9646 |
| Ips-putamen | −16.5 | 12 | 3 | 63.7551 | 1924 |
| Ips-thalamus | −13.5 | −33 | 4.5 | 124.2740 | 898 |
| Ips-insula | −36 | −19.5 | 10.5 | 86.8580 | 426 |
| Ips-median cingulate and paracingulate gyri | −4.5 | −16.5 | 33 | 19.9488 | 897 |
| Ips-cerebellum crus 1 | −27 | −34.5 | −34.5 | 29.8125 | 300 |
| Con-medial superior frontal gyrus | 10.5 | 57 | 15 | 14.0284 | 117 |
| Con-middle frontal gyrus | 39 | 45 | 3 | 12.3345 | 118 |
| Vermis 3 | −1.5 | −43.5 | −22.5 | 19.9693 | 199 |
- Con, contralateral; Ips, ipsilateral; MNI, Montreal Neurological Institute.
Different GMV change pattern in each group
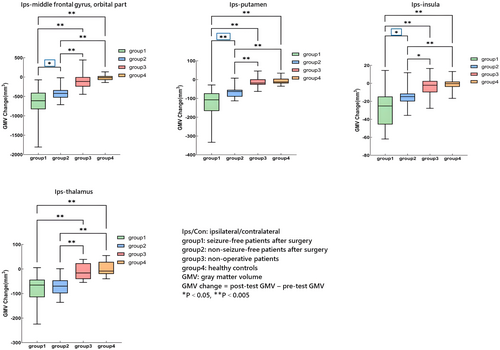
GMV change differences between any two of the four groups were represented in Figures 3 and 4 (see Table S1 in supplementary materials for details).


- Postoperative GMV increase: in operative TLE patients, statistically significant GMV increase was observed after surgery in ipsilateral middle frontal gyrus, inferior frontal gyrus (opercular and triangular part), fusiform gyrus, median cingulate and paracingulate gyri, cerebellum crus I, contralateral medial superior frontal gyrus, middle frontal gyrus, and vermis 3. However, there was no difference between SF and NSF group (Fig. 3).
- Postoperative GMV decrease: in operative TLE patients, significant GMV decrease was discovered after surgery in ipsilateral inferior frontal gyrus (orbital part), putamen, thalamus, and insula (Fig. 4). Furthermore, GMV decrease in ipsilateral inferior frontal gyrus (orbital part), putamen, and insula was more significant in SF group when compared with NSF group (Fig. 4, asterisk framed with blue lines).
- Progressive GMV decrease: in nonoperative TLE patients, we found progressive GMV decrease in ipsilateral median cingulate and paracingulate gyri and cerebellum crus I when compared with healthy controls (Fig. 3, asterisk framed with red lines).
Discussion
In this study, we conducted a well-designed cohort with paired patients and healthy controls to explore longitudinal cortical alterations in TLE patients. We confirmed progressive cortical atrophy in nonoperative TLE patients. More importantly, we revealed different GMV changing patterns in operative TLE patients with distinct postsurgical seizure outcomes.
As expected, in nonoperative TLE patients, we found significant GMV decrease in ipsilateral median cingulate and paracingulate gyri and cerebellum crus I when compared with healthy controls. Widespread gray matter atrophy beyond the mesial temporal structure has been consistently reported in TLE by the literatures, involving the frontal, centro-parietal, cingulate regions, thalamus, and contralateral regions.4, 8, 11-14, 18 Our carefully designed grouping and comparison among four groups may limit more findings of diffuse brain atrophy as previous studies. However, in any case, these results further confirmed progressive cortical atrophy exceeding normal aging in refractory TLE, which may result from un-controlled seizures, ASMs effects, or underlying pathologic mechanism of epilepsy itself.18, 20, 21, 31, 32 Early surgical intervention, leading to seizure remission and ASMs withdrawal, may provide a potential brake for progressive atrophy in epilepsy. It also reminded us to reduce the mean delay of 18 to 23 years between the seizure onset and referral for surgery.33
In operative group, we observed postoperative GMV increases in widespread brain regions, including ipsilateral middle frontal gyrus, inferior frontal gyrus (opercular and triangular part), fusiform gyrus, median cingulate and paracingulate gyri, cerebellum crus I, contralateral medial superior frontal gyrus, middle frontal gyrus, and vermis 3. These areas were located in bilateral hemispheres and the cerebellum, especially in the frontal lobe. It was in accordance with our previous finding of postsurgical cortical thickening23 and other reports about postsurgical GMV increase involving bilateral regions.20-22 Indeed, relative gray matter gain in the frontal lobe was found before, suggesting the predictive value of frontal gray matter abnormalities in TLE.21 In short, these findings further confirmed cortical reconstruction after resective surgery, indicating a compensatory mechanism involving bilateral hemispheres.
Interesting, we did not find any differences in GMV increase between seizure-free and nonseizure-free group. It was inconsistent with previous findings of more significant volume gain20-22 or no more progressive cortical thinning13 in seizure-free TLE patients. In view of the massive structural damage induced by surgical manipulation, surgery-related cortical remodeling (or cortical gain) in both groups may far exceed continued cortical atrophy resulted from ongoing seizures in NSF group. Thus, potential differences were covered up. Another possible reason may be our small sample size (SF/NSF = 37/16) did not have enough power to disclose potential differences. Further studies enrolled more participants were needed to prove our conjecture.
In addition, we discovered longitudinal GMV decrease in both operative groups, beyond progressive brain atrophy in nonoperative group. Related regions contained ipsilateral inferior frontal gyrus (orbital part), putamen, thalamus, and insula. This was in agreement with our previous finding of postsurgical cortical thinning in ipsilateral temporal lobe, fusiform gyrus, caudal anterior cingulate cortex, lingual gyrus, and insula.23 In our previous study on dynamic gray matter changes with five serial timepoints before and after ATL, without normal aging for comparison, we also observed progressive GMV reduction in ipsilateral thalamus, insula, and putamen.28 The surgery itself may be the main cause leading to progressive atrophy in these neighboring regions of resected mesial temporal lobe structures.21-23, 28 Potential effect of reserved ASMs after surgery, and underlying pathological mechanism may also contribute to the progressive atrophy.18, 21, 32
It is worth noting that SF group showed more significant GMV decrease in ipsilateral inferior frontal gyrus (orbital part), putamen, and insula compared with NSF group. We thought there might be two possible reasons. Firstly, previous studies indicated that brain atrophy was more extensive in poor outcome group but limited in good outcome group.21 The diffusion abnormalities were also found to be fewer in good outcome group and limited to ipsilateral temporal and frontal cortex.34 Based on these findings, we speculated the core epileptogenic network of SF patients may be more concentrated in mesial temporal lobe, but with close connections with neighboring regions surrounding temporal lobe because of seizures and epileptic discharges spread. On the contrary, the core epileptogenic network of NSF patients may be more dispersive, not limited in the temporal lobe; thus, the connections between temporal lobe and neighboring regions may be more estranged. Standard anterior temporal lobectomy broke down the core epileptogenic network in SF patients and cut off their close connections with neighboring regions (such as ipsilateral inferior frontal gyrus, putamen, and insula), thus leading to more significant atrophy in these regions. In our previous studies, we also found similar postoperative GMV reduction in these regions. No other regions showed more related to the seizure network just indicated the close connections and important role of ipsilateral inferior frontal gyrus, putamen, and insula in TLE network and postoperative good outcomes. Our relatively small sample size and excessive grouping and comparison may also hinder us to find more related regions other than these key regions. Secondly, although we did not find any statistically significant differences in resection regions or ASMs numbers between SF and NSF group, potential differences (perhaps slightly larger range of resection, or more serious drug-related effect in SF group) could also induce more significant atrophy. More investigations were needed to test our speculation.
Limitations
Several limitations must be noted in our study. Firstly, our relatively small sample size (SF/NSF/nonoperative/HC = 37/16/23/23) may limit the statistical power to reveal all potential differences. Secondly, we right–left flipped a portion of images to increase the statistical power and discuss regions ipsilateral or contralateral to the seizure focus. Potential differences between left-sided and right-sided TLE patients as well as that between the left and right hemisphere were ignored. We would perform independent analysis in each side TLE patients and each hemisphere in our further study enrolling more participants. Thirdly, although we had strict inclusion and exclusion criteria for TLE, we could not totally exclude the possibility that patients with poor outcomes may be multi-focal. Lastly, we failed to conduct cognitive tests to all participants, which may have some relationship with gray matter morphological changes. We would improve this in our further studies.
Conclusion
Progressive cortical atrophy existed in nonoperative TLE patients. Cortical remodeling indicated by postoperative GMV increase may arise mostly from the surgery itself, rather than postsurgical seizure outcomes. More significant GMV decrease in ipsilateral inferior frontal gyrus, putamen, and insula may imply their closer connections with resected regions in seizure-free patients.
Acknowledgements
We are grateful to all the colleagues and participants in this study.
Funding Information
This study was supported by National Natural Science Foundation of China (82471482, 82171443, U21A20393), Natural Science Foundation of Sichuan Province (2022NSFSC1483), Key Project of Science and Technology Department of Sichuan Province (2024YFFK0316), Post-Doctor Research Project, West China Hospital, Sichuan University (2021HXBH062), and The 1.3.5 Talent Excellence Development Project –West China Hospital of Sichuan University (Grants No. ZYGD23032).
Conflict of Interest
None of the authors have any potential conflicts of interest to disclose.
Authors Contributions
W.L., D.Z., and D.M.A. contributed to the concept and study design. W.L., Y.J.Q., X.L.L., H.Z., and Q.Y.G. contributed to the data acquisition. W.L. carried out the statistical analyses and drafted the manuscript. All authors approved the final version.
Open Research
Data Availability Statement
Anonymized data will be shared by reasonable request from qualified investigators.


