Variability of cortico-cortical evoked potentials in the epileptogenic zone is related to seizure occurrence
Funding Information
Odile Feys is supported by a research grant from the Fonds pour la Formation à la Recherche dans l'Industrie et l'Agriculture (FRIA, Fonds de la Recherche Scientifique (FRS-FNRS), Brussels, Belgium). Xavier De Tiège is Clinical Researcher at the FRS-FNRS.
Abstract
Introduction
Cortico-cortical evoked potentials (CCEPs) were described as reproducible during trains of single-pulse electrical stimulations (SPES). Still, few studies described a variability of CCEPs that was higher within the epileptogenic zone (EZ). This study aimed at characterizing the relationship of CCEP variability with the occurrence of interictal/ictal epileptiform discharges at the temporal vicinity of the stimulation, but not during the stimulation, by effective connectivity modifications.
Methods
We retrospectively included 20 patients who underwent SPES during their stereo-electroencephalography (SEEG). We analyzed the variability of CCEPs by using the post-stimulation time course of intertrial standard deviation (amplitude) and the timing of peak amplitude signal of CCEP epochs (latency). Values were corrected for the Euclidian distance between stimulating/recording electrodes. Receiver operating characteristics curves were used to assess the relationship with the EZ. The link between CCEP variability and interictal discharges occurrence, seizure frequency prior to the SEEG recording, and number of seizures during SEEG recording was assessed with Spearman's correlations.
Results
A relationship was demonstrated between the EZ and both the distance-corrected latency variation (area under the curve (AUC): 0.73–0.74) and the distance-corrected amplitude variation (AUC: 0.71–0.72) and both were related with the occurrence of seizures.
Conclusion
Seizures before/during SEEG impact the dynamics of effective connectivity within the epileptogenic network by reducing the variability of CCEP latency/amplitude when the seizure frequency increases. It suggests a strengthening of the epileptogenic network with the occurrence of many seizures. These findings stress the importance of early epilepsy surgery at a time when the network organization has not yet been complete.
Introduction
The presurgical assessment of refractory focal epilepsy may include intracranial electroencephalogram (iEEG) in complex cases, when the noninvasive assessment does not provide sufficient information about the localization of the epileptogenic zone (EZ).1 In order to delineate the EZ with precision, iEEG allows to record spontaneous activity and to perform intracranial stimulations.1
Single-pulse electrical stimulations (SPES), performed through depth or subdural electrodes during iEEG, can induce several types of neural responses.2 The relationship between these responses and the EZ varies according to the type of intracranial EEG but includes induced spikes,3 ripples,4 and cortico-cortical evoked potentials (CCEPs) features.5 CCEPs are also considered as markers of effective brain connectivity during intracranial EEG.6
The EZ can be approximated as the seizure-onset zone (SOZ) and the rapid propagation zone (RPZ; i.e., ictal activity occurring in the first 5 sec of the seizure) in accordance with the description of Munari and Bancaud,7 which does not take into account the resected area nor the postoperative outcome, in contrast with the description of Lüders, which consider the minimal amount of cortex to be resected to reach seizure-freedom.8 The total resected area in seizure-free patients may also be used to approximate the EZ, although this usually overestimates the size of EZ due to surgical approaches and anatomical landmarks of surgical resections. This second approximation does not consider “the minimal amount of cortex” and also leads to the exclusion of patients with surgical contraindication. For these reasons, we used the description of Munari and Bancaud.7
CCEPs were first described as reproducible during or between SPES trains.9 Nevertheless, a variability between two SPES trains performed in the same recording conditions was recently described10 followed by the description of a trial-by-trial variability of CCEPs during a single train of SPES. The CCEP variability during SPES trains was higher within the EZ compared with the noninvolved zones (NIZ)11 and required low-intensity SPES (<5.5 mA).12 Still, the brain mechanism underlying this enhanced variability within the EZ is still unsettled.
In subdural recordings, the morphology of CCEPs is highly stereotyped and involves two successive negative deflections due to the consistent orientation of pyramidal cells. By contrast, CCEPs recorded during stereo-EEG (SEEG) are more polymorphic,2 including both positive/negative deflections13 and up to three consecutive peaks.14 The first peak (D1) is commonly described as occurring between 10 and 30 msec after the stimulation artifact, the second peak (D2) between 80 and 250 msec after the stimulation artifact15 and the third peak (D3) following the second14 (around 500 ms in rodent models16).
This study aimed at characterizing the factors promoting CCEPs variability within the EZ. For that purpose, we first investigated the variability of CCEPs itself during SEEG, its relationship with the EZ and its correlation with the number/frequency of interictal/ictal epileptiform discharges. We hypothesized that the variability of CCEP (i.e., low reproducibility across trials during SPES trains) within epileptogenic networks would be influenced by the occurrence of interictal/ictal epileptiform discharges. The rationale driving this working hypothesis was based on functional neuroimaging and iEEG studies that have evidenced changes in functional connectivity within the epileptogenic networks during the interictal period even in the absence of epileptiform discharges.17, 18 These studies thus suggest that changes functional connectivity can characterize the epileptogenic networks and that they could be at least in part caused by the long-lasting effect of ictal/interictal epileptiform discharges.
Methods
Patients
Twenty-eight patients with refractory focal epilepsy underwent SPES during SEEG at the Hôpital Universitaire de Bruxelles – Hôpital Erasme (Brussels, Belgium) between January 1, 2015 and December 31, 2022, as reported previously.14 The SEEG implantation scheme was based on the conclusion of the multidisciplinary epilepsy surgery meeting after noninvasive presurgical assessment (see19 for further details). SEEG recordings led to the delineation of a circumscribed EZ in 20 of these patients. This study was approved by the Ethics Committee of the HUB Hôpital Erasme (Reference: P2021/302), which waived the need for written consent due to the retrospective nature of the study.
Data acquisition and analysis
The following summarizes acquisition and preprocessing steps previously described in another study from our group.14
Depth electrodes (DIXI Medical, Besançon, France) were implanted, and their localization was assessed with a post-implantation computed tomography (CT; Somatom Force; Siemens, Erlangen, Germany). SPES are applied at 0.9 Hz and 9 mA with a pulse width of 300 μsec during 120 sec (Osiris Neurostimulator, Inomed, Emmendingen, Germany; that keeps the charge density of stimulation within the typical safety limits of 30–57 μC/cm2Ref. [2]), after the occurrence of spontaneous seizures1 (i.e., few of them at the end of the first week of recording and most of them during the second week, while anti-seizure medications were still tapered for most of them). The signal from the stimulated channels could not be recorded simultaneously using this neurostimulator.
A pre-stimulation baseline epoch (duration: 120 sec, sampling rate: 512/1024 Hz) was also collected during the same awake/sleep condition. Data were extracted with the BrainRT software (OSG bvba, Kontich, Belgium), imported in Matlab 2016a (The MathWorks, Inc, Natick, MA, USA), those recorded at 512 Hz were upsampled to 1024 Hz, and finally data were then filtered (bandpass filter: 0.1–250 Hz, notch: 50, 100, 150, 200, 250 Hz). We excluded from further analysis white matter contacts identified visually (i.e., as contacts with low iEEG signal deviation with bipolar montage and by localization on the basis of co-registered postoperative brain computed tomography and preoperative T1-weighted brain magnetic resonance imaging), noisy channels identified as those with abnormally high signal standard deviation (SD) (i.e., exceeding mean + 1.63 SD across all electrodes, as previously described14), and SPES that induced seizures. A white matter contact was used to reference iEEG signal for further analyses. The stimulation artifact was detected as peaks in a global amplitude signal constructed as the average absolute value of channel signals (after bandpass filter: 100–150 Hz) across all channels. The signal was divided into epochs from −100 to 1000 msec around the stimulation artifact and then averaged after baseline correction (from −50 to −10 msec). The three first deflections of the CCEPs (D1, D2, and D3) were detected by identifying its three highest amplitude peaks (excluding the first 7 msec epoch that commonly include the stimulation artifact,2 as confirmed by visual inspection of data). Amplitude minima between peaks were then used to segment the post-stimulus time interval into three windows containing on peak. Statistical significance of D1, D2, and D3 deflections was then established within each window separately whenever a overpassed a statistical threshold14 derived from the maximum statistic principle.20 This statistic was based on a comparison of the CCEP signal of a single intracranial contact with the baseline signal of the same contact, which therefore takes into account the intrinsic variability of each brain area. In brief, the maximum absolute CCEP value across channels and time samples within the window was compared to its null distribution constructed from 2000 permutations whereby a random selection of peri-stimulus epochs were replaced by similar epochs derived from baseline activity, whose 95th percentile yielded the significance threshold fully corrected for false-positive rate across channels and time samples within the window.
Variability detection and measures
We used the post-stimulation time course of intertrial SD of the CCEP epoch signals to estimate the amplitude variation of CCEPs. The statistical significance of amplitude variation was established following a similar strategy than for CCEP deflections, that is, whenever the SD time course of CCEP exceeded the significance threshold of the maximum SD value across all channels and time samples, derived as the 95th percentile of a null distribution of maximum SD obtained by randomly interchanging actual post-stimulus epochs with baseline activity. Again, this approach compares the variability of CCEP to that of the baseline at the same electrodes and therefore takes into account the intrinsic variability of each brain area.
While the reported timing of D1, D2, and D3 peaks were obtained from the averaged CCEP (see above), in order to assess the intertrial latency variation, we detected the peak timing on a per-trial basis, by searching the peak amplitude signal of single-epoch CCEP within a time window centered around the peak detected in the epoch-averaged CCEP signal (D1 ± 25 msec, D2 ± 50 msec, D3 ± 100 msec). The amplitude of the signal was then assessed at this timing on a trial-by-trial basis to further estimate its variation.
As variability is known to increase with the distance separating the stimulating and recording contacts,10 the amplitude and latency variations were also assessed after normalization (i.e., division) by the Euclidian distance between the stimulating and recording contacts (distance-corrected) to correct for both the distance-related variability and the variable brain spatial sampling. Coordinates of contacts at both ends of an electrode were manually determined using Mango software (University of Texas, Texas, USA) and intermediate contacts were interpolated.
The rate of intracranial IEDs from a pre-stimulation baseline epoch (recorded during the same awake/sleep condition and with the same antiseizure medications dosage than SPES) was detected using a hidden Markov model described in.14 The weekly seizure frequency was defined based on the last available outpatient report prior to SEEG implantation and the number of seizures during the second week of SEEG based on the SEEG report (the first week was excluded to mitigate the implantation and anesthetic drugs effect21).
Definition of the EZ
Contacts in the SOZ and RPZ were defined retrospectively (after consensus agreement between O.F., E.R., and B.L.) and labeled as EZ contacts.7 Other contacts were considered as belonging to the NIZ.
Statistical analyses
We performed receiver operating characteristics (ROC) curves for each feature of interest (i.e., variation of latency, distance-corrected variation of latency, variation of amplitude, and distance-corrected variation of amplitude). For each of these features, we obtained a value (timing or SD, uncorrected and corrected for the distance) for each stimulation train and each recording intracranial contact. We compared these values recorded within the EZ after a stimulation within the EZ (EZ-EZ) vs. other combinations (values recorded within the EZ after a stimulation within the NIZ and recorded within the NIZ after a stimulation within both the EZ and the NIZ) across all included patients. We considered a parameter to be a good marker of the EZ if the area under the ROC curve (AUROC) exceeded 0.70,22 and we then defined a parameter threshold for EZ detection using the Youden index (i.e., the optimal point of the ROC curve that offers the bast trade-off between sensitivity and specificity). The median value of threshold values for EZ-EZ CCEPs vs. other CCEPs were reported, as well as the sensitivity and specificity at these threshold values. To mitigate the effect of uneven brain sampling between the EZ and NIZ for distance-corrected measures (given that EZ electrodes tended to be less dispersed than NIZ electrodes), we repeated the same analyses after restricting all recording contacts within a shell containing the majority of EZ contacts (i.e., inter-contact distances from stimulating electrodes within mean ± 1.96 SD of all EZ contacts). To confirm the effect of the latency/amplitude variation itself even after distance-correction, we performed similar ROC curves for the Euclidian distance between the stimulated and recording areas.
We also tested for possible associations of the features of interest with AUROC exceeding the 0.70 threshold mean values across each condition (EZ-EZ, NIZ-EZ, EZ-NIZ, and NIZ-NIZ) with IED occurrence, weekly seizure frequency prior to the SEEG recording, and number of seizures during the second week of SEEG recording using a Spearman correlation, with false discovery rate (FDR) correction.23 We also checked for the association between the variation of amplitude and the variation of latency (to evaluate whether they bring independent information about CCEP variability), between the variation of amplitude and the underlying amplitude of the signal (as the raw amplitude can naturally impact its SD and bias variability measures), and between the weekly seizure frequency prior to the SEEG recording and the number of seizures during the second week of SEEG recording, by using a Spearman correlation.
Results
Twenty patients (11F/9M, mean age: 26 years, range: 8–54 years) with well-delineated EZ were included. Demographic data are detailed in Table 1 and similar to data reported in a previous article from our group.14 Ten electroclinical seizures were elicited during the SPES protocol in 5 patients, all of them following SPES within the EZ. These stimulations were excluded from further analyses due to the cessation of stimulation and subsequent low number of trials to assess the variability.
| Gender, female/male | 11/9 |
| Age at epilepsy onset, years (min–max) | 12 (0–31) |
| Age at SEEG, years (min–max) | 26 (8–54) |
| Mean number of implanted electrodes (min–max) | 14 (8–17) |
| Mean number of intracranial contacts (min–max) | 159 (90–221) |
| Mean number of SPES trains (min–max) | 86 (9–217) |
| Localization of the EZ | |
| Frontal (left/right) | 6 (3/3) |
| Temporal (left/right) | 9 (7/2) |
| Parietal (left/right) | 1 (1/0) |
| Occipital (left/right) | 2 (2/0) |
| Insula (left/right) | 2 (1/1) |
| Surgical resections (with at least 1 year follow-up, Engel I) | 18 (11, 9) |
- SEEG, stereo-electroencephalography; SPES, single-pulse electrical stimulation; EZ, epileptogenic zone.
Of the 54515 CCEPs investigated (including either D1, D2, D3 or a combination of them), a significant variability in amplitude was found for D1 in 7587/30881 CCEPs (25%), D2 in 12192/43328 CCEPs (28%) and D3 in 3946/15832 CCEPs (25%). Figures 1 and 2 illustrate the CCEP variability that can be observed during SPES trains prior to averaging and after averaging.
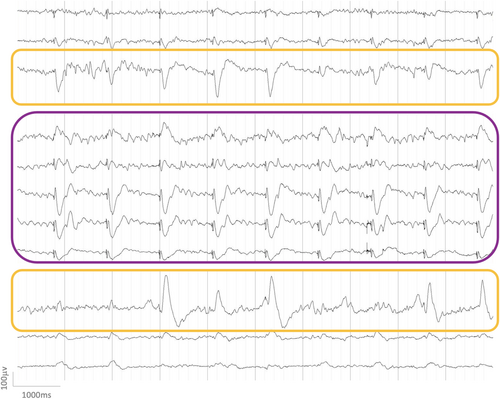
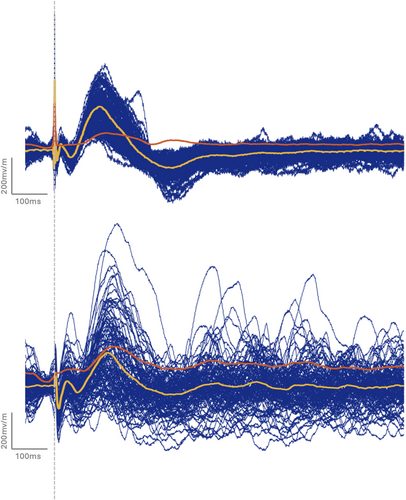
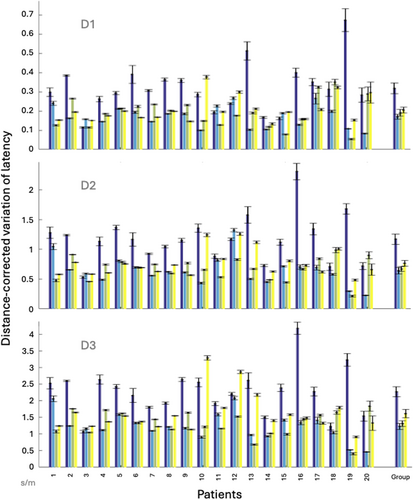
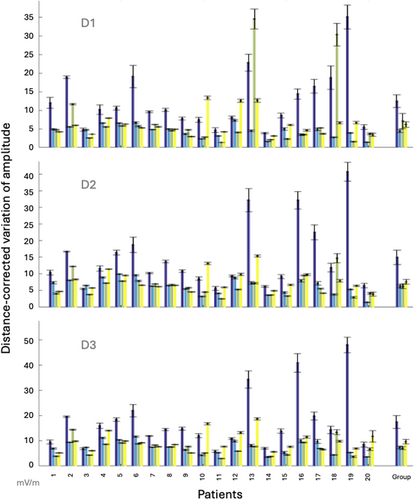
A relationship was demonstrated between the EZ and both the distance-corrected latency variation (AUC = 0.73–0.74, variation from 1.85 to 1.93 times higher in EZ) and the distance-corrected amplitude variation (AUC = 0.71–0.72, variation from 1.93 to 2.25 times higher in EZ) with sensitivities and specificities ranging from 0.57 to 0.77 (Table 2). These relationships with the EZ were not an effect of the distance (AUC = 0.27). Spearman correlations between the variation of amplitude and the variation of latency: ρ = 0.57, P = 9.63 × 10⁻³ for D1, ρ = 7.97 × 10⁻², P = 0.74 for D2, and ρ = 0.13, P = 0.59 for D3, that demonstrate a correlation between these features for D1 only, showing that these two measures provide independent information at least for D2 and D3. Figures 3 and 4 illustrate the variability of distance-corrected latency variation and distance-corrected amplitude variation depending on the area of stimulation and recording (EZ vs. NIZ) individually for each patient. Spearman correlations between the amplitude and the variation of amplitude: ρ = 0.12, P = 0.63 for D1, ρ = 0.44, P = 5.24 × 10⁻² for D2, and ρ = 0.49, P = 2.8 × 10⁻² for D3, that demonstrate a correlation between these features for D3 only. The variability of the distance-corrected latency and amplitude was negatively correlated with weekly seizure frequency before SEEG and the number of seizures during the second week of SEEG (ρ ranges from −0.46 to −0.63 depending on the peak involved; Pcorrected < 4.3 × 10⁻²; Table 3). No significant correlation was found with IEDs or with uncorrected values of latency/amplitude (Table S1). Spearman correlation between the variation of amplitude and latency demonstrates a significant correlation: ρ = 0.54, P = 1.43 × 10⁻².
| AUC (CI) | AUC after NIZ restriction (CI) | Threshold | Sensitivity/specificity | Median values EZ-EZ/other | |
|---|---|---|---|---|---|
| Latency variation | |||||
| D1 | 0.56 (0.55–0.57) | 0.56 (0.55–0.57) | |||
| D2 | 0.59 (0.59–0.60) | 0.58 (0.57–0.59) | |||
| D3 | 0.56 (0.55–0.57) | 0.55 (0.54–0.56) | |||
| Distance-corrected latency variation | |||||
| D1 | 0.73 (0.72–0.74) | 0.72 (0.71–0.73) | 0.18 | 0.67/0.69 | 0.24/0.13 |
| D2 | 0.74 (0.73–0.74) | 0.73 (0.72–0.74) | 0.63 | 0.70/0.66 | 0.89/0.46 |
| D3 | 0.73 (0.73–0.74) | 0.73 (0.72–0.73) | 1.08 | 0.77/0.57 | 1.79/0.95 |
| Amplitude variation | |||||
| D1 | 0.61 (0.60–0.61) | 0.61 (0.60–0.61) | |||
| D2 | 0.57 (0.56–0.58) | 0.56 (0.55–0.57) | |||
| D3 | 0.57 (0.55–0.58) | 0.56 (0.55–0.56) | |||
| Distance-corrected amplitude variation | |||||
| D1 | 0.72 (0.71–0.74) | 0.72 (0.71–073) | 4.77 | 0.64/0.70 | 6.78/3.02 |
| D2 | 0.72 (0.71–0.72) | 0.70 (0.70–0.71) | 6.99 | 0.62/0.69 | 9.06/4.63 |
| D3 | 0.71 (0.71–0.72) | 0.70 (0.70–0.71) | 7.38 | 0.66/0.66 | 10.26/5.32 |
- Data are presented as mean (95% CI). AUC after NIZ restriction refers to similar analyses after restriction to the NIZ contacts that were equidistant from the SPES area than the EZ contacts. Significant data are reported in bold. AUC, area under the curve; CI, confidence interval; NIZ, non-involved zone; EZ-EZ, single-pulse electrical stimulation performed within the epileptogenic zone that elicits cortico-cortical evoked potential within the epileptogenic zone.
| Condition | CCEP parameter | Peak | Ictal/interictal parameter | Spearman correlation |
|---|---|---|---|---|
| EZ-EZ | Distance-corrected variation of latency | D1 | Weekly seizure frequency | ρ = −0.64, P = 2.5e−3 |
| D1 | No. of seizure during 2nd week of SEEG | ρ = −0.57, P = 8.2e−3 | ||
| Distance-corrected variation of amplitude | D2 | Weekly seizure frequency | ρ = −0.55, P = 1.1e−2 | |
| D2 | No. of seizure during 2nd week of SEEG | ρ = −0.46, P = 4.3e−2 | ||
| D3 | Weekly seizure frequency | ρ = −0.53, P = 1.6e−2 | ||
| NIZ-EZ | Distance-corrected variation of latency | D1 | Weekly seizure frequency | ρ = −0.53, P = 1.5e−2 |
- Of note, all correlations (including the nonsignificant correlations) are reported in Table S1. CCEP, cortico-cortical evoked potentials; EZ-EZ, stimulation and response within EZ; NIZ-EZ, stimulation within NIZ and response within EZ.
Discussion
This SEEG study demonstrates that successive CCEPs may have variable amplitudes and latencies during SPES trains. It also shows that the distance-corrected latency/amplitude variation is associated with SPES performed within the EZ and recorded within the EZ either for D1, D2, and D3. Finally, it establishes that CCEP variation negatively correlates with the weekly seizure frequency and the number of seizures during the second week of SEEG, suggesting a direct impact of seizures on CCEP variability.
These results are in line with previous studies that reported the amplitude variation of D1 and D2 during SPES trains.11 It also shows with SEEG the possible amplitude variation of D3 and latency variation of D1, D2, and D3. Moreover, CCEP variability was previously described as correlated with the distance between stimulating and recording intracranial contacts,10 which likely explains the absence of correlation between uncorrected-latency/amplitude variation and the EZ in our study. Additionally, these results introduce some hypotheses about the underlying mechanisms for this variation as described later.
A significant variation was detected in 25% of D1, 28% of D2, and 25% of D3. Previous studies assumed that D1 was the expression of cortico-cortical transmission,24 D2 of cortico-subcortico-cortical transmission,25 and D3 of cortico-subcortico-cortical transmission16 (possibly through dendro-dendritic synapses of the reticular thalamus14, 26), supporting the fact that both cortico-cortical and cortico-subcortico-cortical transmissions are involved in this variability.
CCEP variation negatively correlated with the weekly seizure frequency before SEEG and with the number of seizures that occurred during the second week of SEEG. This could imply that the stability of neural responses elicited by each SPES during SPES trains within the epileptogenic network increases with seizure frequency. Epilepsy and epileptogenesis are associated with changes in synaptic and neuronal density, even in morphologically preserved areas,27 which may contribute to selectively strengthen neural connections within epileptogenic networks to the detriment of other networks. This may be due to either the influence of ictal electrical activity on synaptic maturation and refinement of networks,28 the electrical activity required for the formation of intracortical synapses29 or the depolarization required to silence immature synapses mediated by N-methyl-D-aspartate (NMDA) receptors.28 These changes may also influence the imbalance between excitatory and inhibitory signaling (glutamate and γ-aminobutyric acid (GABA))30, 31 and disturb ionic channels or available ionic concentrations32, 33 related with epilepsy. As antiepileptic drugs modulate both the activation of ionic channels34 and functional connectivity,35 further studies should investigate the replicability of our findings before, during and after anti-seizure medications removal. Moreover, a role of the microglia in the stability of neural connections should not be excluded. Indeed, the seizure-related glutamate release induce the activation of microglia36 (the density of activated microglial cells being correlated with the seizure frequency37) that modifies the phagocytic properties of microglial cells.38 This excessive activation of the microglia may sustain the synaptic impairment.39 The glutamate release may also induce an excessive production of proinflammatory cytokines that alters the inhibitory/excitatory balance and promotes epileptogenesis.40 Similarly to microglia, astroglia is activated by the ictal activity leading to astrogliosis (i.e., structural and functional changes of astrocytic cells41) that can affect the glutamate balance.42
The inverse correlation between D1 latency and seizure frequency (described in our previous study14) could be related to the myelination processes induced by electrical activity in the central nervous system.43 Therefore, it is plausible that a larger number of seizures may increase the myelination of the epileptogenic network, leading to lower latency of CCEPs. On the other hand, patients suffering from a lower seizure frequency probably have weaker or less homogeneous myelination of their epileptogenic network, leading to higher CCEP latency during SPES. That epilepsy is known to be associated with myelin content abnormalities44 supports this hypothesis. Future studies should therefore combine the study of variation and latency of CCEPs in order to investigate simultaneously seizure-related axonal and synaptic/glial modifications that strengthen the epileptogenic network.
We hypothesized that these are long-term changes associated with network reorganization induced by seizures, but this requires further investigation, for instance by repeatedly measuring CCEPs at different points in time in the same patient and assessing the features of interest in relation to the time of seizure occurrence. Another way to assess this hypothesis would be to include patients with the same lifetime number of seizures and seizures of the same duration but different seizure frequency in their epilepsy history, and especially at the time of the SEEG. Nonetheless, this option would be difficult to be implemented due to the difficulty for the patients to properly recognize some focal seizures, to report seizures, and to compare the impact of different antiseizure medications for instance.
Interictal discharges may have a similar role than seizures at a lower scale as they may guide axonal growing, dendritic spine formation, and synaptic strengthening.45 Nonetheless, we found no significant correlations with the rate of interictal discharges, which suggests a much weaker effect compared to ictal activity itself.
Changes in cortical excitability due to intracortical facilitation (i.e., increased amplitude of the evoked response following paired-pulse transcranial magnetic stimulation (TMS)46) or inhibition, depending on interstimulus intervals,47 could represent yet another hypothesis to explain our data. Although most of these stimulations were performed in the motor cortex and not within the EZ,48 the TMS interferes with epileptic intracortical neural networks, leading to changes in cortical excitability.47 As both paired-pulse TMS and SPES studies have described a similar evoked potential modulation pattern,49 we hypothesize that the repetition of SPES may act as paired-pulse intracranial stimulation due to our short interstimulus intervals (i.e., 1.111 sec; compared with 1–10 sec in SPES studies2) leading to intracortical facilitation or inhibition. Electrical conductivity is higher in the EZ than the NIZ,50 so the facilitation/inhibition effect of SPES may be more pronounced in the EZ. The question of either facilitation or inhibition remains unclear for long-latency interstimulus intervals in TMS studies, thus we cannot argue for intracortical inhibition versus facilitation in this case as our interstimulus interval is even longer than those described in most TMS studies (from 151 to 400 msec).52 To confirm this hypothesis, further studies should test the amplitude variation following either various SPES frequencies or TMS targeting the EZ. In the context of this hypothesis, the absence of relationship between IEDs and CCEP variation is unsurprising as the connectivity changes within the epileptogenic network are described in the absence of IEDs as well.53
The correlation highlighted between the weekly seizure frequency prior to the SEEG recording and the number of seizures during the second week of SEEG recording is quite intuitive as these both markers are probably underpinned by the same mechanisms because they are linked to the same epileptogenic network. Keeping them as distinct markers in our statistical analysis might lead to slightly conservative correction for multiple comparisons, but does not prevent the interpretation of significant results.
This study suffers from some limitations. First, SPES-induced seizures were not analyzed further despite their high correlation with the EZ (specificity = 73.02%)54 as SPES were interrupted at the time of seizure detection. Therefore, the exclusion of contacts with SPES-induced seizures possibly decreased the accuracy of the CCEP variation for the EZ. Second, the definition of the EZ we have chosen did not take into account the resected area nor the postoperative outcome, in contrast with the description of Lüders, which consider the minimal amount of cortex to be resected to reach seizure-freedom.8 Third, we corrected values for the distance by division by the Euclidian distance between the stimulating and the recording intracranial contacts (as previously described14). This encompasses two assumptions: it approximates the propagation path as straight and the relationship between SD and distance as linear. Future studies could use structural connectivity to obtain a more realistic approximation of the distance.55. Fourth, we did not take into account that higher amplitude signal may naturally increase SD and slightly bias our results. Nevertheless, we used the conservative maximum statistics, which probably counterbalances this bias. Also, many large amplitude CCEPs were not accompanied with high SD, as confirmed by the absence of correlation between amplitude and its variation, at least for D1 and D2. Fifth, the peak detection on a trial-by-trial basis leads to the detection of low amplitude random peaks that correctly evidences amplitude variation but induces noise in the analysis of the latency variation as trials without substantial CCEP deflection would lead to random peak timing around the averaged CCEP peak deflection.
To conclude, the amplitude and latency of CCEPs may vary within a train of identical SPES. These variations are larger within the EZ but decrease with seizure frequency, possibly due to the reinforcement of neural connections within the epileptogenic networks through synaptic and glial processes according to the seizure occurrence.
Acknowledgement
None.
Authors Contributions
O.F. contributed to the conception and design of the study. O.F., V.W., X.D.T., and N.G. contributed to the acquisition and analysis of data. O.F., V.W., S.S., E.R., B.L., X.D.T., and N.G. contributed to manuscript drafting or revision.
Conflict of Interest
The authors report no competing interests.
Open Research
Data Availability Statement
The data are available from the corresponding author upon reasonable request and after acceptance by the institutional authorities (Hôpital Universitaire de Bruxelles and Université libre de Bruxelles).


