Identification of potential biomarkers for neuromyelitis optica by quantitative proteomics
Abstract
Objective
Neuromyelitis optica (NMO) was a serious autoimmune inflammatory condition affecting the central nervous system. Currently, there was a lack of diagnostic biomarkers for AQP4-IgG-negative NMO patients.
Methods
A comparative proteomic analysis was conducted on the CSF of 10 patients with NMO and 10 patients with non-inflammatory neurological disorders (NND) using tandem mass tagging technology. Differentially expressed proteins (DEPs) were analyzed using bioinformatic methods. The candidate proteins were then validated through ELISAs in a subsequent cohort of 160 samples, consisting of paired CSF and plasma samples from 50 NMO patients, CSF samples from 30 NND patients, and plasma samples from 30 healthy individuals.
Results
We identified 389 proteins via proteomics, screening 79 DEPs. NCAM1, SST and AHSG were selected as candidate molecules for further validation. Compared to NND patients, there were decreased levels of AHSG in CSF and increased levels of NCAM1 and SST in NMO patients. The ELISA results revealed significantly higher levels of AHSG, SST and NCAM1 in the CSF of the NMO group compared to the NND group. Similarly, the serum levels of these three proteins were also higher in the NMO group compared to the healthy control group. It was found that serum NCAM1 levels significantly decreased in patients with non-relapsed NMO compared to patients with relapsed NMO and CSF NCAM1 level increased in patients with bilateral NMO compared to patients with unilateral NMO. Furthermore, CSF SST levels increased in AQP4 antibody-positive NMO patients compared to AQP4 antibody-negative patients.
Interpretation
CSF NCAM1, serum NCAM1 and serum SST may serve as potential biomarkers for NMO patients and aid in the diagnosis of AQP4 antibody-negative NMO patients.
Introduction
Neuromyelitis optica (NMO) is a serious autoimmune inflammatory condition affecting the central nervous system (CNS). It was typified by successive or simultaneous episodes of acute optic neuritis and transverse myelitis optica, leading to blindness, paralysis and even death.1, 2 In 2015, the International NMO Diagnostic Panel incorporated NMO into the category of neuromyelitis optica spectrum disorders (NMOSD).3 Approximately 70–80% of patients with NMO were positive for aquaporin 4 autoantibody IgG (AQP4-IgG).4, 5 In China, NMO is a rare disease with an incidence rate of 0.278 cases per 100,000 person-years. The incidence rate increases with age, and males were affected more often than females (ratio of 4.71).6 The proportion of female patients is much lower in AQP4-IgG-negative patients. The illness could impact individuals of all ages (with a median age of 40), including up to 20% of incidences in either children or adults over 65 years old.7 In AQP4-IgG-negative or AQP4-IgG-unknown states, the diagnosis of NMO was mainly based on clinical symptoms and imaging tests.8 There is significant individual variability in the clinical symptoms of patients with NMO, whether they are AQP4 positive or negative. Optic neuritis (ON) and transverse myelitis (TM) are the primary symptoms of NMO.9 In most cases, NMO begins with an acute episode of ON or TM, and it is relatively rare for both ON and TM to be present at onset. ON may occur unilaterally or bilaterally at the onset of NMO. In patients with AQP4-positive NMO, lesions are characterized by astrocyte defects, IgG and complement deposition and often secondary oligodendrocyte and neuronal deficits.10 However, the pathogenesis of AQP4-negative NMO is unknown.
There was a lack of validated laboratory biomarkers for the diagnosis of NMO. Although AQP4 antibody is considered a sensitive diagnostic biomarker for NMO, its association with various clinical parameters in NMO patients remains controversial. Previous studies have shown that there is no correlation between disease severity and AQP4 antibody titre in patients with NMO, and that there is no difference in AQP4 antibody expression between patients with relapsed and non-relapsed forms of NMO.11 Furthermore, the presence of AQP4-IgG-negative NMO patients urgently requires the exploration of additional biomarkers. Numerous studies have investigated biomarkers for NMO, some of which could be useful for clinical diagnosis and elucidating pathogenesis. In addition to the presence of anti-AQP4 and anti-MOG antibodies, NMO patients also frequently exhibit several non-organ specific autoantibodies including anti-nuclear, anti-cardiolipin,anti-SSA, anti-perinuclear,anti-AQP1 antibodies and anti-neutrophil cytoplasmic.12 A recent study had shown high levels of heparan sulfate and hyaluronic acid in serum and the CSF may be biomarkers of NMO severity.13 Some of the proteins associated with astrocyte damage can also be used as potential markers for NMO such as S100β and GFAP.14, 15
Several studies have been conducted on proteomic testing for patients with NMO. The proteome of CSF immunoglobulin in NMO patients indicated that a significant percentage of intrathecal Ig proteins were generated by intrathecal B-cell populations that consist of clones derived from both neo- and peripheral origins. A study based on two-dimensional gel electrophoresis (2-DE) proteomic analysis showed binding of bead proteins, α-1-B glycoproteins, fibrinogen γ, group-specific component globulins, transthyretin proteins, apolipoproteins A-IV, apolipoprotein E and neurofilament proteins were differentially expressed in CSF of NMO patients.16 These proteins have the potential to function as biomarkers for NMO and facilitate research into its pathogenesis. However, the above proteins lack validation in clinical samples and exploration in pathogenesis. Tandem Mass Tagging (TMT) technology is a chemical labelling method used for the identification and quantification of biomolecules using mass spectrometry (MS). Compared to 2-Dimensional Gel Electrophoresis (2-DE), TMT technology provided greater sensitivity and accuracy.17 Proteomic analysis of CSF is crucial for diagnosing the neurological disorder NMO. This study compared CSF proteins from patients diagnosed with NMO and those with non-inflammatory neurological disease (NND) through TMT-based proteomic analysis. Subsequently, key proteins were screened, and differences in these proteins were validated in a separate cohort using enzyme-linked immunosorbent assay (ELISA). Then, We demonstrated the mechanism of differential expression of NCAM1 in cellular experiments. The key proteins identified could potentially function as biomarkers for clinical diagnosis and aid in the understanding of pathogenesis.
Materials and Methods
Study design and participants
A randomized group consisting of 60 patients with NMO, 40 patients with NND and 30 healthy individuals were enrolled in the study, during the timeframe of January 2020 to January 2021. All enrolled NMO patients met diagnostic criteria regardless of AQP4 antibody negativity or positivity. Based on the latest diagnostic criteria, AQP4 IgG-negative patients must experience at least two different core clinical features and MRI-supported features. One of the three most common clinical features, namely optic neuritis, transverse myelitis or posterior zone clinical syndrome, must be present in at least one clinical event.3 At the time of lumbar puncture and serum collection, all NMO patients were at the time of initial admission and had not received immunomodulatory therapy. However, 30 healthy individuals from the health screening population were chosen at random. CSF samples from 10 patients with NMO and 10 patients with NND were analyzed using proteomic analysis. We then validated the candidate proteins in the remaining 160 samples (including paired CSF and plasma samples from 50 patients with, CSF samples from 30 patients with NND and plasma samples from 30 healthy individuals) using ELISA. Non-inflammatory neurological disorders included stroke, venous sinus stenosis and epilepsy.
Sample preparation
CSF samples (100 μg/sample) underwent digestion through the Filter-Assisted Sample Preparation (FASP) method with slight adjustments according to previous description.17 Each sample was mixed with 200 μL of UA buffer (8 M urea and 150 mM Tris–HCl, pH 8.0), transferred to an Amicon Ultra15 centrifugal filtration unit and centrifuged at 12,000 g for 15 min. Next, add 200 μL of UA buffer and centrifuge at 12,000 g for 15 min. Subsequently, mix the concentrate with 100 μL of 50 mM UA buffer and let it incubate in the dark at room temperature for 30 min. After dilution with UA buffer and two rounds of centrifugation, 200 μL of 100 mM triethylammonium bicarbonate buffer was added and centrifuged at 14,000 g for 20 min. The procedure was duplicated. Subsequently, 8 μL of trypsin buffer (containing 4 μg of trypsin) was added and agitated at a speed of 600 rpm for 1 min. Finally, the samples were digested at a temperature of 37°C for 17 h. The final peptide was collected by centrifugation at a force of 16,000 g for 10 min. Peptides in the CSF were labeled using the TMT 10-plex labeling kit in accordance with the guidelines provided by Thermo Fisher Scientific (USA). TMT tags 126, 127 N, 127C, 128 N and 128C were used to label peptides in the control CSF samples, whereas TMT tags 129 N, 129C, 130 N, 130C and 131 were used for the NMO patient samples.
LC–MS/MS analysis
Peptides were detected using an EASY-nLC 1000 Nano HPLC system and a Q-Exactive mass spectrometer, both manufactured by Thermo Fisher Scientific. The basic RPLC fractionated peptide digests, which had been vacuum-dried, were reconstituted with 0.1% formic acid and loaded onto a trap column (100 μm × 2 cm, Nanoviper) at a rate of 3 μL/min. Peptides were separated using a gradient of 5–30% solvent B, which consisted of 0.1% formic acid in 95% acetonitrile, on an analytical column (75 μm × 50 cm, RSLC C18) for 80 min at a flow rate of 300 nL/min. The run time is fixed to 90 min. The mass spectrometer operates in data-dependent acquisition mode. A comprehensive full-scan MS was conducted within the m/z range of 350–1500 at a resolution of 120,000 at 200 m/z. The automatic gain control (AGC) target value for the MS1 was set to 3,000,000 and the ion fill time was established at 50 ms. The strongest ions with charge states ≥2 were separated every 3 sec. HCD fragmentation with 38% normalized collision energy was then used to fragmented them. The AGC target for MS2 was established at 100,000 and the ion filling time was established at 100 ms. Dynamic exclusion was established at 30s with a 10 ppm mass window. For each sample, two analyses were conducted.
Identification protein
The UniProt.human.fasta protein database search was performed on the acquired mass spectrometry data using the MaxQuant search algorithm via the MaxQuant platform (version 1.6.0.13).18 The MaxQuant software has a minimum reported parent ion fraction (PIF) of 0.75.
Bioinformatics analysis
The criteria used to screen differentially expressed proteins were a multiplicity of difference greater than 2 or less than 0.5 and a p-value less than 0.05. These proteins were then analyzed using a variety of bioinformatics tools. The identified DEPs were analyzed for Gene Ontology (GO) and Kyoto Encyclopedia of the Genome (KEGG) pathway enrichment using the clusterProfiler19 and DOSE20 packages in the R software (version 4.0.3). The “ggplot2” software package was used to visualize the results of the enrichment analysis. The functional interactions among proteins were mapped to illustrate the molecular mechanisms and signaling pathways involved in cellular processes. A network of protein–protein interactions (PPI) for DEPs was created with Search Tool for Retrieving Interacting Genes (STRING11.0, http://www.string-db.org/) database, which is an open-access bioinformatics tool.21 Cytoscape software (version 3.7.2) was then utilized for visualization.22
ELISA analysis
CSF and serum somatostatin (SST), human neural cell adhesion molecule 1 (NCAM1) and α2-HS glycoprotein (AHSG) levels were measured by ELISA according to the manufacturer's instructions (ELISA kits included: SST, NCAMA1, Abcam, USA; AHSG, Abcam, USA). Absorbance values were measured at 450 nm using a microplate reader.
Statistical analysis
Statistical analysis was conducted utilizing SPSS software (version 26.0) and GraphPad prism software (version 8.0). Independent t-test or Wilcoxon test were used to analyze continuous data, whereas categorical data were analyzed using the McNemar test. Receiver operating characteristic (ROC) curve analysis was utilized to assess the diagnostic efficacy of critical proteins.Spearman's rank correlation coefficient and Mantel–Haenszel test were used to examine the correlation between clinical characteristics and important protein quartiles.
Results
Clinical characteristics of patients
The clinical characteristics of the 140 subjects were shown in Table 1. In the discovery cohort, no significant differences were observed in age, gender, CSF-Pro, 24-IgG, CSF-IgG and CSF-ALB levels between NMO and NND patients (p > 0.05). Similarly, in the validation cohort, no significant difference in age and sex was observed between the NMO, NND and HC groups (p > 0.05).
| Variable | Discovery cohort | Validation cohort | |||||
|---|---|---|---|---|---|---|---|
| NMO (n = 10) | NND (n = 10) | p value | NMO (n = 50) | NND (n = 30) | HC (n = 30) | p value | |
| N, CSF; serum | 10;0 | 10;0 | 50;50 | 30;0 | 0;30 | ||
| Age (years) | 43.3 ± 12.52 | 38.2 ± 13.86 | 0.399 | 41.58 ± 15.61 | 41.50 ± 13.04 | 41.60 ± 11.09 | 1.00 |
| Male % | 3 (30%) | 5 (50%) | 0.361 | 35 (70.0%) | 20 (66.7%) | 21 (70.0%) | 0.945 |
| AQP4 IgG positive | 7 (70%) | 32 (64.0%) | |||||
| CSF-Pro (mg/dL) | 36.17 ± 16.80 | 37.03 ± 18.47 | 0.914 | ||||
| 24 h-IgG | 8.96 ± 16.64 | 1.68 ± 3.91 | 0.194 | ||||
| CSF-IgG (mg/mL) | 0.04 ± 0.03 | 0.03 ± 0.02 | 0.462 | ||||
| CSF-ALB (mg/dL) | 0.16 ± 0.12 | 0.28 ± 0.16 | 0.067 | ||||
- NMO, neuromyelitis optica; NND, non-inflammatory neurological disease.
Proteomic analysis
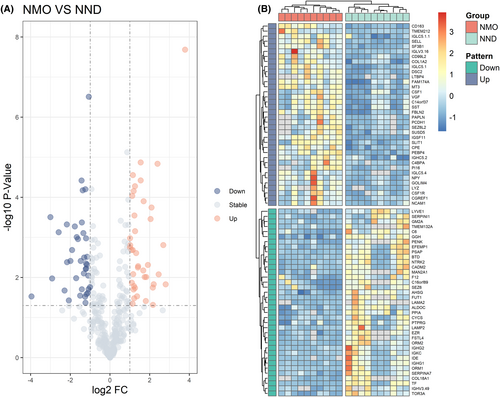
A total of 389 proteins were identified in the discovery cohort. The screening criteria for DEPs were based on a fold change in protein expression between the NMO group and the NND group. Specifically, a fold change greater than 2 or less than 0.5 with a P value of less than 0.05 was considered significant. We screened 79 DEPs associated with NMO occurrence, of which 40 proteins were up-regulated and 39 proteins were down-regulated in comparison to NND patients (Fig. 1A). The heatmap of all 79 DEPs presented two clusters with contrasting accumulation patterns (Fig. 1B).
Functional enrichment analysis of DEPs
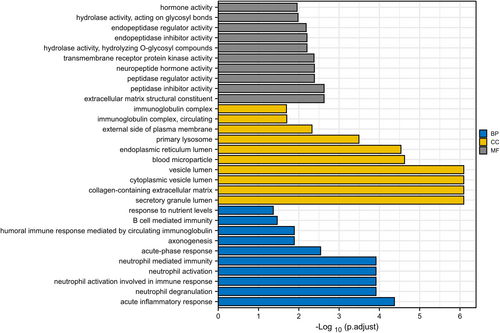
We conducted GO enrichment analyses of DEPs to ascertain noticeably enriched biological functions. A p-value of less than 0.05 was employed to distinguish statistically significant enrichment outcomes. Figure 2A provides a sequential list of the 10 most statistically significant items in biological processes (BP), cellular components (CC) and molecular functions (MF). Among BP, these DEPs were mainly related with acute inflammatory response, neutrophil degranulation, acute-phase response, axonogenesis and B cell mediated immunity. For CC, the DEPs were mainly enriched in secretory granule lumen, collagen-containing extracellular matrix, cytoplasmic vesicle lumen, vesicle lumen and blood microparticle. Among MF, NMO-related proteins were biased towards extracellular matrix structura constituent, peptidase inhibitor activity, peptidase regulator activity, neuropeptide hormone activity and transmembrane receptor protein kinase activity. In addition, we performed KEGG pathway analysis on DEPs and only the PI3K-Akt signaling pathway was enriched.
Interaction network analysis of the DEPs
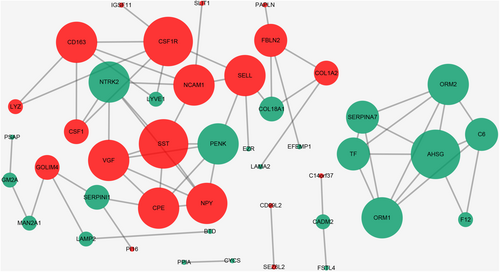
Figure 3 illustrated the establishment of a protein–protein interaction (PPI) network to facilitate clear visualization of protein relationships. Based on data from the STRING database and Cytoscape software, direct interactions were observed for 44 proteins. The nodes in the figure represent differentially expressed proteins, the down-regulated proteins are shown in green, and the up-regulated proteins are in red. The number of proteins that directly interact with a given protein A in a network was called the connectivity of protein A. Overall, higher protein connectivity leads to greater system disruption when the protein changes, potentially compromising the balance and stability of the system. We utilize the Cytoscape software to establish the dimensions of the node based on its degree. A node's degree is reflected by the size of its corresponding node; the greater the degree, the larger the node. The top 10 proteins, with the highest degree of nodes in this network, were SST, CSF1R, AHSG, NTRK2, NPY, PENK, VGF, CPE, SELL, NCAM1. Among the top 10 proteins, AHSG, NCAM1 and SST exhibited large fold changes (FC = 0.47, 2.28 and 2.15). Additionally, prior research indicated that AHSG, NCAM1 and SST were linked with neuroinflammatory diseases. As a result, three proteins were chosen as potential candidates for further experimental verification: AHSG, NCAM1 and SST.
Validation of candidate protein using ELISA and evaluation of the diagnostic efficacy
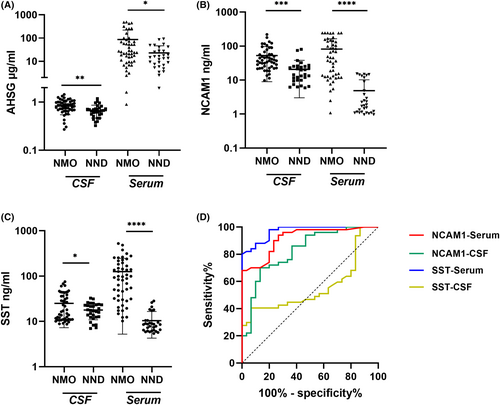
CSF and serum samples acquired from the validation cohort underwent ELISA analysis to validate candidate proteins. Compared to the NND group, the level of CSF SST and NCAM1 was noticeably increased in the NMO group, which was consistent with our previous proteomics data (Fig. 4B,C). However, the AHSG protein expression was significantly up-regulated, which contradicts our proteomic findings (Fig. 4A). Additionally, the serum levels of these three candidate protein were also validated simultaneously. Interestingly, the serum levels of AHSG, NCAM1 and SST were elevated in NMO patients compared to the healthy control group, which corroborates the CSF findings (Fig. 4A–C). The ROC curve analysis generated an AUC that indicates the diagnostic efficacy of NCAM1 and SST levels among NMO patients, as presented in Table 2 and Figure 4D. In ROC curve analysis, the primary optimization criterion for choosing the cut-off value was the maximum value of the Youden index. The Youden index quantified the highest possible diagnostic accuracy of a biomarker by summing sensitivity and specificity, then subtracting one. CSF NCAM1 had a cut-off of 27.83 ng/mL with 100% sensitivity and 68% specificity. Serum NCAM1 had a cut-off of 15.43 ng/mL with 86.7% sensitivity and 70% specificity, while the cut-off for serum SST was 28.55 ng/mL with 100% sensitivity and 80% specificity. Meanwhile, our research revealed that the amalgamation of AQP4-IgG with CSF NCAM1, serum NCAM1 and serum SST substantially boosted the sensitivity, albeit at the expense of reduced specificity (Table 3).
| Protein | Serum/CSF | AUC (95% CI) | Cut-off | Sensitivity | Specificity |
|---|---|---|---|---|---|
| NCAM1 | Serum | 0.9167 (0.8573–0.9760)*** | 15.43 ng/mL | 68% | 100% |
| CSF | 0.8267 (0.7325–0.9208)*** | 27.83 ng/mL | 70% | 86.7% | |
| SST | Serum | 0.9693 (0.9396–0.9991)*** | 28.55 μg/mL | 80% | 100% |
| CSF | 0.5574 (0.4264–0.6885) | – | – | – |
- AUC, area under the curve; CI, confidence interval; ROC, receiver operating characteristic.
- *** p < 0.001.
| Variable | NMO- (n = 50) | Control (n = 30) | Sensitivity (%) | Specificity (%) |
|---|---|---|---|---|
| AQP4-IgG (positive) | 32 (64) | 0 (0) | 64 | 100 |
| CSF-NCAM1 (>27.83 ng/mL) | 35 (70) | 4 (13.3) | 70 | 86.7 |
| Serum-NCAM1 (>15.43 ng/mL) | 34 (68) | 0 (0) | 68 | 100 |
| Serum SST (28.55 ng/mL) | 40 (80) | 0 (0) | 80 | 100 |
| Combined | 50 (100) | 4 (13.3) | 100 | 86.7 |
- Combined means that any one of the three indicators is greater than the cut-off.
- AQP4, aquaporin 4; NCAM1, neural cell adhesion molecule1; NMO, neuromyelitis optica; SST, Somatostatin.
Diagnostic ability of NCAM1 and SST for AQP4-IgG-negative NMO patients
Using cut-off values determined by the ROC analysis, this research investigates the diagnostic accuracy of NCAM1-CSF, NCAM1-serum and SST-serum in AQP4-IgG-negative patients with NMO. The findings, presented in Table 4, show that NCAM1-CSF has a diagnostic specificity of 86.7% in AQP4-IgG-negative NMO patients, demonstrating a sensitivity of 66.7%. NCAM1-serum demonstrated a diagnostic specificity of 100% for NMO patients who tested negative for AQP4-IgG, displaying a sensitivity of 61.11%. Meanwhile, it was illustrated that SST-serum achieved diagnostic specificity of 100% in NMO patients negative for AQP4-IgG, with 88.89% sensitivity.
| Variable | NMO (AQP4-IgG-) (n = 18) | Control (n = 30) | Sensitivity (%) | Specificity (%) |
|---|---|---|---|---|
| CSF-NCAM1 (>27.83 ng/mL) | 12 (66.7) | 4 (13.3) | 66.7 | 86.7 |
| Serum-NCAM1 (>15.43 ng/mL) | 11 (61.1) | 0 (0) | 61.1 | 100 |
| Serum SST (28.55 ng/mL) | 16 (88.9) | 0 (0) | 88.9 | 100 |
| Combined | 18 (100) | 4 (13.3) | 100 | 86.7 |
- Combined means that any one of the three indicators is greater than the cut-off.
- AQP4, aquaporin 4; NCAM1, neural cell adhesion molecule1; NMO, neuromyelitis optica; SST, Somatostatin.
Association of NCAM1 and SST with NMO phenotypes
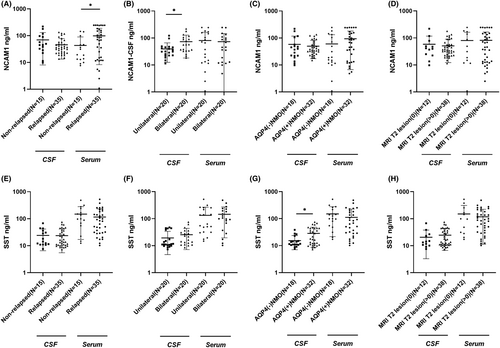
As per the updated recommendations for managing NMO, various clinical factors hold significant importance among patients with NMO. These include determining relapsed versus non-relapsed, AQP4 antibody positivity versus negativity, unilateral versus bilateral involvement and the presence of T2 lesions on MRI greater than 0. As shown in Figure 5A, serum NCAM1 levels were significantly lower in patients with non-relapsed NMO compared to patients with relapsed NMO (P < 0.05). CSF NCAM1 levels were higher in patients with bilateral NMO than in patients with unilateral NMO (P < 0.05, Fig. 5B). Furthermore, CSF SST levels were higher in AQP4 antibody-positive NMO patients than in AQP4 antibody-negative patients (P < 0.05, Fig. 5G). However, there were no statistically significant differences in serum or CSF SST levels between patients with relapsed or non-relapsed, unilateral or bilateral involvement and T2 lesions on MRI = 0 or >0 NMO (p > 0.05, Fig. 5E,F,H). After adjusting for age, gender, AQP4, MRI T2 lesion and optic neuritis lesion location, there were no statistically significant differences in serum and CSF levels of NCAM1 and SST between patients with relapsed and non-relapsed NMO (Extended Data Table 1). After adjusting for sex, age, relapsed or not, MRI T2 lesion and optic neuritis lesion location, only NCAM1 showed a significant difference in the cerebrospinal fluid between AQP4 IgG-negative and positive NMO patients (Extended Data Table 2). After adjusting for age, gender, AQP4, relapsed or not and optic neuritis lesion location, there were no statistically significant differences in serum and CSF levels of NCAM1 and SST between patients with MRI T2 lesion = 0 and MRI T2 > 0 lesion NMO (Extended Data Table 3). After adjusting for age, gender, AQP4, relapsed or not and MRI T2 lesion, there were no statistically significant differences in serum and CSF levels of NCAM1 and SST between patients with unilateral and bilateral NMO (Extended Data Table 4).
Clinical characteristics of NMO patients based on CSF-NCAM1 quartiles and CSF SST quartiles
The clinical features of neuromyelitis optica (NMO) patients were displayed in Extended Data Table 5 according to their CSF NCAM1 quartiles. Quartiles of NCAM1 levels in the CSF exhibit a positive correlation with the severity of optic neuritis (Fig. 6A). The clinical features of patients with NMO, as determined by the serum-NCAM1 quartiles, were presented in Extended Data Table 6. The percentage of NMO patients positive for AQP4-IgG showed a tendency to increase with the serum SST scale (Fig. 6B).

Discussion
NMO is a debilitating autoimmune inflammatory disorder affecting the central nervous system. Around 70–80% of NMO patients exhibit AQP4-IgG positivity. The diagnosis of NMO in AQP4-IgG-negative or AQP4-IgG-unknown cases was primarily reliant on clinical symptoms and imaging examinations.1 Patients with NMO, regardless of their AQP4 status, display notable variations in their clinical symptoms. There was a lack of validated laboratory biomarkers for the diagnosis of NMO. Proteomics analysis using TMT labelling was employed in this study to examine patients with NMO and NND and to identify new NMO biomarkers. These biomarkers hold great potential in aiding disease diagnosis and revealing the underlying molecular mechanisms. Through functional enrichment analysis, it was found that these molecules were differentially expressed are related to peptidase activity, neuronal development and immune-inflammatory response. Moreover, KEGG pathways were found to be associated with the PI3K-Akt signalling pathway.
Three proteins have been identified as potential candidates for further analysis in the interaction network. A better understanding of their role in the network can be gained by studying these proteins more thoroughly. The top 10 proteins, with the highest degree of nodes in this network, were SST, CSF1R, AHSG, NTRK2, NPY, PENK, VGF, CPE, SELL, NCAM1. Among the top 10 proteins, AHSG, NCAM1 and SST exhibited large fold changes (FC = 0.47, 2.28, and 2.15). Then, the candidate proteins were identified for examination in a larger sample size. It was found that the level of CSF AHSG, SST and NCAM1 was noticeably increased in the NMO group compared with NND group. The serum protein levels of patients with NMO were compared to those of healthy individuals. The findings revealed a marked elevation in the serum concentration of all three proteins among patients diagnosed with NMO. The role of candidate proteins was then investigated in both cerebrospinal fluid and serum for NMO diagnosis. Accordingly, serum SST (AUC = 0.9693), CSF NCAM1 (AUC = 0.8267) and serum NCAM1 (AUC = 0.9167) exhibited good diagnostic performance for NMO. Meanwhile, our research revealed that the amalgamation of AQP4-IgG with CSF NCAM1, serum NCAM1 and serum SST substantially boosted the sensitivity, although at the expense of reduced specificity. We examined the diagnostic efficacy of these three markers for individuals with AQP4-IgG-negative NMO, and the findings indicate a notable level of specificity and sensitivity. These findings suggest that CSF NCAM1, serum NCAM1 and serum SST may serve as biomarkers for NMO.
We also analyzed the differences in key proteins between the different clinical features of NMO patients. It was found that serum NCAM1 levels were significantly lower in patients with non-relapsed NMO compared to patients with relapsed NMO and CSF NCAM1 levels were higher in patients with bilateral NMO than in patients with unilateral NMO. Furthermore, CSF SST levels were higher in AQP4 antibody-positive NMO patients than in AQP4 antibody-negative patients. This study suggests that the differentiation between patients with relapsed and non-relapsed NMO can be achieved through serum NCAM1 levels. Furthermore, unilateral and bilateral optic neuritis can be distinguished based on the levels of CSF NCAM1. The results also reveal a correlation between CSF SST levels and the expression of AQP4 antibodies.
Previous studies have shown that AHSG is a potential biomarker and therapeutic target for multiple sclerosis (MS) and that AHSG is significantly elevated in demyelinating lesions and in the grey matter of multiple sclerosis brain tissue.23 Our study demonstrated comparable findings with considerably elevated AHSG levels in both serum and CSF of NMO patients compared to the control group. The discrepancy between experimental validation of ELSIA and TMT proteomic assays could be attributed to the presence of AHSG's glycosylated and phosphorylated modifications.24 It was discovered that the absence of AHSG in mice resulted in a decrease in disease severity, indicating that AHSG may play an active role in promoting immune responses during brain autoimmune diseases.25 Additionally, they observed AHSG expression in microglia following LPS stimulation, suggesting intrathecal synthesis of AHSG. However, the association between AHSG and NMO progression is inadequately researched and warrants further experimentation for verification.
SST was a versatile peptide hormone that modulates local immune responses in inflammatory cells including lymphocytes, monocytes and macrophages, offering anti-inflammatory and anti-injury sensory effects.26 Also, in the nervous system, it played a crucial role as both a neurotransmitter and neuromodulator, regulating synaptic transmission efficiency and modulating neuronal function. SST has been identified as a significant factor in several CNS disorders, including Huntington's disease, Parkinson's disease, Alzheimer's disease and demyelinating diseases.27-29 SST levels in CSF decreased during relapses in MS as well as in diseases that exhibit cognitive impairment.30 Our previous findings also showed lower SST expression in the CSF of MS patients compared to NND patients.31 However, the findings of this study indicated heightened levels of serum and CSF SST in patients with NMO in comparison to both the NND cohort and the healthy population. We also found CSF SST levels were higher in AQP4 antibody-positive NMO patients than in AQP4 antibody-negative patients, which suggested that the expression of AQP4 antibodies may affect SST release. The identification of the AQP4 antibody enabled distinguishing NMO from the subtype of MS itself. The identification of the AQP4 antibody set NMO apart from MS alone. Consequently, SST may serve as both a diagnostic marker for NMO and as a distinguishing diagnostic marker for NMO and MS.
NCAM1 was involved in the regulation of neurogenesis, neurite outgrowth and cell migration during nervous system development.32-34 The results of our study indicated that the levels of NCAM1 in both CSF and serum were significantly higher in patients with NMO in comparison to controls. Furthermore, the ROC analyses demonstrated positive diagnostic efficacy for NCAM1 as a potential marker for NMO diagnosis. Additionally, higher serum NCAM1 levels were observed in patients with relapsed NMO compared to non-relapsed type, and higher CSF NCAM1 levels were detected in patients with bilateral optic neuritis compared to patients with unilateral optic neuritis. The trend test results revealed an increase in patients with bilateral optic neuritis in parallel to the CSF NCAM1 levels. CSF levels of NCAM1 may be indicative of the severity of NMO. Additionally, the proportion of AQP4 antibody-positive patients increased as the serum NCAM1 levels increased. These findings suggest an association between NCAM1 and the production of AQP4 antibodies. Previous research has indicated that NCAM1 played a role in the proliferation of T-lymphocytes, B-lymphocytes and natural killer cells, critical for immune surveillance.35 Additionally, NCAM1 participated in the activation of the PI3K signaling pathway and contributed to signal transduction.36 These observations suggested that NCAM1 may be implicated in the development of NMO through the aforementioned mechanisms. It was well known that the diagnosis of AQP4 IgG-negative NMO patients had been a challenge. Our research indicated no difference in CSF NCAM1 levels between AQP4 antibody-positive and antibody-negative patients. Furthermore, a test for trend did not establish any correlation with the proportion of AQP4 antibody-positive patients. Our study showed that CSF NCAM1 levels did not differ between AQP4 antibody-positive and -negative patients, and a test for trend did not reveal a correlation with the proportion of AQP4 antibody-positive patients. Therefore, CSF NCAM1 levels can be used as an adjunct to confirm the diagnosis of AQP4 antibody-negative NMO patients.
The study may have certain limitations. Initially, objective evaluations were excluded due to the challenge of selecting an appropriate control group in CSF biomarker studies. Consequently, we referred to previous studies and selected NND patients as the control group. Moreover, in this study, the inconsistency between the outcomes of TMT proteomics and ELSIA for AHSG was merely conjecture and remained unverified. Furthermore, additional samples and animal experiments are required in order to authenticate these discoveries in the forthcoming period and clarify the inherent mechanism of NMO. Finally, we did not stratify the MOG-IgG-positive patients for comparison due to their small number (only 4 patients).
Conclusion
In conclusion, the use of TMT-based proteomics technology presented a fresh approach to identifying specific proteins within the CSF of patients with NMO. Subsequent ELISA validation demonstrates the usefulness of NCAM1 and SST in diagnosing NMO. CSF-NCAM1, serum-NCAM1, and serum SST achieved a high level of specificity and sensitivity for the diagnosis of AQP4-IgG-negative NMO patients. CSF NCAM1 levels are indicative of whether optic neuritis is unilateral or bilateral. Elevated levels of NCAM1 in serum and SST in CSF may be linked to AQP4 antibody production. Further research was necessary to explore the physiological processes of DEPs in individuals with NMO, as well as their potential as biomarkers for NMO.
Acknowledgments
None.
Funding Information
This research received financial support from the Beijing Municipal Natural Science Foundation (Code No. 7222052), Beijing Hospitals Authority's Ascent Plan (DFL20220505), the Beijing High-level Public Health Technical Personnel Training Programme (2022-2-013), and Beijing Association for Science and Technology (No. BYESS2022170).
Author Contributions
All authors contributed to the study conception and design. Study concept and design: Guojun Zhang. Acquisition of data: Yaowei Ding, Yuxin Chen, Yijun Shi, Guoge Li, Xin Luan, Wencan Jiang and Siqi Wang. Analysis and interpretation of data: Yaowei Ding, Jialu Sun, Xiaotong Li and Lijuan Wang. Drafting of the manuscript: Yaowei Ding. Statistical analysis: YWD, Yuxin Chen and Jialu Sun. Critical revision of the manuscript for important intellectual content: Guojun Zhang. The author(s) read and approved the final manuscript.
Conflict of Interest
The authors report no competing interests.
Consent for Publication
Not applicable.
Open Research
Data Availability Statement
The data used and/or analyzed in the current study are available from the corresponding authors upon reasonable request. The mass spectrometry proteomics data have been deposited to the ProteomeXchange Consortium (http://proteomecentral.proteomexchange.org) via the iProX partner repository with the data set identifier IPX0002604000, PXD023027.


