Autophagy-related 5 in acute ischemic stroke: Variation and linkage with neurofunction, and survival
Abstract
Objective
Autophagy-related 5 (ATG5) facilitates the pathologic process of acute ischemic stroke (AIS) via multiple ways. This study aimed to identify the association of serum ATG5 with clinical outcomes in AIS patients.
Methods
Serum ATG5 from 280 AIS patients were detected at admission, Day (D)1, D3, D7, D30, and D90 after admission by enzyme-linked immunosorbent assay. The median (interquartile range) follow-up was 21.1 (5.9–43.9) months. Another 50 healthy controls (HCs) were also enrolled for serum ATG5 determination.
Results
ATG5 was elevated (p < 0.001) (vs. HCs), and positively correlated with hyperlipidemia (p = 0.016), and the national institutes of health stroke scale score (p = 0.001) in AIS patients. Interestingly, ATG5 was increased from admission to D1, but gradually decreased until D90 (p < 0.001). Besides, 85 (30.4%) and 195 (69.6%) AIS patients were assessed as modified Rankin Scale (mRS) >2 and mRS ≤2 at D90, respectively. ATG5 at admission, D1, D3, D30, and D90 was elevated in AIS patients with mRS >2 versus those with mRS ≤2 (all p < 0.050). ATG5 at admission, D1, D3, D7, D30, or D90 was elevated in relapsed (vs. non-relapsed) or died (vs. survived) AIS patients (all p < 0.050). Recurrence-free survival was shortened in AIS patients with high (≥52.0 ng/mL) ATG5 versus those with low (<52.0 ng/mL) ATG5 at admission, D3, D7, and D30 (all p < 0.050); overall survival was shorter in AIS patients with high (vs. low) ATG5 at D7 and D30 (both p < 0.050).
Interpretation
Serum ATG5 elevates at first, thereafter gradually declines, whose elevation associates with neurological dysfunction, recurrence, and death risk in AIS patients.
Introduction
Stroke, with an increasing incidence in recent decades, is a major cause of death in China and worldwide.1, 2 Acute ischemic stroke (AIS), the most common type of stroke, is characterized by neurological dysfunction following focal brain ischemia due to cerebral artery occlusion.3, 4 To prevent irreversible neuron injury of ischemic penumbra after stroke, timely reperfusion therapies such as intravenous thrombolysis and endovascular mechanical thrombectomy are essential for restoring blood flow of brain in AIS patients.4-6 Despite the fact that most AIS patients benefit from timely pharmacological or surgical intervention, a proportion of them still suffer from neurological dysfunction and even a high risk of stroke recurrence and mortality.7, 8 Therefore, exploring novel biomarkers with the potency of predicting the clinical outcomes is meaningful in improving management of AIS patients.
Autophagy-related 5 (ATG5), a core autophagy protein, regulates autophagy to participate in multiple biological processes, such as inflammatory response, immune cell differentiation, and lipid metabolism.9-13 Several evidence discloses that ATG5 regulates pathologic process of AIS by promoting autophagy of neuron, astrocyte, and microglia.14-17 For instance, a study observes that autophagic cell death is prevalent in damaged neurons after cerebral ischemia-hypoxia.17 Also, a study reveals that ATG5-mediated autophagy is involved in hypoxia-induced microglia death, contributing to elevating inflammatory level in brain.16 Another study indicates that increased ATG5 may lead to aggravated infarct lesion and neurological damage in AIS via facilitating ferroptosis.15 Clinically, a study notices that serum ATG5 is higher in AIS patients compared to controls, which suggests the diagnostic potential of ATG5 in AIS.18 However, the longitudinal change of ATG5 and its ability in predicting clinical outcomes of AIS patients is yet to be elucidated.
Therefore, this prospective study detected serum ATG5 at different timepoints, intending to identify the longitudinal variation of ATG5 and its correlation with neurological function, recurrence-free survival (RFS), and overall survival (OS) in AIS patients.
Methods
Subjects
From May 2019 to August 2022, a total of 280 AIS patients who visited Handan Central Hospital were consecutively included in this prospective study. The inclusion criteria were (i) diagnosed as AIS per a guideline from American Heart Association/American Stroke Association19; (ii) symptom onset within 24 h; (iii) aged more than 18 years old. The exclusion criteria were (i) intracranial hemorrhage; (ii) with disabilities prior to stroke occurrence; (iii) with a malignant disease; (iv) pregnant or lactating women. Besides, a total of 50 healthy people were enrolled as healthy controls (HCs), which eligibility criteria were as follows: (i) without abnormalities in recent physical examinations; (ii) age- and sex-matched with the AIS patients; (iii) without subclinical stroke; and (iv) volunteered to participate in this study. The study was approved by the Ethics Committee of Handan Central Hospital. Written Informed consent was taken from each subject or his/her guardian.
Data collection and sample detection
Demographics, comorbidities, and time since symptom onset to admission were collected at admission. Besides, the neurological deficit severity was measured per the national institutes of health stroke scale (NIHSS) score at admission.20
The whole blood samples were collected from all subjects, in which samples from AIS patients were collected at admission, 1st day (D1), 3rd day (D3), 7th day (D7), 30th day (D30), and 90th day (D90) after admission; while samples from HCs were gathered at enrollment. Then serum was isolated from the whole blood sample for ATG5 level detection. The serum ATG5 levels were detected by enzyme-linked immunosorbent assay (ELISA) using Human Autophagy-related Protein 5 ELISA Kit (No. Cat. JL19973-96T, Shanghai Jianglai Industrial Limited by share, China). All experimental steps were performed in strict accordance with the kit instructions.
Treatment
AIS patients underwent the following treatments: recombinant tissue plasminogen activator (rtPA) intravenous thrombolysis (IVT), rtPA IVT bridging to mechanical thrombectomy (MT), urokinase (UK) IVT, UK IVT bridging to MT, MT as appropriate. Each patient received treatment according to his/her disease status (especially the admission time), image examination result, and doctors' judgment.
Follow-up and evaluation
The modified Rankin Scale (mRS) score was evaluated at D90, which was a seven-level ordered categorical scale from 0 to 6 (0, independent; 6, dead). For analysis, the mRS score was cut by 2 (≤2, good prognosis; >2, poor prognosis).21 In addition, AIS patients underwent routine follow-ups (median, 21.1 months; range, 5.9–43.9 months). During the follow-up, the recurrence and survival statuses were recorded. Then accumulating RFS and accumulating OS rates were calculated.
Statistics
SPSS v.22.0 (IBM, USA) and GraphPad Prism v.7.0 (GraphPad Software, USA) were applied for data analysis and figure construction, respectively. The Wilcoxon rank sum test and Kruskal–Wallis H rank sum test were used for comparing analysis. The receiver operating characteristic (ROC) curve showed the ability of ATG5 in distinguishing AIS patients and HCs. The Friedman test was used for comparing ATG5 over time. ATG5 was divided into low ATG5 and high ATG5 by 52.0 ng/mL, which was determined by the median value of ATG5 at admission in AIS patients. Kaplan–Meier curves were used to display the accumulating RFS and accumulating OS rates. Log-rank test was used to compare accumulating RFS or OS rates between patients with low and high ATG5. ROC curve also showed the value of serum ATG5 at different timepoints on predicting OS. p < 0.05 represented statistical significance.
Results
Characteristics of AIS patients
AIS patients enrolled in this study had a mean age of 65.4 ± 9.4 years, including 96 (34.3%) females and 184 (65.7%) males. The mean body mass index (BMI) of AIS patients was 25.1 ± 2.7 kg/m.2 A respective of 213 (76.1%), 120 (42.9%), 69 (24.6%), 76 (27.1%), and 110 (39.3%) AIS patients had a history of hypertension, hyperlipidemia, diabetes mellitus, chronic kidney disease, and cardiovascular disease, respectively. The median (interquartile range [IQR]) time since symptom to admission of AIS patients was 4.0 (3.0–6.0) h, and the mean NIHSS score of these patients was 8.7 ± 4.6. The detailed information was displayed in Table 1.
| Characteristics | AIS patients (N = 280) |
|---|---|
| Age (years), mean ± SD | 65.4 ± 9.4 |
| Gender, No. (%) | |
| Female | 96 (34.3) |
| Male | 184 (65.7) |
| BMI (kg/m2), mean ± SD | 25.1 ± 2.7 |
| History of smoke, No. (%) | |
| No | 136 (48.6) |
| Yes | 144 (51.4) |
| History of drink, No. (%) | |
| No | 166 (59.3) |
| Yes | 114 (40.7) |
| Hypertension, No. (%) | |
| No | 67 (23.9) |
| Yes | 213 (76.1) |
| Hyperlipidemia, No. (%) | |
| No | 160 (57.1) |
| Yes | 120 (42.9) |
| Diabetes mellitus, No. (%) | |
| No | 211 (75.4) |
| Yes | 69 (24.6) |
| Chronic kidney disease, No. (%) | |
| No | 204 (72.9) |
| Yes | 76 (27.1) |
| Cardiovascular disease, No. (%) | |
| No | 170 (60.7) |
| Yes | 110 (39.3) |
| Time since symptom to admission (h), median (IQR) | 4.0 (3.0–6.0) |
| NIHSS score, mean ± SD | 8.7 ± 4.6 |
- AIS, acute ischemic stroke; BMI, body mass index; IQR, interquartile range; NIHSS, national institutes of health stroke scale; SD, standard deviation.
Serum ATG5 in AIS patients and HCs
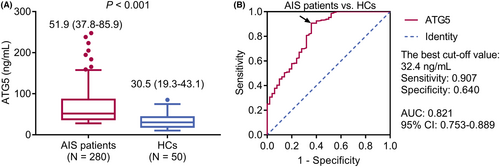
Serum ATG5 was elevated in AIS patients compared to HCs (median [IQR]: 51.9 [37.8–85.9] ng/mL vs. 30.5 [19.3–43.1] ng/mL, p < 0.001) (Fig. 1A). Serum ATG5 had a pleasing value in differentiating AIS patients from HCs (area under the curve (AUC): 0.821, 95% confidence interval: 0.753–0.889), with the best cut-off value of 32.4 ng/mL (sensitivity: 0.907, specificity: 0.640) (Fig. 1B).
Correlation of serum ATG5 and characteristics in AIS patients
Increased serum ATG5 was associated with hyperlipidemia (p = 0.016) and NIHSS score ≥8.0 (p = 0.001) in AIS patients. However, serum ATG5 was not related to other characteristics, including age, gender, BMI, history of smoke, history of drink, hypertension, diabetes mellitus, chronic kidney disease, cardiovascular disease, and time since symptom to admission in AIS patients (all p > 0.050) (Table 2).
| Characteristics | ATG5 (ng/mL), median (IQR) | p value |
|---|---|---|
| Age | 0.684 | |
| <65.0 years | 49.0 (38.1–81.5) | |
| ≥65.0 years | 52.8 (37.4–89.0) | |
| Gender | 0.304 | |
| Female | 49.9 (37.3–78.9) | |
| Male | 52.4 (38.3–86.4) | |
| BMI | 0.247 | |
| <25.0 kg/m2 | 51.8 (37.5–78.9) | |
| ≥25.0 kg/m2 | 52.3 (38.7–98.9) | |
| History of smoke | 0.596 | |
| No | 52.4 (38.3–86.6) | |
| Yes | 50.8 (37.7–83.8) | |
| History of drink | 0.289 | |
| No | 56.8 (38.5–86.3) | |
| Yes | 48.1 (37.8–80.4) | |
| Hypertension | 0.088 | |
| No | 47.1 (35.8–74.2) | |
| Yes | 52.5 (38.7–88.3) | |
| Hyperlipidemia | 0.016 | |
| No | 47.9 (37.0–80.9) | |
| Yes | 57.2 (39.3–96.9) | |
| Diabetes mellitus | 0.051 | |
| No | 49.6 (37.4–78.1) | |
| Yes | 61.2 (40.4–99.2) | |
| Chronic kidney disease | 0.264 | |
| No | 51.7 (37.8–79.0) | |
| Yes | 52.4 (38–106.3) | |
| Cardiovascular disease | 0.094 | |
| No | 49.0 (37.2–78.3) | |
| Yes | 58.1 (38.9–89.9) | |
| Time since symptom to admission | 0.459 | |
| <4.0 h | 52.3 (38.2–76.2) | |
| ≥4.0 h | 49.2 (37.7–96.1) | |
| NIHSS score | 0.001 | |
| <8.0 | 46.8 (36.0–71.5) | |
| ≥8.0 | 59.4 (39.2–102.4) |
- Continuous variables were divided into dichotomous variables using median values. Specifically, the median value of age, BMI, time since symptom to admission, and NIHSS score was 65.0 years, 25.0 kg/m2, 4.0 h, and 8.0, respectively.
- AIS, acute ischemic stroke; ATG5, autophagy-related 5; BMI, body mass index; IQR, interquartile range; NIHSS, national institutes of health stroke scale.
The longitudinal variation of serum ATG5 in AIS patients
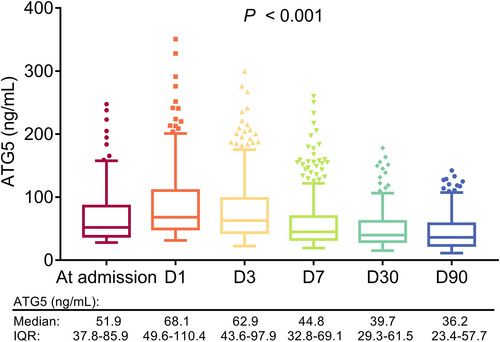
Overall, serum ATG5 was varied at different timepoints in AIS patients (p < 0.001). In detail, serum ATG5 was increased from admission, then it was gradually reduced from D1 to D90 in AIS patients (Fig. 2).
Comparison of serum ATG5 at each time point in AIS patients underwent different treatments
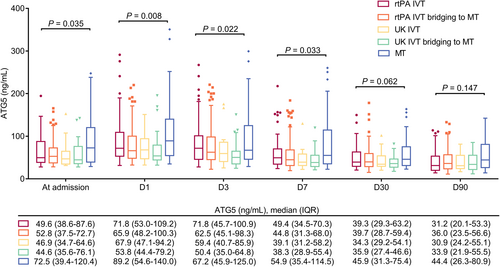
Among 280 AIS patients enrolled in this study, 49 (17.6%), 109 (38.9%), 20 (7.1%), 33 (11.8%), and 69 (24.6%) patients received rtPA IVT, rtPA IVT bridging to MT, UK IVT, UK IVT bridging to MT, and MT, respectively (Table S1). Serum ATG5 at admission (p = 0.035), D1 (p = 0.008), D3 (p = 0.022), and D7 (p = 0.033) was differed among AIS patients underwent different treatments, while serum ATG5 at D30 and D90 was not varied in these patients (both p > 0.050) (Fig. 3).
Subgroup analysis
In AIS patients with time since symptom to admission <4 h, serum ATG5 at admission, D1, D3, D7, D30, and D90 was not varied between patients receiving rtPA IVT and UK IVT (all p > 0.050) (Fig. S1A). However, in AIS patients with time since symptom to admission ≥4 h, serum ATG5 at admission (p = 0.042), D1 (p = 0.018), D3 (p = 0.026), and D7 (p = 0.045) was differed among patients receiving rtPA IVT, rtPA IVT bridging to MT, UK IVT, UK IVT bridging to MT, and MT, but not at D30 or D90 (both p > 0.050) (Fig. S1B).
Correlation of serum ATG5 at each timepoint with neurological function in AIS patients
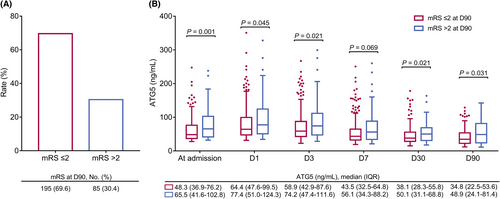
Eighty-five (30.4%) and 195 (69.6%) AIS patients were assessed as mRS >2 and mRS ≤2 at D90, correspondingly (Fig. 4A). Furthermore, serum ATG5 at admission (p = 0.001), D1 (p = 0.045), D3 (p = 0.021), D30 (p = 0.021), and D90 (p = 0.031) was elevated in AIS patients with mRS >2 at D90 compared to those with mRS≤2 at D90, while serum ATG5 at D7 (p = 0.069) was not varied between them (Fig. 4B).
Correlation of serum ATG5 at each timepoint with RFS and OS in AIS patients
Serum ATG5 at admission (p = 0.035), D3 (p = 0.006), D7 (p < 0.001), D30 (p < 0.001), and D90 (p = 0.044) was elevated in relapsed versus non-relapsed AIS patients, whereas it was of no difference at D1 (p = 0.155) between these patients. Moreover, serum ATG5 at D1 (p = 0.022), D3 (p = 0.017), D7 (p = 0.008), D30 (p = 0.001), and D90 (p = 0.032) was increased in died versus survived AIS patients. While serum ATG5 at admission (p = 0.095) was not varied between these patients (Table 3).
| Items | ATG5 (ng/mL), median (IQR) | p value |
|---|---|---|
| Relapse | ||
| Admission | 0.035 | |
| No | 49.4 (37.7–78.3) | |
| Yes | 61.8 (38.7–118.2) | |
| D1 | 0.155 | |
| No | 66.3 (49.8–101.3) | |
| Yes | 90.2 (47.5–137.3) | |
| D3 | 0.006 | |
| No | 60.8 (43.1–84.9) | |
| Yes | 93.7 (46.0–152.2) | |
| D7 | <0.001 | |
| No | 43.5 (32.0–63.3) | |
| Yes | 69.0 (37.9–140.5) | |
| D30 | <0.001 | |
| No | 36.8 (28.6–53.7) | |
| Yes | 64.9 (39.7–100.1) | |
| D90 | 0.044 | |
| No | 35.0 (21.9–55.9) | |
| Yes | 48.6 (25.4–86.4) | |
| Death | ||
| Admission | 0.095 | |
| No | 51.5 (37.7–81.8) | |
| Yes | 58.0 (41.3–142.8) | |
| D1 | 0.022 | |
| No | 67.2 (48.1–106.2) | |
| Yes | 95.5 (55.3–165.0) | |
| D3 | 0.017 | |
| No | 61.8 (43.1–91.5) | |
| Yes | 108.3 (48.1–175.1) | |
| D7 | 0.008 | |
| No | 44.4 (32.3–66.5) | |
| Yes | 66.4 (39.6–130.7) | |
| D30 | 0.001 | |
| No | 38.9 (29.0–56.9) | |
| Yes | 73.2 (38.9–93.8) | |
| D90 | 0.032 | |
| No | 35.2 (22.2–56.3) | |
| Yes | 51.7 (25.7–89.7) | |
- AIS, acute ischemic stroke; ATG5, autophagy-related 5; D1, 1st day after admission; D3, 3rd day after admission; D7, 7th day after admission; D30, 30th day after admission; D90, 90th day after admission; IQR, interquartile range.
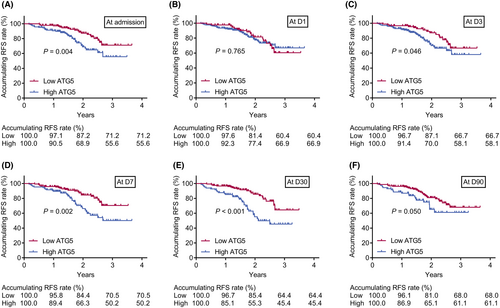
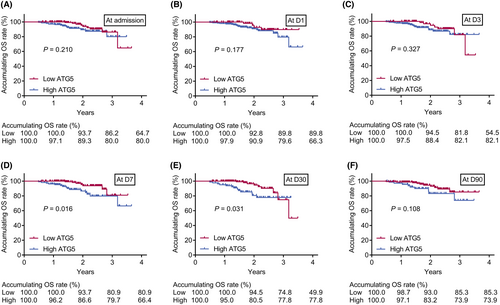
Additionally, accumulating RFS rate was declined in AIS patients with high (vs. low) serum ATG5 at admission (p = 0.004), D3 (p = 0.046), D7 (p = 0.002), and D30 (p < 0.001), while the rate was not varied between patients with high and low serum ATG5 at D1 (p = 0.765) and D90 (p = 0.050) (Fig. 5A–F). Meanwhile, AIS patients with high (vs. low) serum ATG5 at D7 (p = 0.016) and D30 (p = 0.031) had a reduced accumulating OS rate. However, accumulating OS was of no difference between patients with high and low serum ATG5 at admission (p = 0.210), D1 (p = 0.177), D3 (p = 0.327), or D90 (p = 0.108) (Fig. 6A–F). Further ROC curves suggested that serum ATG5 at D30 had the best predicting value for OS (AUC = 0.690) in AIS patients (Fig. S2A–F).
Discussion
This study reached the following conclusions: (1) Serum ATG5 was positively linked with hyperlipidemia and NIHSS score of AIS patients. (2) Serum ATG5 was increased from admission to D1, then gradually declined until D90 in AIS patients. (3) Elevated serum ATG5 at most timepoints was associated with mRS >2, as well as shortened RFS and OS in AIS patients.
ATG5 plays an important role in the formation of autophagosomes22; and the latter accumulate in cerebral tissue shortly after AIS.23 Currently, only one clinical study illustrates that serum ATG5 is elevated in patients with early-stage ischemic stroke than controls.18 In this study, serum ATG5 was elevated in AIS patients (vs. HCs), and it was positively linked with hyperlipidemia and NIHSS score in these patients. The potential explanations might be those (1) Elevated serum ATG5 contributed to more extensive neuronal death by accelerating neuronal autophagy, resulting in severer neurological dysfunction in AIS patients.14, 23, 24 Hence, elevated serum ATG5 was associated with higher NIHSS score in AIS patients. (2) ATG5-mediated autophagy disturbed the dissolution of cholesterol and triglyceride, resulting in hyperlipidemia.13 Therefore, AIS patients with hyperlipidemia had an elevated serum ATG5 compared to those without. Additionally, the specificity of the best cutoff value of serum ATG5 for diagnosing AIS patients was only 0.640, indicating that only utilizing serum ATG5 for AIS diagnosis was not enough. Therefore, exploration for more markers with the efficacy for differentiating AIS patients from HCs to combine with ATG5 was required.
Close monitoring of disease condition after reperfusion therapies is essential in improving clinical outcomes of AIS patients.5 Therefore, the present study quantified serum ATG5 at admission, D1, D3, D7, D30, and D90, discovering that serum ATG5 was increased from admission, then it was gradually reduced from D1 to D90 in AIS patients. The probable reason could be that: ATG5-mediated autophagy facilitated the formation of neutrophile extracellular traps, leading to acute inflammation12, 25-27; further, neuroinflammation flared due to ischemia–reperfusion injury, but the inflammatory level might be gradually reduced by pericytes along with restoration of blood flow after reperfusion.28, 29 Hence, serum ATG5 was increased at first, but thereafter gradually declined in AIS patients. Besides, this study also noticed that serum ATG5 at admission, D1, D3, and D7 was varied in AIS patients underwent different treatments; the possible explanation might be this: Choice of treatment primary depended on symptom-to-admission time of AIS patients. Prolonged symptom-to-admission time contributed to severer neurological dysfunction.30 Furthermore, the varied neurological dysfunction could be indicated by discrepancies of serum ATG5. Hence, serum ATG5 at admission, D1, D3, and D7 was differed in AIS patients underwent different treatments. Interestingly, the current study noticed that serum ATG5 was not linked with the time since symptom to admission, but exhibited an elevating trend in MT-treated AIS patients compared to patients receiving other treatments, which caused an inconsistency. The potential explanation might be that: ATG5 was an indicator of disease severity, and it was not related to the symptom to admission time. MT was typically administered in AIS patients with more severe disease status. Thus, it was reasonable that ATG5 was not linked with the time since symptom to admission while it showed an elevating trend in MT-treated patients. Of note, apart from symptom to admission time, the treatment choice was also dependent on image examination result, clinical judgment, and other disease status indicators. Further subgroup analyses showed that in patients with time since symptom to admission >4, ATG5 level was correlated with treatment regimens in AIS patients. Therefore, the inconsistency was justifiable.
Available evidence confirmed the clinical value of autophagy-related biomarkers (such as ATG4B, Beclin1, and microtubule-associated protein B light chain 3 (LC3B)) in AIS patients.31, 32 For instance, a previous study uses microarray analysis and finds that autophagy-related biomarkers are helpful for identifying early-stage stroke patients.31 Another study discloses that Beclin1 and LC3B in cerebrospinal fluid are positively related to infarct size and mRS in AIS patients.32 Considering that ATG5 is also a crucial autophagy-related biomarker, it might possess a potential ability for predicting clinical outcomes in AIS patients, but this issue is not previously reported. The NIHSS score and the MRS score are both typical stroke scales that can reflect stroke outcomes; the former is an indicator of neurological function, while the latter is utilized to assess body function, activity, and participation following stroke.33 This study observed that elevated serum ATG5 at admission, D1, D3, D30, and D90 was correlated with mRS >2 in AIS patients. The potential explanation might be that according to the aforementioned result of this study, elevated serum ATG5 was linked with worse neurological function, which led to poor body function and even disability of AIS patients.14, 25 Thus, elevated serum ATG5 at most timepoints was related to mRS >2 in AIS patients. Furthermore, the current study also identified that increased serum ATG5 at admission, D1, D3, D7, D30, or D90 was related to shortened RFS or OS in AIS patients. The possible explanations might be those (1) Elevated ATG5 was associated with aggravated stroke severity (manifested by NIHSS score), and the latter increased relapse risk in AIS patients.34 Therefore, elevated serum ATG5 was associated with shortened accumulating RFS in AIS patients. (2) ATG5 was positively correlated with AIS-induced hypoxia, and the latter was a major detrimental factor leading to cerebrovascular mortality.14, 35 Hence, elevated serum ATG5 was associated with shortened accumulating OS in AIS patients.
There were several limitations in the current study: First, this was a single-center study, thus, selective bias was hard to avoid. Second, the value of serum ATG5 on predicting the prognosis of hemorrhagic stroke needed further exploration. Third, this study only evaluated the ability of ATG5 in reflecting prognosis of AIS patients, while the clinical value of other autophagy family members (such as autophagy-related 8 and autophagy-related 12) was not explored in this study.
In conclusion, serum ATG5 increases at first, but gradually declines afterward, whose elevation at most timepoints is associated with worse neurological function and higher risks of recurrence and death in AIS patients.
Author contributions
JQ designed and supervised the study. FC and LW conceived the study. MZ, MK and HC participated in data collection. FC, XW and JQ performed the data analysis. FC and LW wrote the manuscript. MZ, MK, HC and JQ contributed to results analysis and revised the manuscript. XW and JQ confirmed the authenticity of all the raw data. All authors read and approved the final manuscript.
Acknowledgment
None.
Conflict of Interest
The authors confirm that they have no conflict of interest to declare.
Funding Information
We did not receive any financial or non-financial support.


