Divergent backward projections from the anterior part of the inferotemporal cortex (area TE) in the macaque
Abstract
The organization of backward projections from the anterior part of the inferotemporal cortex (area TE) to the posterior part of the inferotemporal cortex (area TEO) was studied in the macaque monkey by using the anterograde tracer Phaseolus vulgaris-leucoagglutinin (PHA-L). The objectives of the study were to investigate this backward projection and to compare it with 1) the backward projections that have been described previously in the early sensory areas and 2) the forward projection from area TEO to area TE. After a single iontophoretic injection of PHA-L into area TE in three monkeys, a dense distribution of labeled terminals was observed in area TEO and in the ventral bank of the superior temporal sulcus (area PITd) that adjoined area TEO. A less dense distribution was observed in areas V4, V2, and V1. Clusters of labeled terminals in areas TEO and PITd extended more than 4 mm along the cortical surface. The forward projections from area TEO to area TE also were studied for comparison by reanalyzing two previous cases (Saleem et al. [1993] Cerebral Cortex 3:454–464). These projections (from area TEO to area TE) were more focal than the terminations that occurred in area TEO after injections into area TE. Nine single axons projecting from area TE to areas TEO/PITd were reconstructed through serial sections. These showed variable, complex branching patterns with multiple arbors (1–12). Arbors were localized in layers 1–3 for four axons, in layer 1 for one axon, layers 5 and 6 for two axons, and in both layers 1–3 and layers 5–6 for two axons. Axons with horizontally elongated arbors confined to layer 1 were not predominant. The size of the individual arbors of these axons along their long axes tended to be larger (1.56 ± 1.24 mm) than those of TEO-to-TE forward axons (<0.6 mm). Thus, the authors conclude that, like other backward systems described to date, those from area TE to areas TEO/PITd are divergent. However, single axons have more variable laminar patterns of terminal distribution than those in the other backward systems. J. Comp. Neurol. 422:206–228, 2000. © 2000 Wiley-Liss, Inc.
The anterior part of the inferotemporal cortex (area TE) constitutes the last purely visual stage of the occipitotemporal pathway and is essential for visual object discrimination and recognition (Gross, 1994). Neurons in area TE respond selectively to various complex visual features of objects (for reviews, see Gross, 1994; Logothetis and Sheinberg, 1996; Tanaka, 1996), and neurons that respond to similar features cluster in columnar regions in area TE (for review, see Tanaka, 1996). The neural substrates of these processes still are under active investigation, but they are likely to involve complex interactions of intrinsic and extrinsic cortical connections. With this in mind, the current study was aimed at a finer characterization of the backward projection from area TE to earlier stages in the occipitotemporal pathway, especially the posterior part of the inferotemporal cortex (area TEO), which is one step earlier than area TE along the occipitotemporal pathway (V1-V2-V4-TEO-TE; Felleman and Van Essen, 1991).
Previous anatomic studies investigated several other backward systems and showed that, in the visual cortical areas, these are divergent in two aspects. First, the terminal fields of backward projections are distributed widely in each target area without clear specificity with regard to functional compartments. For example, both terminal fields projecting from middle temporal area and those from area V4 extend across two or three cytochrome oxidase (CO) compartments in area V2 (Krubitzer and Kaas, 1989, 1990; Shipp and Zeki, 1989; Zeki and Shipp, 1989). Correspondingly, the terminal fields of single backward axons extend several millimeters in layer 1 of area V1 (Rockland and Virga, 1989; Rockland et al., 1994). Second, the backward projections may target several cortical areas and tend to extend over more steps in the cortical hierarchy than forward projections. For example, along the occipitotemporal pathway (V1-V2-V4-TEO-TE; Felleman and Van Essen, 1991), area V1 projects forward only up to area V4, and area V2 projects up to area TEO, whereas projections from area TEO and even those from area TE often reach area V1 (Kennedy and Bullier, 1985; Rockland and Van Hoesen, 1994; Rockland et al., 1994; Rockland and Drash, 1996).
Although it has been shown previously that area TE projects strongly to area TEO (Webster et al., 1991), the fine organization of the backward projection from area TE to area TEO remains unclear. Only a single axon projecting from ventral part of area TE to area TEO has been described (see Fig. 7 in Rockland and Drash, 1996). Because a columnar organization has been shown to exist in area TE, the spatial distribution and possible specificity of backward projections from a single site in area TE are of particular interest. In the current study, we examined these backward projections by using the anterograde tracer Phaseolus vulgaris-leucoagglutinin (PHA-L). PHA-L has the advantage that the injection site can be localized easily to a small region comparable to the size of a column, and single axons can be reconstructed from serial sections. A brief report of the results has appeared elsewhere in abstract form (Suzuki et al., 1997).
MATERIALS AND METHODS
Three Japanese monkeys (Macaca fuscata) weighing 4.6 kg, 4.2 kg, and 3.6 kg were used for examining the backward projection from area TE. In each of the three monkeys (cases 1–3), a single injection of PHA-L was made into the dorsal part of area TE in the right hemisphere. In one monkey (case 2), wheat germ agglutinin-horseradish peroxidase (WGA-HRP) also was injected into the other hemisphere in a separate surgery for a different purpose. Two additional brains that had been used previously in other studies (Saleem et al., 1993) were reanalyzed for forward projections from area TEO to area TE by comparison with the backward projections from area TE.
Surgery and injections
The methods used for surgery and injection have been described in detail by Saleem et al. (1993), Saleem and Tanaka (1996), and Cheng et al. (1997). After an injection of atropine sulfate [0.1 mg/kg, intramuscularly (i.m.)], anesthesia was induced by using ketamine hydrochloride (12 mg/kg, i.m.) followed by an intraperitoneal injection of sodium pentobarbital (35 mg/kg). Tranexamic acid (25 mg/kg, i.m.) was administered to suppress bleeding. Supplementary doses of sodium pentobarbital were given when necessary to maintain the surgical level of anesthesia. After the head was fixed to a stereotaxic apparatus, all surgical procedures were conducted under sterile conditions. The monkey was warmed by using a heating pad throughout the surgery. The body temperature and electrocardiogram were monitored continuously.
After a large craniotomy over the temporal cortex, the dura was dissected to expose a large part of the superior temporal sulcus and the gyrus below it to determine the injection site. PHA-L was injected iontophoretically (Midgard precision current source; Stoelting), according to the procedure recommended by Gerfen and Sawchenko (1984) with some modifications (Saleem et al., 1993). After PHA-L was injected, the dura was sutured, and the wound was closed. Dexamethasone sodium phosphate (1 mg/kg, i.m.) was given at the end of the surgery to reduce edema. The antibiotic piperacillin sodium (55 mg/kg, i.m.) and the analgesic ketoprofen (5 mg/kg, i.m.) were injected daily for 5 days after the surgery.
Perfusion and histologic processing
After a postinjection survival period of 14–18 days, the animals were deeply anesthetized with a lethal intravenous (i.v.) dose of sodium pentobarbital (60–80 mg/kg, i.v.) and were perfused transcardially with 1 liter of 0.9% warm heparinized saline followed by 3–4 liters of 4% paraformaldehyde in 0.1 M phosphate buffer, pH 7.2–7.4, for 30–45 minutes. This was followed successively by 0.5–2.0 liters of 10%, 20%, and 30% sucrose in 0.1 M phosphate buffer. After the perfusion, the brains were removed immediately, blocked, photographed, and kept in 30% cold buffered sucrose, pH 7.2–7.4, at 4°C until they sank. Frozen brain blocks were cut at 35 μm or 40 μm thickness in the plane roughly adjusted to the frontal plane. Transported PHA-L was visualized by using the avidin-biotin immunoperoxidase method described by Gerfen and Sawchenko (1984) with some modifications (Saleem et al., 1993). To reduce nonspecific binding, sections were preincubated in a blocking solution containing 2% normal rabbit serum (NRS; Vector Laboratories, Burlingame, CA) and 0.5% Triton X-100 in 0.05 M Tris-buffered saline (TBS), pH 7.2–7.4, at room temperature for 2 hours. The sections were then incubated in the primary antiserum solution containing goat anti-PHA-L (Vector Laboratories; diluted 1:2000), 0.5% Triton X-100, and 2% NRS in TBS, overnight at room temperature, followed by 24 hours in a cold room (4°C). After washing with TBS, the sections were incubated in biotinylated rabbit anti-goat immunoglobulin G (IgG; Vector Laboratories; 1 drop per 10 ml of TBS containing 0.5% Triton X-100 and 2% NRS) for 75 minutes at room temperature. After washing with TBS, sections were incubated in avidin-biotin complex (ABC) solution (Vector Laboratories; 2 drops of A solution and 2 drops of B solution per 10 ml of TBS containing 0.5% Triton X-100) for 75 minutes, after which the sections were reincubated in biotinylated rabbit anti-goat IgG solution and ABC solution for 60 minutes each. After washing with 0.1 M phosphate buffer, sections were developed in a solution containing 0.05% diaminobenzidine (Sigma, St. Louis, MO), 0.1% nickel-ammonium sulfate in 0.1 M phosphate buffer, and 0.009% H2O2 to visualize transported PHA-L. The experimental protocol was approved by the Experimental Animal Committee of the RIKEN Institute and had conformed to National Institutes of Health guidelines.
Data analysis
PHA-L-labeled axons and terminals in the occipital and temporal lobe of the hemisphere ipsilateral to the injection site were scanned in every section caudal to the injection site by using a light microscope at ×100 or ×200 magnification. Only sections posterior to the injection site were scanned, because the current study was focused on the backward projection from area TE. Projection foci were analyzed with the aid of a camera lucida; labeled axons, labeled terminals, the pial surface, borders between the white matter and the gray matter, and the borders of layer 4 were drawn at ×10 magnification under lightfield or darkfield illumination in sections selected at intervals of 0.40 mm or 0.42 mm.
The overall extent of the projections from the injection site in area TE was mapped in sections selected at intervals of 0.20 mm or 0.21 mm and represented in lateral views of the brain and on unfolded maps of the hemisphere. For distribution in the lateral view of the hemisphere, the labeled axons and terminals were plotted on the lateral surface by aligning the sections with the original photomicrograph of the hemisphere.
The drawing of the unfolded maps followed the procedure of Van Essen and Maunsell (1980) with some modifications. Because the objective was to investigate the backward projection from area TE, the unfolded maps were drawn only in regions posterior to the injection site, i.e., the occipital cortex and the inferotemporal cortex. Thus, the inferior occipital sulcus, the lunate sulcus, the occipitotemporal sulcus, and the superior temporal sulcus were unfolded. In addition to the tangential distribution of the labeled terminals, their laminar distribution also was represented on the unfolded map by coding the different laminar patterns with different colors. For a comparison with the backward projections from area TE to area TEO, the areal extent of the forward projections from area TEO to area TE also was mapped on the unfolded maps.
The V1/V2 border was indicated clearly by the sudden change in the width of layer 4. The borders of areas V2, V4, and TEO were identified from the position of the surrounding sulci in reference to the published areal maps of Gattass et al. (1988), Boussaoud et al. (1991), Distler et al. (1993), and Hikosaka (1998). Taking the anterior middle temporal sulcus as a landmark, area TE was divided into four subregions; the dorsal part of posterior TE (TEpd), the ventral part of posterior TE (TEpv), the dorsal part of anterior TE (TEad), and the ventral part of anterior TE (TEav; Iwai and Yukie, 1988; Yukie et al., 1990). For the sake of simplicity, these subdivisions were not described in the unfolded maps of the backward cases. The area in the ventral bank of the superior temporal sulcus adjoining area TEO dorsally is referred to as PITd, following Felleman and Van Essen (1991). Area PITd has its own retinotopical map distinctive from that of area TEO (Boussaoud et al., 1991; Hikosaka, 1998), but it has been placed at the same hierarchical level as area TEO based on the laminar distribution of cells of origin and the terminations of various projections (Felleman and Van Essen, 1991). The receptive fields of cells in area PITd have sizes similar to those in area TEO (Boussaoud et al., 1991; Hikosaka, 1998), and the stimulus selectivity of cells in area PITd is similar to that of cells in area TEO (Hikosaka, 1997).
The single axons were reconstructed in cases 1 and 2 from serial sections with a camera lucida at ×200 or ×400 magnification. The procedure used for reconstruction has been described in detail by Rockland and Virga (1989), Saleem and Tanaka (1996), and Cheng et al. (1997). The axons were reconstructed by matching their segments in neighboring sections with the aid of other labeled profiles and blood vessels in their vicinity.
It is not necessarily easy to define arbors in the cases of backward axons, because their arborization patterns tend to be more complex than those of forward axons. Rockland et al. (1994) defined arbors of backward axons from areas V4/TEO to areas V2/V1 as the concentrations of terminals that can be bounded or approximated by some regular shape (sphere or cylinder). We simply defined the portion of axon consisting of multiple axonal collaterals with continuous, rich terminals as an arbor, even if the portion could not be approximated by regular shapes. The spatial extent of individual arbors was reconstructed roughly in the original three-dimensional cortical space by aligning the section drawings, and their size was measured along their major axes and the axes orthogonal to the major axis. The bending of the major axis was corrected before the size measurement. The area of an arbor was calculated simply by multiplying the size along major axis and that orthogonal to the major axis. The total terminal field of an axon was defined by the sum of the total area of its arbors. The total terminal field does not include the empty space between arbors. This gives smaller values than those that include the empty space (Rockland et al., 1994; Rockland and Drash, 1996).
RESULTS
Injection sites
All injection sites were localized in the dorsal part of area TE. The injection site was located around the border between TEpd and TEad in case 1, and the injection site was within TEad in both case 2 and case 3. In case 3, it was close to the lip of the superior temporal sulcus (note that the subdivisions of area TE are not indicated in the figures). All injection sites covered layers 3–6 (Fig. 1) and extended 0.3–1.1 mm (average, 0.6 mm) in the plane parallel to the pial surface. PHA-L labeling of injection sites and axons was equally stained in all three cases.

Photomicrograph illustrating the Phaseolus vulgaris-leucoagglutinin (PHA-L) injection site in case 2. The position of this injection site, in the dorsal part of the anterior inferotemporal cortex (area TE; TEad), is indicated by the red dot in the lateral view of the brain in Figure 4. The injection covered layers 3–6 and spanned ≈1 mm along the cortical surface. IV, layer 4; WM, white matter. Scale bar = 1 mm.

Distribution of anterogradely labeled terminals in the posterior part of the inferotemporal cortex and the occipital cortex after PHA-L injection into the border between the dorsal part of posterior TE (TEpd) and the dorsal part of anterior TE (TEad) in case 1. A: Two-dimensional, unfolded map in which the relative density of the labeled terminals is shown. Dashed lines indicate the contour lines of the sections selected at regular intervals of 4.0 mm. The anteroposterior levels of these six contour lines are shown on the lateral view of the hemisphere in C. The thin red line in the unfolded map indicates the V1/V2 border. The red spot indicates the position and size of the injection site. The small dots indicate the labeled terminals. The density of the dots is proportional to the density of labeled terminals. PITd is the area in the ventral bank of the superior temporal sulcus, adjoining TEO dorsally. Only the labeled regions posterior to the injection sites are shown in this figure as well as in Figures 4 and 6. B: The same map shown in A illustrating the laminar distribution of labeled terminals. The red spot indicates the injection site; however, here, its size does not represent the size of the injection. Blue indicates regions with labeled terminals located predominantly in the supragranular layers, dark brown indicates regions with terminals located predominantly in the infragranular layers, light brown indicates regions with terminals distributed equally in the supragranular and infragranular layers, and green indicates regions with terminals distributed equally in all layers, including layer 4. C: Lateral view of the hemisphere with the injection site (red spot) and labeled terminals (small dots). amt, anterior middle temporal sulcus; io, inferior occipital sulcus; lu, lunate sulcus; ot, occipitotemporal sulcus; pmt, posterior middle temporal sulcus; st, superior temporal sulcus. The same conventions are used in Figures 4 and 6.

A–G: Laminar distribution of labeled terminals in sections at the level of area TEO (case 1). The sections were taken at regular intervals of 0.40 mm. The anteroposterior levels of the most posterior section (A) and the most anterior section (F) are indicated by arrows and solid contour lines on the unfolded map at bottom right. Thin lines in the sections indicate the borders of layer 4. Boxed region in D is magnified in G. The same conventions are used in Figure 5.

A–C: Distribution of labeled terminals after PHA-L injection into TEad in case 2. The interval of contour lines was 4.2 mm.
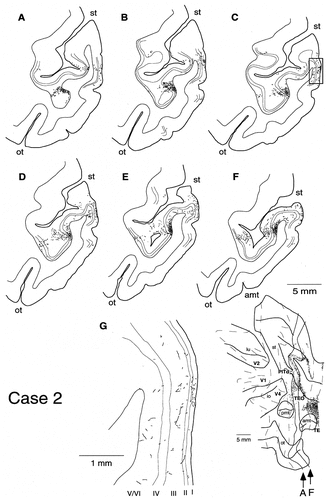
A–G: Laminar distribution of labeled terminals in case 2. The boxed region in C is magnified in G. The sections were taken at regular intervals of 0.42 mm. The medial fundus regions with labeling in B and C are dark brown (predominantly infragranular distribution) in Figure 4, and they are green in D and E (distribution to all layers), and blue in F (predominantly supragranular distribution). The labeled regions in the ventral bank in A–F are dark brown in Figure 4.
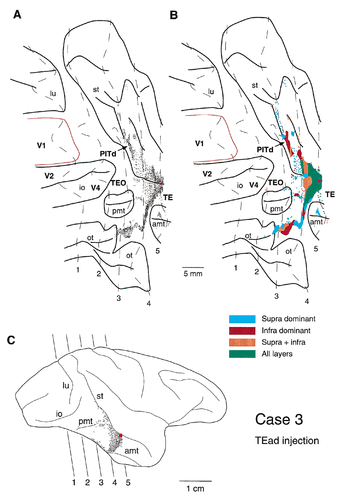
A–C: Distribution of labeled terminals after PHA-L injection into TEad in case 3. The interval of contour lines was 4.2 mm.
Global distribution patterns of labeled terminals
After single PHA-L injections into area TE, labeled terminals were distributed densely and widely in area TEO in all three cases (Figs. 2, 4, 6). Labeled terminals also were distributed densely in area PITd located in the ventral bank of the superior temporal sulcus in cases 2 and 3 and in the fundus of the superior temporal sulcus in case 2. A less dense distribution was observed in areas V4 (cases 1–3), V2 (cases 1 and 2), and V1 (case 1). Because the distribution patterns of labeled terminals were considerably different from case to case, they are described below for the individual cases. Intrinsic connections in area TE are not described.
After an injection into the TEpd/TEad border in case 1, labeled terminals were distributed densely and widely in areas TEO and V4 (Figs. 2, 3). In addition, sparser fields of labeled terminals were observed in areas PITd, V2, and V1. The densest field of labeled terminals in area TEO was found along the dorsal lip of the posterior middle temporal sulcus (Fig. 2, pmt). This field extended about 4 mm anteroposteriorly (AP) × 4 mm dorsoventrally (DV). Another dense field of labeled terminals was found below the inferior occipital sulcus (4 mm AP × 6 mm DV; Fig. 2), and this field invaded area V4 from the posterior part of area TEO. Surrounding these dense distributions, there were more scattered and less dense fields in areas V4 and TEO.
After an injection into TEad in case 2, labeled terminals were observed in areas TEO, PITd, V4, V2, and architectonic divisions of the superior temporal sulcus (Seltzer and Pandya, 1978; Fig. 1). A dense field of labeled terminals was observed particularly in areas TEO and PITd (Figs. 4, 5), in which labeled terminals were distributed continuously from the anterior tip of the posterior middle temporal sulcus to the fundus of the superior temporal sulcus (5 mm AP × 20 mm DV; Fig. 4). In the superior temporal sulcus, this field of labeled terminals split into two bands, both of which were elongated anteroposteriorly. The fields of labeled terminals distributed along the anterior tip of the posterior middle temporal sulcus to the ventral lip of the superior temporal sulcus were located in area TEO, and the two bands in the ventral bank and the fundus of the superior temporal sulcus were located in area PITd. One of the two bands in area PITd that had the densest field of labeled terminals among all of the fields extended farther anterior into the fundus of the superior temporal sulcus. This band may extend into floor of superior temporal area and intrude into architectonic division of the superior temporal sulcus. (Seltzer and Pandya, 1978; Fig. 1) or superior temporal polysensor (Seltzer and Pandya, 1978; Felleman and Van Essen, 1991) at its most anterior part.
A dense focus of labeled terminals was found separately in the ventral part of areas TEO and PITd in case 3, in which the injection was made close to the lip of the superior temporal sulcus (Fig. 6). The field of dense labeled terminals in area TEO was located on the part of the ventral surface that was located lateral to the occipitotemporal sulcus and ventromedial to the posterior middle temporal sulcus. This location is a part of area TEO that represents the visual field with 7–15° eccentricity according to Distler et al. (1993). The distribution was elongated anteroposteriorly (6 mm AP × 2 mm DV; Fig. 6) and continued in a dorsoventrally elongated distribution in the posterior part of area TE. There were scattered fields of the labeled terminals near the anterior and posterior tips of the posterior middle temporal sulcus, the latter of which may have invaded area V4. The dense fields in area PITd in the superior temporal sulcus were elongated anteroposteriorly and were surrounded by a scattered field.
Laminar distribution of labeled terminals
The colored, unfolded maps in Figures 2, 4, and 6 show that most labeled terminals in area TEO were distributed either predominantly in the supragranular layers (layers 1–3; Figs. 2, 4, 6, blue areas) or in both the supragranular and infragranular layers (layers 1–3, 5, and 6; Figs. 2, 4, 6, light brown areas). In a part of the field at the ventral TEO region in case 3, however, the labeled terminals were distributed predominantly in the infragranular layers (Fig. 6, brown areas). The sections in Figures 3 and 5 show that the distribution of labeled terminals in the supragranular layers was not restricted to layer 1 but included layer 2 and the upper part of layer 3 as well, with some inclusion of the lower part of layer 3. This more even distribution of labeled terminals in the supragranular layers was confirmed by the layer's occupation by reconstructed single axons (see below). However, because a majority of the single axons were reconstructed in case 2, we examined the distribution of synaptic boutons further in cases 1 and 3. We found that the labeled synaptic boutons were as dense in layers 2 and 3 as they were in layer 1. In the regions in which the labeled terminals were found in both the supragranular and the infragranular layers, the infragranular distribution of the labeled terminals had a horizontal extent comparable to that seen in the supragranular layers (Figs. 2, 4, 6, light brown areas). The infragranular distribution not only was due to the passing fibers but also represented real terminals, as indicated by the presence of some reconstructed arbors (see below) and the distribution of synaptic boutons (Figs. 7A, 8A) in the infragranular layers. Very few labeled terminals were found in layer 4.
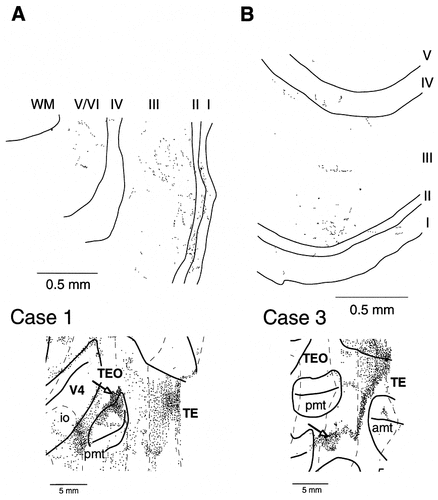
Laminar distribution of labeled synaptic boutons in area TEO from case 1 (A) and from case 3 (B). Arrows in the unfolded maps at the bottom indicate the positions where the illustrated mappings of boutons were obtained. The distributions of labeled boutons in layer 2 and the upper part of layer 3 were as dense as or even denser than the distribution of labeled boutons in layer 1. The coronal section, a part of which is shown in B, contained light brown (supragranular and infragranular distribution) and dark brown (predominantly infragranular distribution) regions as well as a blue region (predominantly supragranular distribution) in Figure 6, but only the blue region is magnified in B.
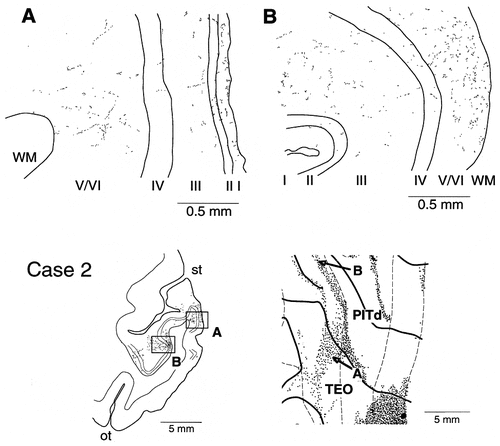
A,B: Laminar distribution of labeled synaptic boutons in case 2. Arrows in the unfolded map at the bottom right and boxes in the coronal section at the bottom left indicate the positions where the illustrated mappings of boutons were obtained. The infragranular distribution was as dense as the supragranular distribution in A, and the infragranular distribution was denser than the supragranular distribution in B.
Labeled terminals in area PITd occurred predominantly in the supragranular layers, in both supragranular and infragranular layers, or predominantly in the infragranular layers (Figs. 4, 6). The predominant distribution in the infragranular layer was not due to the passing fibers, but it represented real terminals, as indicated by the single axon reconstruction (see below) and the mapping of synaptic boutons (Fig. 8B) from this field. The labeled terminals within the supragranular layers were distributed evenly in layers 1 and 2 and in the upper part of layer 3. In case 2, labeled terminals in the fundus of the superior temporal sulcus occupied all layers evenly (Fig. 4, green area; Fig. 5D,E, the most medial distributions). This field is considered to correspond to FST. The labeled terminals in areas V4, V2, and V1 were found exclusively in the supragranular layers.
Single axon reconstruction
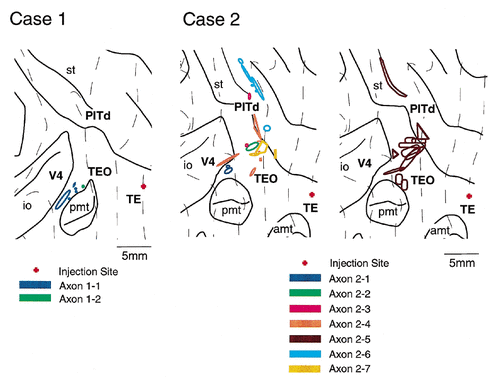
The analysis of the global projection fields showed that the terminals of axons projecting from area TE were distributed widely in areas TEO and PITd and that they were located either predominantly in the supragranular layers or in both the supragranular and the infragranular layers. To determine how widely the terminal field of single axons extended in areas TEO and PITd and how individual axons terminated in different layers, we reconstructed nine single axons (two axons from case 1 and seven axons from case 2). The main axonal trunks of all axons except two (axons 2-2 and 2-3) were traced at least 2 mm in the white matter toward the injection site. The main axonal trunks of axons 2-2 and 2-3 could not be traced, because they were stained only faintly in the white matter. The main axonal trunks of both axons coursed posteriorly before they were then lost. Thus, it is possible that these two axons had other arbors, especially in the more posterior parts, in addition to the arbors reported here.
The reconstructed axons are summarized in Table 1, in which the number, laminar distribution, arbor sizes, and total extent of the terminal fields are described. The number of arbors of individual axons varied from 1 to 12. Many of the arbors were elongated, whereas others were small and circular. The size of individual arbors along their major axes, thus, varied widely from 0.28 mm to 5.80 mm (mean ± S.D., 1.56 ± 1.24). The positions of the reconstructed arbors are shown on the unfolded maps in Figure 9.
| Axon/arbor | Layer | Size (mm)1 | Area (mm2) |
|---|---|---|---|
| 1-1 | |||
| 1-1-1 | 1-3 | 2.47 × 0.09 | 0.714 |
| 1-1-2 | 1-3 | 0.45 × 0.16 | — |
| 1-1-3 | 1-3 | 0.51 × 0.32 | — |
| 1-1-4 | 5-6 | 0.88 × 0.24 | — |
| 1-1-5 | 5-6 | 0.28 × 0.16 | — |
| 1-2 | |||
| 1-2-1 | 1-3 | 0.32 × 0.12 | 0.038 |
| 2-1 | |||
| 2-1-1 | 1-3 | 0.55 × 0.35 | 1.773 |
| 2-1-2 | 1-3 | 1.58 × 1.00 | — |
| 2-2 | |||
| 2-2-1 | 1-3 | 1.40 × 0.50 | 0.700 |
| 2-3 | |||
| 2-3-1 | 5-6 | 0.87 × 0.49 | 0.867 |
| 2-3-2 | 5-6 | 0.70 × 0.63 | — |
| 2-4 | |||
| 2-4-1 | 2-3 | 0.93 × 0.91 | 6.416 |
| 2-4-2 | 1-3 | 0.84 × 0.41 | — |
| 2-4-3 | 1-3 | 0.52 × 0.35 | — |
| 2-4-4 | 1-3 | 0.50 × 0.32 | — |
| 2-4-5 | 1-3 | 3.14 × 0.41 | — |
| 2-4-6 | 1-3 | 5.80 × 0.62 | — |
| 2-5 | |||
| 2-5-1 | 1-3 | 1.85 × 0.11 | 26.46 |
| 2-5-2 | 1-3 | 2.40 × 0.30 | — |
| 2-5-3 | 1-3 | 1.13 × 0.60 | — |
| 2-5-4 | 1-3 | 2.36 × 0.68 | — |
| 2-5-5 | 1-3 | 2.36 × 0.82 | — |
| 2-5-6 | 5-6 | 2.36 × 0.45 | — |
| 2-5-7 | 5-6 | 3.65 × 2.24 | — |
| 2-5-8 | 1-3 | 1.10 × 0.74 | — |
| 2-5-9 | 1-3 | 4.06 × 0.45 | — |
| 2-5-10 | 1-3 | 1.24 × 0.50 | — |
| 2-5-11 | 1-3 | 1.64 × 0.80 | — |
| 2-5-12 | 1-3 | 3.95 × 1.90 | — |
| 2-6 | |||
| 2-6-1 | 5-6 | 1.09 × 0.45 | 2.318 |
| 2-6-2 | 5-6 | 0.49 × 0.26 | — |
| 2-6-3 | 5-6 | 0.35 × 0.14 | — |
| 2-6-4 | 5-6 | 1.12 × 0.69 | — |
| 2-6-5 | 5-6 | 2.03 × 0.30 | — |
| 2-6-6 | 5-6 | 0.77 × 0.35 | — |
| 2-7 | |||
| 2-7-1 | 1 | 1.55 × 0.86 | 1.947 |
| 2-7-2 | 1 | 0.87 × 0.45 | — |
| 2-7-3 | 1 | 1.06 × 0.21 | — |
- 1 Sizes of arbors were measured along their major axes and the axes perpendicular to the major axes.
Almost all of the reconstructed arbors were distributed either in the supragranular layers or the infragranular layers and did not invade into layer 4. Different from other backward axons in the earlier visual stages, the distribution of axonal terminals was not limited to layer 1 except for one axon (axon 2-7). Arbors were found both in layers 1–3 and in layers 5 and 6 for two axons, in layers 1–3 for four axons, in layer 1 only for one axon, and in layers 5 and 6 for two axons. The features of the reconstructed axons are described separately below for these four axon types. This classification is only for the convenience of description, because the number of axons studied was too few for a formal classification.
Axons with arbors in both the supragranular and the infragranular layers.
Two single axons had distinct arbors in the supragranular layers and in the infragranular layers. The total size of the terminal field of axon 2-5 (Fig. 10) was the greatest among the reconstructed axons. The main axonal trunk fanned out into six branches in the white matter near the ventral lip of the superior temporal sulcus. Each branch, after entering the gray matter, bifurcated further many times in different layers, and the collaterals extended in different directions, resulting in a complicated arborization pattern. These complicated morphologic patterns were common to most other axons. Axon 2-5 had 12 arbors that were distributed in area TEO (10 arbors) and area PITd (2 arbors). Ten of the 12 arbors were continuous with small overlaps, but the remaining two arbors were well isolated by a distance of 4–5mm (Fig. 9, right, brown area). The distance between the distal ends of the farthest two arbors was 15 mm on the unfolded map. The sizes of individual arbors were mostly >1 mm and often >3 mm, as shown in Table 1. Among the 12 arbors, 10 were located in the supragranular layers, and 2 were located in the infragranular layers. One of the 2 infragranular arbors (arbor 6) overlapped partially with 2 supragranular arbors (arbors 4 and 5) on the unfolded map, but the other infragranular arbor (arbor 7) did not overlap with the supragranular arbors. Two of the supragranular arbors (arbors 4 and 5) and the 2 infragranular arbors (arbors 6 and 7) are shown in Figure 10. The terminals in the supragranular layers were distributed evenly from layer 1 to layer 3. The collaterals of the arbors in the infragranular layers ramified as richly and extended as widely (2.36 mm and 3.65 mm) as those in the supragranular layers, from which, thus, they were indistinguishable.
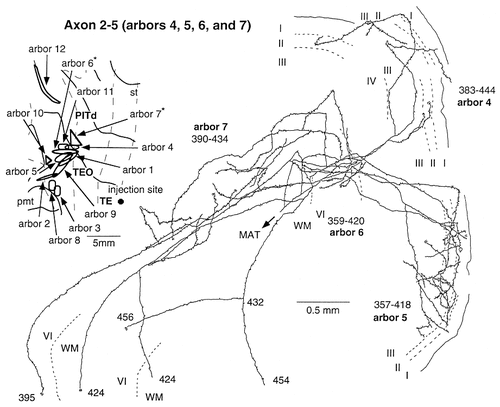
Camera lucida reconstruction of axons 2–5 projecting from TEad to area TEO. Only 4 of the 12 arbors are shown (arbors 4–7) to facilitate observation. Ten arbors, including arbors 4 and 5, were located in the supragranular layers, and the remaining two (arbors 6 and 7) were located in the infragranular layers. The extents of all arbors of the axon are indicated by the contours on the unfolded map at the top left. Arbors in the infragranular layers are indicated by asterisks in the unfolded map. The numbers indicate the serial numbers of sections (35 μm thickness) counted from caudal to rostral. Dashed lines indicate the borders between layers. Some branches that could not be traced due to thin axonal trunks are indicated by double-line segments. Dots on the axonal arbors indicate varicosities and terminal swellings. MAT, main axonal trunk; WM, white matter. The same conventions are used in Figures 11-16.
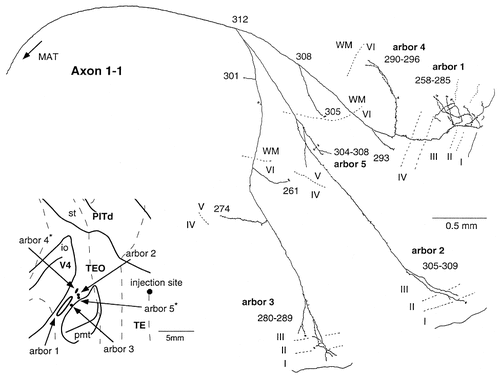
Camera lucida reconstruction of axon 1-1 projecting from the TEpd/TEad border to area TEO and presumably area V4. This axon had five arbors: three located in the supragranular layers and two in the infragranular layers. The locations of arbors 1 and 4 may be part of area V4. The thickness of the sections was 40 μm.
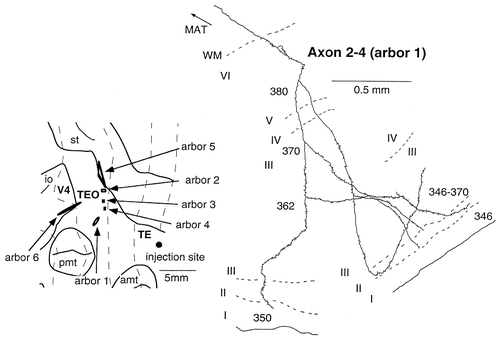
Camera lucida reconstruction of axon 2-4 projecting from TEad to area TEO. This axon had six arbors, all of which were located in the supragranular layers. Only one arbor is shown.
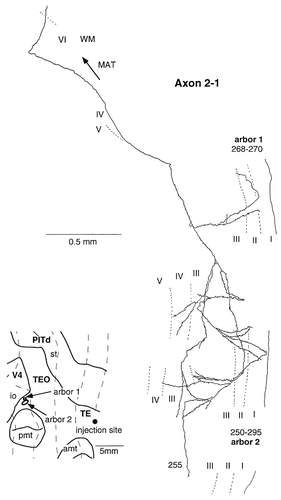
Camera lucida reconstruction of axon 2-1 projecting from TEad to area TEO. This axon had two arbors: One arbor (arbor 1) was limited in the supragranular layers, and the other arbor (arbor 2) also was located mainly in the supragranular layers but with minor terminals in layer 4.
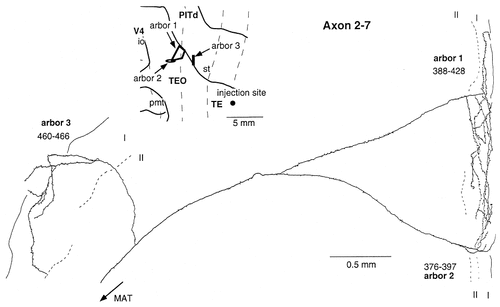
Camera lucida reconstruction of axon 2-7 projecting from TEad to areas TEO and PITd. This axon had 3 arbors, all of which were limited to layer 1.
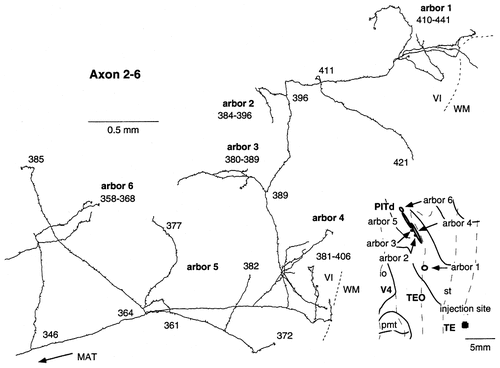
Camera lucida reconstruction of axon 2-6 projecting from TEad to area PITd. This axon had six arbors located in the infragranular layers. Although all of these arbors may be interpreted as parts of a single arbor, we divided them into six to be consistent with the conclusion of this paper that arbors of TE-to-TEO axons tend to be large.
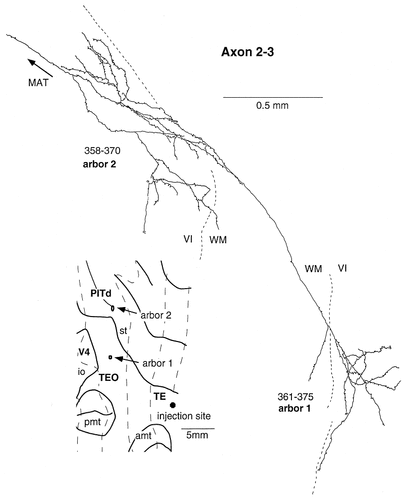
Camera lucida reconstruction of axon 2-3 projecting from TEad to areas TEO and PITd. This axon had 2 arbors, both of which were located in the infragranular layers.
Axon 1-1 (Fig. 11) had five discrete arbors: three located in the supragranular layers and two located in the infragranular layers. No supragranular arbors overlapped with any infragranular arbors on the unfolded map. There also were some linear collaterals with terminals in the infragranular layers. The sizes of the arbors of this axon (0.28–2.47 mm) were smaller than those of axon 2-5.
Axons with arbors only in the supragranular layers.
Four axons, including axon 2-4 shown in Figure 12 and axon 2-1 shown in Figure 13, had arbors only in the supragranular layers. Their arbors occupied layers 1–3.
Axon 2-4 terminated widely in discrete regions of area TEO (Fig. 12, left inset). The main axonal trunk formed four branches in the white matter, each of which gave off many collaterals in the gray matter, especially in layer 3. Altogether, six arbors were formed. Two of the arbors extended more than 1 mm (3.14 and 5.80 mm; Table 1). All six arbors covered layers 2 and 3, concentrating in layer 3, as shown in Figure 12. They extended close to layer 4 but did not enter it. There were some terminals in layers 5 and 6, the majority of which were along the main axonal trunks of the collaterals.
Axon 2-1 (Fig. 13) ramified richly in layer 3 to form two arbors. The size of one arbor was ≈1.6 mm, but the other was smaller. Most of the terminals were distributed in layers 2 and 3. There were a few terminals in layers 1 and 4.
Axons with arbors only in layer 1.
Only one of the nine reconstructed axons had arbors that remained exclusively in layer 1 (axon 2-7; Fig. 14), although this termination pattern is typical among backward projecting axons in earlier visual areas (Rockland and Virga, 1989; Rockland et al., 1994; Rockland and Drash, 1996). Axon 2-7 was reconstructed from the TEO region close to the lip of the superior temporal sulcus. The main axonal trunk branched into three branches in the infragranular layers at the lip of the superior temporal sulcus. These three branches ascended to layer 1 without any collaterals in layers 2–6 to ramify richly in layer 1. Two arbors were located in the lateral surface, and one arbor was located at the shallowest part of the ventral bank of the superior temporal sulcus. The size of the arbors ranged from 0.87 mm to 1.55 mm.
Along with axon 2-7, we reconstructed one arbor that was elongated horizontally in layer 1 with dense terminals. However, because we failed to find its main axonal trunk, it is possible that the axon had other arbors in other layers.
Axons with arbors only in the infragranular layers.
We found two axons that terminated only in the infragranular layers (axons 2-3 and 2-6). The arbors of these axons ramified richly and were very widely elongated (0.35–2.03 mm; Table 1). Axon 2-6 (Fig. 15) had six arbors in the ventral bank of the superior temporal sulcus, which corresponds to area PITd. Axon 2-3 (Fig. 16) had one arbor in area TEO and one arbor in area PITd.
Comparison of backward and forward projections
To compare the backward projections from area TE to areas TEO and PITd with the forward projections from area TEO to area TE, we reanalyzed two previous cases in which focal PHA-L injections were made into area TEO (Saleem et al., 1993). Cases 1 and 2 from Saleem et al. (1993) are designated as cases 4 and 5, respectively, in this paper. The injection sites in area TEO were located at the dorsal part of the lateral surface, where the central visual field is represented (Boussaoud et al., 1991).
The distribution of labeled axons and terminals in case 4 is shown in Figure 17A. There were two dense patches of labeled axons, one in TEpd and one in TEad, surrounded by a sparser zone. In case 5, there were four dense patches in TEpd, again surrounded by a sparser distribution (not shown). The global terminal field of the forward projections from the dorsolateral surface of area TEO, thus, was confined to a territory in the dorsolateral surface of area TE. This is in contrast with the widely divergent terminal fields of axons projecting backward from the dorsolateral surface of area TE to the regions in areas TEO/PITd. In the backward projection cases, the labeled terminals targeted the dorsolateral surface, the ventral bank, and the floor of the superior temporal sulcus in all three cases (cases 1–3) and targeted the ventral surface up to the lip of the occipitotemporal sulcus in two cases (cases 1 and 3).
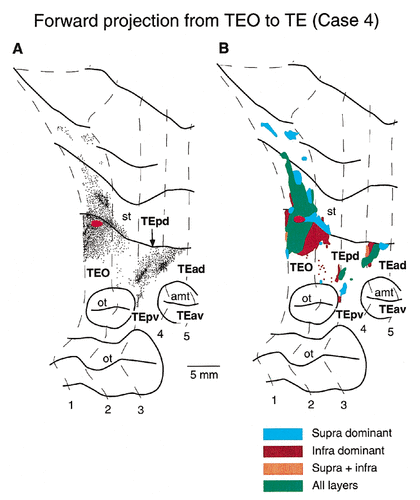
Distribution of anterogradely labeled axons and terminals in area TE after a focal PHA-L injection into area TEO. A: The relative density of the labeled axons and terminals is shown in the unfolded map. The red-filled ellipse in area TEO indicates the position and size of the injection site. The interval between contour lines of the sections is 4.0 mm. B: Laminar distribution of the labeled terminals. For conventions and abbreviations, see Figures 2, 4, and 6.
The labeling was found only in the infragranular layers in a large part of the sparse regions in both forward cases 4 and 5. To determine whether such labeling with only infragranular distribution contained terminals or only passing fibers, we partially reconstructed ten axons that were selected randomly from the regions. The ten axons were reconstructed for at least 1 mm, but no terminals were found along the axonal trunk in the infragranular layers. Based on these results, we concluded that the labeled axons in these surrounding regions, at the least, were composed mostly of passing fibers without terminals. We excluded these surrounding, sparsely labeled regions with exclusive infragranular distribution from the measure of the global terminal fields in the forward cases.
The distribution of labeled axons in areas TEO and PITd after focal injections into area TE also contained regions with an exclusive infragranular distribution of labeled axons. However, the labeling was as dense in these regions as that seen in other regions with dominant supragranular distribution, and the distribution of labeled synaptic boutons was much denser in the infragranular layers than in the supragranular layers (Fig. 8B). In addition, we reconstructed a wide terminal arbor that was restricted in the infragranular layers in these regions (axon 2-6). Thus, we concluded that the regions in areas TEO and PITd with dominant infragranular distribution contained terminals as well as passing fibers in the backward cases.
The areal extent of global terminal fields in area TE in the forward cases measured 8.6 mm2 in case 4 and 9.4 mm2 in case 5. These values were smaller than the areal extent of the global terminal fields in area TEO in the backward cases (20.6 mm2 in case 1, 14.7 mm2 in case 2, and 11.3 mm2 in case 3).
The individual arbors of backward axons projecting from area TE to areas TEO and PITd also were larger than those of forward axons projecting from area TEO to area TE. The frequency distribution of the size of individual arbors along their major axes is shown in Figure 18 for both forward axons and backward axons. The arbors of forward axons were smaller than 0.6 mm, whereas the arbors of backward axons varied considerably in size. The total area of terminal fields of the backward-projecting axons also was larger than that of the forward-projecting axons. The total area of the terminal field ranged from 0.06 mm2 to 0.43 mm2 for the forward axons, whereas it was larger without overlap for all of the backward axons except one (axon 1-2; 0.038 mm2; Table 1).
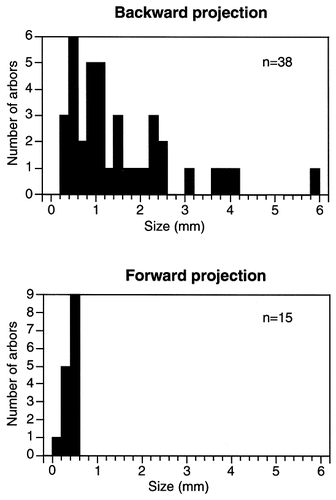
Frequency distribution of the size of arbors along their major axes for the backward axons projecting from area TE to areas TEO and PITd (A) and forward axons projecting from area TEO to area TE (B). The data for forward axons were taken from Saleem et al. (1993).
DISCUSSION
By mapping the distribution of terminals and reconstructing single axons after focal injections of PHA-L, we found that the backward projections from area TE to areas TEO/PITd are more divergent than the forward projections from area TEO to area TE. We also found that the single axons projecting from area TE to areas TEO/PITd have more variable laminar patterns of terminals than those of the backward axons in earlier visual stages.
Divergence of terminal fields
The current study showed that the termination of the backward projections from area TE to areas TEO/PITd was more divergent than that of the forward projections from area TEO to area TE. This was true at three levels: global distribution of axons projecting from a single site, total terminal fields of single axons, and the size of individual arbors. The measurement of the global distribution of axons projecting from a single site was possible because of the single-focus injection of tracers in the current study.
Previous studies also showed the divergence of backward projections in earlier visual stages. Injections of WGA-HRP into areas MT and V4 resulted in labeled terminals across two or three CO compartments in area V2 (Krubitzer and Kaas, 1989, 1990; Shipp and Zeki, 1989; Zeki and Shipp, 1989). By combining anatomic tracing with electrophysiologic mapping, Salin et al. (1992) showed that backward projections from the cat area 18 to area 17 occasionally originate in regions with receptive fields that do not overlap with the receptive fields of the target region, whereas the receptive fields of area 17 regions always overlap with the receptive fields of the area 18 regions to which they project (Price et al., 1994). Backward axons from area V2 to area V1 and those from area V4 to area V2 have arbors distributed along 1–2 mm long, elongated terminal fields (Rockland and Virga, 1989; Rockland et al., 1994), whereas forward axons from area V1 to area V2 and those from area V2 to area V4 have one to three distinctive arbors, each of which measured ≈200 μm (Rockland, 1992, 1997; Rockland and Virga, 1990). Backward axons from area TEO, from the ventromedial part of area TE, and from area lateral parahippocampal cortex to earlier visual areas also extend several millimeters (Rockland et al., 1994; Rockland and Drash, 1996).
The backward projections from area TE also are divergent, in that they have dense fields of terminals and several single axons that terminate in more than a single area, namely, in area PITd as well as area TEO. Area PITd, which is located in the ventral bank of the superior temporal sulcus adjoining area TEO at the lip, has been shown to be involved in the ventral visual pathway. Previous anatomic studies showed that area PITd receives projections from area V4 (Van Essen et al., 1990; Distler et al., 1993) and projects to area TE (Shiwa, 1987; Morel and Bullier, 1990; Baizer et al., 1991) and to the anterior regions in the ventral bank of the superior temporal sulcus (Seltzer and Pandya, 1989, 1994). Area PITd also was shown to have strong reciprocal connections with area TEO (Distler et al., 1993). The laminar distributions of cells of origin and terminals of these connections suggest that area PITd is located at the same hierarchical level as area TEO. Area PITd is similar to area TEO in the size of its receptive fields and in its stimulus selectivity (Hikosaka, 1997, 1998), although areas PITd and TEO have separate retinotopical maps (Boussaoud et al., 1991; Hikosaka, 1998). Because a combined lesion of area TEO and area PITd evoked a deficit in shape discrimination learning (Kikuchi and Iwai, 1980), although an isolated lesion of area TEO did not show the deficit (Yaginuma, 1994), areas TEO and PITd likely work in parallel in the processing of shape information.
The divergent backward projections from area TE covered not only areas TEO and PITd but also areas V4, V2, and V1, although these remote projections had less dense terminals than those of the projections from area TE to areas TEO/PITd. The backward projections from area TE to areas V2 and V1 are not reciprocal: Areas V1 and V2 do not project to area TE. Kennedy and Bullier (1985) first reported the projections from the inferotemporal cortex to areas V1 and V2, although the location of the origin of the projections in the inferotemporal cortex was not described in that paper. Rockland and Van Hoesen (1994) and Rockland and Drash (1996) found backward projections from the ventral part of area TE to areas V2 and V1. We generalized the presence of the remote projections to areas V2 and V1 to the dorsal part of area TE.
Laminar pattern of single axon termination
The typical axons of backward projections ascend to layer 1, turn asymmetrically in one direction, and travel for long distances in layer 1 (Rockland and Virga, 1989; Rockland et al., 1994; Rockland and Drash, 1996). Main arborizations were found consistently in layers 1 and 2 and inconsistently in the infragranular layers and the upper part of layer 3. This summary is based on projections from area V2 to area V1, from area V4 to area V2 and area V1, from area TEO to area V2 and area V1, and from area TE and area TF to area V2 and area V1. The axons that were reconstructed in the current study in areas TEO and PITd after injection of PHA-L into area TE were confined less strictly to layers 1 and 2. There were axons with arbors 1) in layers 1–3, 2) in layers 5 and 6, 3) in layers 1–3 and 5 and 6, and 4) in layer 1 only (Fig. 19). The axons with terminals in layers 1–3 branched many times in layers 2 and 3, and the axonal collaterals ran in different directions. These characteristics result in a different morphology from that of the backward axons found in earlier visual areas. There also were single axons that terminated only in the infragranular layers: These have not been reported in previous studies.
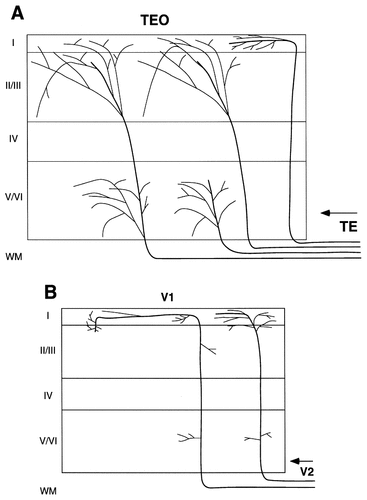
Schematic diagrams showing the termination patterns of backward single axons. A: Four arborization patterns found in the backward projection from area TE to area TEO showing those distributed in layers 1–3 (second from right), in layers 5 and 6 (second from left), in layers 1–3 and 5 and 6 (far left), or only in layer 1 (far right). B: Typical arborization patterns reported previously in backward projections from V2 to V1 (Rockland and Virga, 1989).
Although the number of reconstructed axons was limited in the current study, the conclusions discussed above are supported by the results of mapping labeled synaptic boutons (Figs. 7, 8). The labeled synaptic boutons were distributed densely in layers 3, 5, and 6 as well as in layers 1 and 2. The axons with terminals in layers 3, 5, and 6, at least, should be as numerous as those with terminals exclusively in layers 1 and 2. The variety in the laminar pattern of termination may be related to the difference in layer localization of parent neurons. The backward projections from area TE originate in cells in layers 3, 5, and 6 (Shiwa, 1987; Distler et al., 1993). However, because there are no data available on the relation between the laminar localization of parent neurons and the laminar pattern of termination for the backward projections from area TE to areas TEO/PITd or on the backward projections in earlier visual stages, at present, we cannot discuss this issue further.
The laminar pattern of TE-to-TEO/PITd projections have some similarity to those of long, horizontal connections within individual cortical areas that have been examined in the primary sensory areas (Gilbert and Wiesel, 1983; Ojima et al., 1991, 1992) and in area TE (Fujita and Fujita, 1996). In these long, horizontal connections, also, some axons terminate mainly in layers 1–3, some others terminate mainly in layers 5 and 6, and yet others terminate both in layers 1–3 and in layers 5 and 6. There also are axons that terminate mainly in layer 4, but their numbers are fewer. Different from the TE-to-TEO/PITd projections, however, axons that terminate exclusively in layer 1 have not been reported in the long, horizontal connections. Thus, one possible interpretation of the deviation in the laminar termination pattern of TE-to-TEO/ PITd projections from that of backward projections in earlier visual stages is that the TE-to-TEO/PITd projections contain axon types that usually exist in intrinsic, long, horizontal connections as well as those that exist in typical backward projections.
The laminar pattern of terminal distributions of TEO-to-TE forward projections also is distinct from the pattern of forward projections in earlier visual stages. The terminations of axons of forward projections in earlier visual stages mostly are limited to layer 4 and the lower part of layer 3. In TEO-to-TE forward projections, however, the overall distribution of terminations extended to all of the layers from layer 1 to layer 6, although the distribution of terminations in layer 4 still was the densest (Saleem et al., 1993). Thus, TEO-to-TE projections also may contain axon types that usually exist in intrinsic, long, horizontal connections as well as those that exist in typical forward projections.
Functional implications of backward projections from TE to TEO
Previous single-cell recording and optical imaging experiments (Fujita et al., 1992; Wang et al., 1996) showed that cells with similar stimulus selectivity cluster in columnar regions in area TE. Anatomic studies suggested that there is also columnar structure in area TEO (Fujita and Fujita, 1996), although a smaller proportion of area TEO cells respond selectively to complex visual features than the proportion of such cells in area TE (Kobatake and Tanaka, 1994). The forward projection from a focal site in area TEO terminates at two to four distinctive foci in area TE, each of which is as small as area TE columns (<0.5 mm; Saleem et al., 1993). The current study showed that cells in a focal site of area TE projected to a wide area of area TEO (11–20 mm2). The total terminal fields of single axons that compose the latter projection was at least several times as large as the columnar size (assuming 0.5 mm × 0.5 mm). These wide terminal fields of single axons provide the possibility that the backward projections contribute more to the integration of information across columns representing different features than the forward projections.
One clue to the functional specificity of backward projections is their postsynaptic targets and their place in the cortical circuitry of excitation and inhibition. The postsynaptic targets of backward projections, however, have not been elucidated fully. Johnson and Burkhalter (1996) suggested that the backward projections from lateromedial area, which is a secondary visual area in the rat, to area V1 terminated almost exclusively on spines of pyramidal cells, whereas Rockland and Douglas (1993) and Rockland (1997) observed that backward axons projecting from area V2 to area V1 in the monkey terminated on dendritic shafts in 18% of cases. However, Rockland and Douglas (1993) also suggested that the location of the remaining majority of terminations was the spines of pyramidal cells. Thus, backward projections have a direct, excitatory influence on pyramidal neurons in layers 2, 3, 5, and 6, which compose outputs to other sites of the brain. Terminations in layer 1, however, may have relatively weak excitatory influence on these cells, because the synapses in layer 1 are located on the distal ends of their apical dendrites. On the other hand, Cauller and Connors (1994) showed that inputs to layer 1 evoke long-lasting excitatory potentials in pyramidal cells. An inhibitory influence on pyramidal cells, if it is present, is not strong enough to cut off the excitatory potentials. Shao and Burkhalter (1996) and Nowak et al. (1997) also showed that responses of cells in rat area V1 to the stimulation of the backward projection from area LM were composed only of depolarizing potentials. These weak but long-lasting excitatory potentials evoked by axonal terminations in layer 1 may be appropriate for providing general excitation bias to the pyramidal cells.
Termination of axons in layers 2 and 3 and layers 5 and 6 may exert a strong excitatory influence on the pyramidal cells in these layers through synapses on their proximal dendrites and cell bodies. However, axons in these layers also have abundant opportunities to contact inhibitory interneurons. In the case of intrinsic horizontal connections in area V1, the postsynaptic targets were the dendritic spines of pyramidal cells in 80% of cases and the dendritic shafts of smooth stellate cells in 20% of cases (McGuire et al., 1991). The latter cells are inhibitory interneurons. Moreover, the electrical stimulation of the horizontal fibers evoked transient excitatory potentials followed by inhibitory potentials in area V1 (Hirsch and Gilbert, 1991). The combination of excitatory and inhibitory connections may be more advantageous in constituting particular connections for processing complex and specific information. Thus, the backward projections from area TE to area TEO/PITd, by having more variety in the laminar pattern of their terminals, may contribute to specific, individually different interactions as well as the general spread of activation bias among multiple cortical columns representing different features in areas TEO and PITd.
However, this is only one possibility. Further anatomic and physiologic studies are needed before we can discuss definitively the functional roles of TE-to-TEO/PITd backward projections. In particular, the postsynaptic targets of TE-to-TEO/PITd projections must be examined directly because of obvious examples of interareal variability: For example, the proportion of terminations on inhibitory interneurons has been reported to be much smaller for the horizontal connections in the prefrontal cortex than that in area V1 (Melchitzky et al., 1998).
Acknowledgements
The authors thank K. Cheng and A.H. Asiya Begum for surgical and histologic assistance.


