Distribution of voltage-gated sodium channel α-subunit and β-subunit mRNAs in human hippocampal formation, cortex, and cerebellum
Abstract
The distribution of mRNAs encoding voltage-gated sodium channel α subunits (I, II, III, and VI) and β subunits (β1 and β2) was studied in selected regions of the human brain by Northern blot and in situ hybridisation experiments. Northern blot analysis showed that all regions studied exhibited heterogenous expression of sodium channel transcripts. In situ hybridisation experiments confirmed these findings and revealed a predominantly neuronal distribution. In the parahippocampal gyrus, subtypes II and VI and the β-subunit mRNAs exhibited robust expression in the granule cells of the dentate gyrus and pyramidal cell layer of the hippocampus. Subtypes I and III showed moderate expression in granule cells and low expression in the pyramidal cell layer. Distinct expression patterns were also observed in the cortical layers of the middle frontal gyrus and in the entorhinal cortex. In particular, all subtypes exhibited higher levels of expression in cortical layers III, V, and VI compared with layers I and II. All subtypes were expressed in the granular layer of the cerebellum, whereas specific expression of subtypes I, VI, β1, and β2 mRNAs was observed in Purkinje cells. Subtypes I, VI, and β1 mRNAs were expressed, at varying levels, in the pyramidal cells of the deep cerebellar nuclei. These data indicate that, as in rat, human brain sodium channel mRNAs have a distinct regional distribution, with individual cell types expressing different compliments of sodium channels. The differential distribution of sodium channel subtypes suggest that they have distinct roles that are likely to be of paramount importance in maintaining the functional heterogeneity of central nervous system neurons. J. Comp. Neurol. 422:123–139, 2000. © 2000 Wiley-Liss, Inc.
Voltage-gated sodium channels play a vital role in electrical signalling in the nervous system and are responsible for the initiation and propagation of action potentials (Hille, 1992). The sodium channel protein has been purified from rat brain (Barhanin et al., 1983; Hartshorne and Catterall, 1984; Elmer et al., 1985) skeletal muscle (Barchi et al., 1980), and the electroplax eel (Miller et al., 1983). Brain sodium channels are heteromultimeric proteins that consist of a heavily glycosylated α subunit (Mr 260 kDa) linked noncovalently to a β1 subunit (Mr 36 kDa) and to a β2 subunit (Mr 33 kDa) through a disulphide linkage. To date, four major brain α-subunit isoforms and two β-subunit isoforms have been cloned from rat brain, including: αI and αII (Noda et al., 1986a), αIII (Kayano et al., 1988), αVI (Schaller et al., 1995), β1 (Isom et al., 1992), and β2 (Isom et al., 1995b).
Studies in oocytes indicate that the α subunit is both necessary and sufficient for the formation of functional sodium channels (Noda et al., 1986b; Suzuki et al., 1988). In vitro coexpression studies with rat brain IIA and β1 subunits in Xenopus oocytes have revealed that β1 modulates the function of the α subunit by increasing peak current, accelerating sodium channel activation and inactivation, and altering the voltage dependence of inactivation (Isom et al., 1992; Earl Patton et al., 1994). In mammalian cell lines, α subunits activate and inactivate rapidly when they are expressed alone (Scheuer et al., 1990; West et al., 1992). The coexpression of β1 shifts voltage dependence of activation and inactivation to more negative membrane potentials and increases peak currents (Isom et al., 1995a). The β subunits contain an immunoglobulin (Ig)-like motif with structural similarity to the neural cell adhesion molecules (CAM), which may localise the sodium channel in a particular region of the cell membrane by interaction with the extracellular matrix proteins tenascin-C and tenascin-R (Isom et al., 1995b; Srinivasan et al., 1998). Recent studies have found that these motifs enable the β subunits to function as CAMs and modulate sodium channel activity upon interaction with tenascin-R (Xiao et al., 1999). Such functional modulation also has been indicated in studies of tenascin-R knockout mice (Weber et al., 1999).
Sodium channel α and β subunits show a defined temporal and spatial distribution in the rat central nervous system (CNS) revealed by immunoprecipitation (Gordon et al., 1987), Northern blot analysis (Beckh et al., 1989), reverse transcriptase-polymerase chain reaction (RT-PCR; Yarowsky et al., 1991), in situ hybridisation (Brysch et al., 1991; Furuyama et al., 1993; Black et al., 1994; Schaller et al., 1995; Felts et al., 1997; Gastaldi et al., 1997, 1998; Levy-Mozziconacci et al., 1998), and immunohistochemistry (Westenbroek et al., 1989). These studies show that the expression of sodium channel type I begins to increase after birth and, in the adult, is highest in caudal regions (e.g., colliculus and medulla pons) of the CNS. Conversely, type II is expressed throughout development and shows higher levels in rostral regions (e.g., cortex, hippocampus, striatum, and midbrain). In all regions of the CNS, sodium channel type III attains maximum levels around birth and decreases to negligible levels in the adult, except in certain discrete regions (e.g., medial habenula nucleus, locus coeruleus). Sodium channel type VI is expressed broadly in the CNS with no caudal-rostral bias. The β subunits show a broad expression pattern in rat CNS (Oh et al., 1994; Levy-Mozziconacci et al., 1998). Differential distribution of sodium channels also occurs within individual neurons; immunohistochemistry has revealed that type I expression is the highest in neuronal somata, whereas type II is localised on unmyelinated projection fibres (Westenbroek et al., 1989). Such complimentary distribution may have important functional consequences. Further functional complexity arises from the fact that individual sodium channels can exhibit multiple gating modes (Moorman et al., 1990) and that neurons express multiple sodium channel subtypes (Black and Waxman, 1996). For example, it has been proposed that the coexpression of sodium channel types I and VI results in the transient and sustained sodium conductances of mammalian Purkinje cells (Vega-Saenz De Meira et al., 1997; Smith and Goldin, 1998; Smith et al., 1998).
To date, detailed studies of sodium channel expression in the normal mammalian CNS have been limited to the rat. Two human distribution studies have been carried out that were limited to a comparison of subtypes I and II and that used a ligase detection method (Lu et al., 1992; Lombardo et al., 1996). Because neuronal sodium channels represent important potential drug targets, detailed knowledge of their distribution in human CNS is of clear importance and provides a starting point for research into neurologic diseases, such as temporal lobe epilepsy. In view of the importance of voltage-gated sodium channels in neuronal function, we carried out a detailed study of sodium channel α- and β-subunit mRNA distribution in selected human brain regions by using in situ hybridisation. Our results indicate that sodium channel α and β subunits have distinct regional expression patterns in the human CNS. These results have been reported previously in preliminary form (Whitaker et al., 1999).
Abbreviations
-
- A
-
Ammon's Horn
-
- CA1–CA4
-
fields CA1–CA4 of the hippocampus
-
- CNS
-
central nervous system
-
- DCN
-
deep cerebellar nucleus
-
- DG
-
dentate gyrus
-
- GL
-
granular layer
-
- ML
-
molecular layer
-
- MTN
-
multiple tissue Northern blot
-
- S
-
subiculum
-
- TC
-
temporal cortex
-
- UTR
-
untranslated region
MATERIALS AND METHODS
Human tissue
Human brain tissue was obtained from the New Zealand Neurological Foundation Human Brain Bank at the University of Auckland by using ethical consent procedures approved by the University of Auckland Human Subjects Ethics Committee. Each case had no previous history of neurologic illness, and postmortem delay times were between 6 hours and 18 hours (Table 1).
| Specimen | Gender | Age (yrs) | PM delay | Areas examined | Cause of death |
|---|---|---|---|---|---|
| H104 | Male | 69 | 14 hours | CB, MFG, HP | CAD |
| H98 | Male | 60 | 18 hours | CB, MFG | MI |
| H86 | Male | 74 | 15.5 hours | CB, MFG, HP | MI |
| H76 | Male | 67 | 6 hours | CB, MFG, HP | RA |
| H82 | Male | 21 | 8.5 hours | CB, MFG | CMP |
| H57 | Male | 50 | 9.5 hours | CB, MFG, HP | MI |
| H108 | Male | 58 | 16 hours | HP | CA |
| H105 | Male | 81 | 6.5 hours | HP | SA |
- 1 CB, cerebellum; MFG, middle frontal gyrus; HP, hippocampus; CAD, coronary artery disease; MI, myocardial infarction; RA, ruptured aorta; CMP, carbon monoxide poisoning; CA, coronary atherosclerosis; SA, subarachnoid haemorrhage.
Oligonucleotide probes and radiolabelling for in situ hybridisation
Two specific antisense oligonucleotide probes (36mers) were designed for each subtype by using cDNA sequences of cloned human brain sodium channels (Table 2). For the α subunits, one probe was located within the coding region, and the other probe was located in the 3′ untranslated region (UTR), whereas, for the β subunits, both probes were located within the coding region. In all cases, probes were chosen from regions of very low homology, thus avoiding cross hybridisation. Candidate probes were screened for homology to other genes by using a “blastn” search of the GenBank database (October, 1999). These searches revealed that each oligonucleotide shared little homology to closely related channels. After synthesis, the oligonucleotides were purified by using reverse-phase, high-performance liquid chromatography.
|
Subtype |
Sequence and nucleotide position |
GenBank accession no. |
Reference |
|---|---|---|---|
|
Type I |
1,399–1,434, CTGCCTGCTGCACTGGGCTCTCTGGAATGTTCTGAG; 6,282–6,317, CCCCTTGAAACTGGTCCCTACAGTCTGACTAGCCAT |
— |
A. Powell, unpublished |
|
Type II |
4,233–4,268, GCTTTGCACTCACTGTAGTTGTTGACCACGCTTACAC; 6,176–6,211, CCTCCTGTGGGAGTCCTGTTGACACAAACACATCAC |
M94055 |
Ahmed et al., 1992 |
|
Type III |
902–937, TGTGCTCATTGTTACATTAACAAATGTCCCATTTGA; |
— |
Y. Chen, unpublished |
|
6,233–6,268, GCCATTGGGTTTCTCCTCAGCAGTGTCAGCTGGTAA |
|||
|
Type VI |
2,053–2,089, GTTGATTCTGTCCTTCCGCCCGTAGGAGGCTAATTG; 6,720–6,755, TTGGTTGTTTCCCTACCCAGAAGGTGTATGAAGGAC |
— |
S. Burbidge, unpublished |
|
β1 |
382–417, AAGATAGACAGATCCTGCAGGTCTTTGGTGCCCCGG; |
L10338 |
McClatchey et al., 1993 |
|
708–743, CCTGGACGCCCGTGCAGTTCTCTTTGCTCTCAGAGG |
|||
|
β2 |
202–237, CTCCTCTGAGCAGTTGTTGCACTCCTGGTAAGTCCA; |
— |
T. Peakman, unpublished |
|
588–623, ACACATCGTACTTGCTGGGGTTCCCCGAGAACTCCA |
Northern blot hybridisation
Oligonucleotide probes from the coding region (described above) were end labelled by using [32P] γ-dATP (Amersham Life Science, Buckinghamshire, United Kingdom) and T4 polynucleotide kinase. Northern blot hybridisation experiments were performed on RNA extracted from stable HEK293 cell lines expressing the cloned α and β subunit cDNAs. These cell lines have been characterised electrophysiologically and were shown to express functional sodium channels (Xie et al., 1997; Burbidge et al., 1998; Dale et al., 1998; Powell et al., 1998; Clare et al., 1999). Confluent cells were harvested from a 175-ml flask, and RNA was extracted by using Trizol reagent (Sigma, St. Louis, MO) following the manufacturers' protocol. The quality of RNA obtained was assessed by absorption at 260/280nm, agarose gel electrophoresis, and hybridisation with a control β-actin cDNA probe (Clontech Laboratories Inc., Palo Alto, CA). Approximately 10 μg of each RNA was electrophoresed on a denaturing agarose gel [1.4% agarose (weight/volume), 1 × 3-[N-Morpholino] propane-sulfonic acid (MOPS), 1% (volume/volume; v/v) formamide] along with 5 μg of RNA markers (Gibco BRL, Life Technologies, Paisley, Scotland) for molecular weight determination. The RNA subsequently was transferred onto nylon membrane (Hybond-N) and cross-linked by ultraviolet light irradiation. Probe hybridisation was carried out overnight at 37°C in a hybridisation mixture containing 1 × Denhardt's solution (1% bovine serum albumin, 1% Ficoll, and 1% polyvinylpyrrolidine), 50% (v/v) deionised formamide, 4 × standard saline citrate (SSC,) 250 μg/ml denatured salmon testes DNA, 100 mg/ml dextran sulphate, and 3% mercaptoethanol with a final probe concentration of 10 pmol/ml. The filters subsequently were washed for 40 minutes at room temperature in a solution containing 2 × SSC (v/v) and 0.05% SDS (v/v) and for 40 minutes at 55°C in a solution containing 0.1 × SSC (v/v) and 0.1% SDS (v/v). Autoradiography was performed at −80°C for 1–5 days.
Probes for human multiple tissue Northern (MTN) blots were derived from 5′ and 3′ UTRs of rat and human αI, αII, and αIII genes and coding regions of αVI and the β subunit genes with PCR by using subtype-specific primers designed for both rat and human cDNA sequences (Table 3). The DNA was amplified in 1 × PCR buffer containing 100 mM Tris/HCl, 15 mM MgCl2, and 500 mM KCl, pH 8.3, with a final concentration of 10 mM dNTP mix, 1 mmol each of 5′ and 3′ primers, and 1 U Taq polymerase (Boehringer Mannheim, Mannheim, Germany). A typical amplification cycle was 25–30 cycles of denaturation at 94°C for 2 minutes followed by 92°C for 30 seconds, annealing at 55–60°C (depending on primer melting temperature) for 1 minute and extension at 72°C for 1 minute, and a final extension at 72°C for 10 minutes. Coding region probes were amplified from vectors containing cloned sodium channels. UTR probes were amplified with RT-PCR by using human cerebellum samples. In all cases, PCR products were subcloned into the PCR II-Topo cloning vector (Invitrogen, La Jolla, CA) and were subjected to double-stranded DNA sequencing to confirm sequence. All probe sequences were subjected to homology searches of the GenBank database (October, 1999) and were found to share little homology to closely related channels. MTN blots were obtained (Clontech Laboratories Inc.) and the procedure was performed as described in the manufacturer's protocol. MTN blots were prehybridised in “Express Hyb” hybridisation solution (Clontech Laboratories Inc.) at 68°C for 1 hour in a rotating incubator. Amplified probes were purified by using agarose gel electrophoresis and were labelled radioactively by extension of random primers using the Rediprime DNA labelling system (Amersham Life Science) following the manufacturer's protocol. Purified, radiolabelled probe was mixed with 5 ml of Express Hyb buffer, and hybridisation was performed at 68°C overnight in a rotating incubator. Blots initially were washed in wash solution 1 [2 × SSC (v/v), 0.05% SDS (v/v)] four times for 10 minutes each with constant agitation at room temperature. Subsequently, blots were washed in prewarmed wash solution 2 [0.1 × SSC (v/v), 0.1% SDS (v/v)] for twice for 20 minutes each at 55°C in a rotating incubator. MTN blots were exposed to Kodak XR film (Eastman-Kodak, Rochester, NY) for 1–4 days.
|
Subtype |
Sequence and nucleotide position |
GenBank accession no. |
Reference |
|---|---|---|---|
|
Type I |
Forward (6,757–6,774), 5′-TAAGGACCTCTATAACAG-3′; reverse (7,798–7,814), 5′-TGTGATATCAACCTGAAG-3′ |
M22253 |
A. Powell, unpublished |
|
Noda et al., 1986a |
|||
|
Type II |
Forward (6,094–6,113), 5′-GGGAAAGATATCAGGGAAAG-3′; reverse (6,309–6,328), 5′-CCCATCGATACTATTTCTCC-3′ |
M94055 |
Ahmed et al., 1992 |
|
Type III |
Forward (−183–−164), 5′-AAGGATTCATAGTAGAGTGG-3′; reverse (−39 to −20), 5′-AATTACGTGTAGCTTCTTGC-3′ |
— |
Y. Chen, unpublished |
|
Type VI |
Forward (1,825–1,845), 5′-AGCGCCGCAGCAGCTACAGTG-3′; reverse (2,280–2,299), 5′-ATGCAGATGGTGATGGCTAA-3′ |
— |
S. Burbidge, unpublished |
|
β1 |
Forward (179–199), 5′-ACCGAGGCCGTGTATGGGATG-3′; reverse (478–499), 5′-GTGCTCGTAGTTTTCGAAGAAG-3′ |
L10338 |
McClatchey et al., 1993 |
|
β2 |
Forward (61–81), 5′-TTCTCTTTGGTGCCACCAGGA-3′; reverse (371–394), 5′-GGTCAGGGGGGTTCATGATGT-3′ |
— |
T. Peakman, unpublished |
In situ hybridisation
For the in situ hybridisation study, oligonucleotide probes were 3′-end labelled with [35S] dATPαS (NEN-Dupont, Wilmington, DE) by using terminal deoxynucleotidyl transferase (Pharmacia, Uppsala, Sweden) to >5 times 105 dpm/μg. Unincorporated nucleotides were removed by purifying the probe through a Sephadex G-50 column (Pharmacia) equilibrated in 10 mM Tris, pH 7.8, and 0.1 mM ethylenediamine tetraacetic acid. Cryostat sections (15 μm) of fresh-frozen tissues were fixed in 4% neutral phosphate-buffered paraformaldehyde, pH 7.4, for 15 minutes, rinsed in 0.1 M phosphate-buffered saline, and dehydrated by immersion in a graded ethanol series. Each section was hybridised overnight at 37°C by overlaying with 250 μl of hybridisation mixture (as described for Northern blot analysis) with a final probe concentration of 5 fmol/ml. A competition control was also performed with each probe by adding 500 fmol/ml of unlabelled probe to the hybridisation mixture. After hybridisation, sections were rinsed briefly and then washed three times for 30 minutes each in 1 × SSC, 0.0001% mercaptoethanol incubated at 55°C, and a final wash was carried out for 1 hour at room temperature. Sections were then rinsed briefly in distilled H2O followed by a solution containing 70% ethanol (v/v) and 100 mM ammonium acetate (v/v). The slides were dried at room temperature for 30 minutes. Initial autoradiography was carried out by exposing Kodak Bio-Max MR film to the slides for 8 days. Film images were quantified by using the Seescan system (Seescan Satellite, Cambridge, United Kingdom). Illuminated autoradiography images were analysed by using a video camera (XC-77CE; Sony, Tokyo, Japan). Boxes were placed on images defining regions of interest, and the optical densities were measured. Optical density units were converted to units of μCi of 35S ATP per gram of tissue by interpolation against a standard curve constructed from optical densities obtained from coexposed 14C plastic standards. All optical densities measured fell with in the linear portion of this standard curve. Subsequently, slides were emulsion dipped at 37°C in Ilford K5 emulsion and exposed for 4 weeks at 4°C. After exposure, sections were processed in Ilford phenisol developer for 5 minutes, washed in 2% chrome alum and 2% sodium metabisulphite for 5 minutes, fixed in 30% sodium thiosulphate for 10 minutes, and rinsed with distilled H2O. Dried sections were counterstained with methylene blue, dehydrated in a graded ethanol series, cleared with xylene, coverslipped with DePex (BDH), and visualised by using light microscopy. Light microscope images were scanned and saved in TIFF format and adjusted for contrast by using Adobe Photoshop software (Adobe Systems, Mountain View, CA).
RESULTS
The expression of sodium channel α- and β-subunit mRNAs was studied by using Northern blot analysis and in situ hybridisation experiments in the human hippocampal formation, middle frontal gyrus, frontal lobe, and cerebellum. For the in situ hybridisation study, α subunit-specific probes were based on sequences derived from coding and noncoding regions of the human genes. Probes for the β subunits were based on sequences derived from coding regions. In all cases, noncoding probes were designed that shared no sequence similarities. Coding region probes were designed to contain minimal sequence similarity and were shown to be highly specific by Northern blot analysis using cell lines that stably expressed each of the cloned subtypes (see below). This specificity was reflected by in situ hybridisation experiments with individual oligonucleotides that gave qualitatively similar results for each subtype (results not shown). The results indicate that each sodium channel mRNA exhibits a distinct spatial distribution in the human brain regions studied. To compare mRNA expression levels, semiquantitative analyses of autoradiographic signals were performed (for summary, see Table 4). In each of the eight cases studied, mRNA hybridisation patterns and intensities were consistent, indicating no significant intercase variation or noticeable age-related differences in mRNA expression. In addition, to define nonspecific hybridisation, human cerebellum sections were incubated with a hybridisation mixture containing a 100-fold excess of unlabelled probe. With each subtype-specific probe, specific mRNA hybridisation was abolished in these experiments (Fig. 4B).

Expression of α- and β-subunit RNA in stably transfected HEK293 cells and selected human brain regions. For cell line Northern blot analysis, approximately 10 μg of each RNA (estimated from optical density, 260 nm) were loaded per lane of a denaturing formaldehyde-agarose gel. A,B: The blots were hybridised with coding region oligonucleotide probes to types I, II, III, VI, β1, and β2 RNA (A) and cDNA probe to β-actin (B). Single bands corresponding to specific hybridisation of probe to intended target RNA was observed with the α and β probes. For subtypes I, II, III, and VI the bands were of the expected size of ∼7.5 Kb, as shown by the molecular weight markers (indicated by lines). The β-subunit bands had a molecular weight of ∼2 Kb. C: Multiple tissue Northern blots containing 2 μg of total RNA isolated from cerebellum (lane 1), frontal lobe (lane 2), hippocampus (lane 3), whole brain (lane 4), and liver (lane 5) were hybridised with radiolabelled DNA probes to α- and β-subunit transcripts (C). Bands of ∼9 kb (type I), ∼9.5 Kb (types II and III), ∼10.5 (type VI), ∼2 Kb (β1), and ∼4 Kb (β2) were seen after hybridisation with radiolabelled cDNA probes (indicated by lines). D: Single bands of ∼2 Kb were observed in all lanes after hybridisation with the β-actin probe.
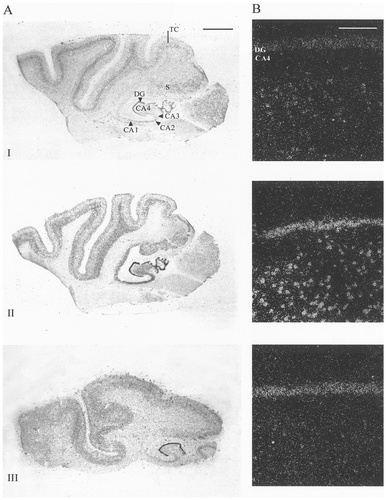
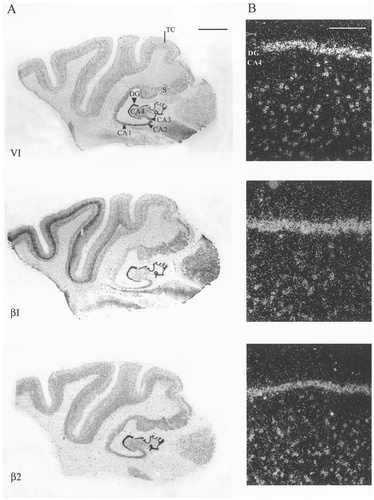
A,B: Autoradiographic (A) and microscopic (B) images of sodium channel type I, II, III, VI, β1, and β2 in human hippocampal formation. In all cases, robust mRNA expression was seen in the granule cells of the dentate gyrus (DG). Differential expression was seen in all CA regions of Ammon's horn (CA1–CA4). Type I, III, and β1 mRNA showed varying levels of expression in the pyramidal cells of the Ammon's horn: The highest levels were observed in CA4 and CA3. Type II, VI, and β2 mRNA expression was uniformly strong in all CA regions. Darkfield microscopy images (B) indicate varying expression levels at the dentate gyrus/CA4 boundary. Differential mRNA expression also was observed in the subiculum (S) and the temporal cortex (TC) similar to the expression patterns observed in the middle frontal gyrus (see Fig. 3). Scale bars = 5 mm in A; 200 μm in B.
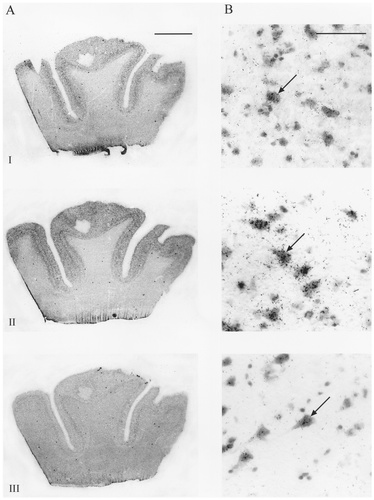
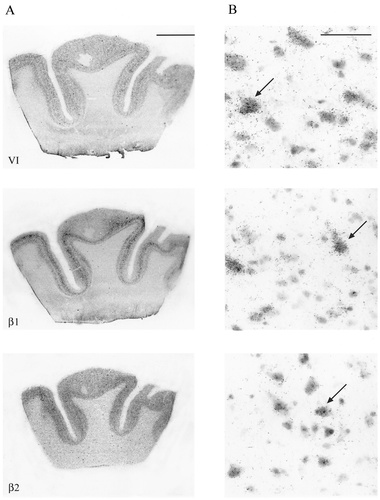
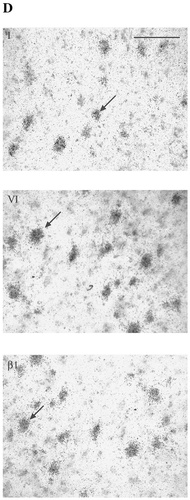
A,B: Autoradiographic (A) and microscopic (B) images of sodium channel type I, II, III, VI, β1, and β2 distribution in the human middle frontal gyrus. Specific expression of sodium channel mRNA was seen in the different cortical layers (layers I–VI), with expression predominating in the pyramidal cell layers (arrows in B indicate representative cells). Sodium channel types I and III showed moderate and weak expression, respectively, in layers V and VI, with lower expression evident in the outer laminae. Strong expression patterns were exhibited by type II and VI mRNA uniformly throughout all cortical regions. Strong β1 mRNA expression and moderate β2 mRNA expression were seen in cortical layers III, V, and VI. Scale bars = 5 mm in A; 100 μm in B.
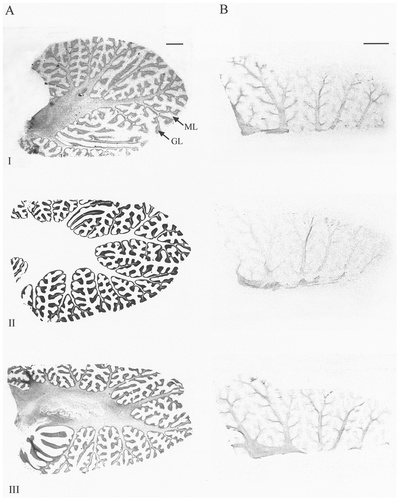
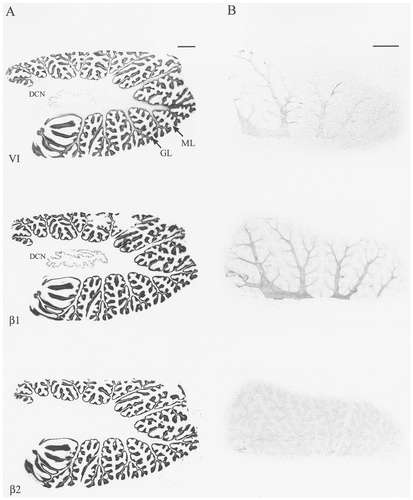
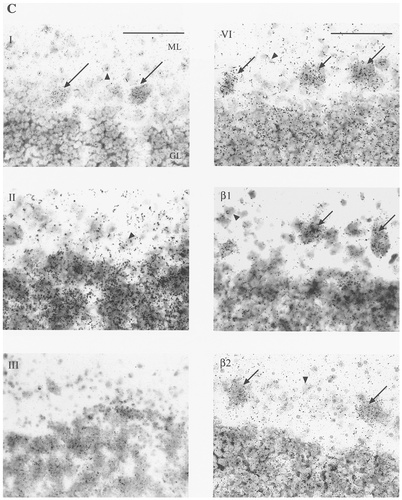
A–D: Autoradiographic (A,B) and microscopic (C,D) images of sodium channel type I, II, III, VI, β1, and β2 mRNA distribution in human cerebellum. Subtypes showed varying levels of mRNA expression in the granule cell layer (GL), with type II, VI, and β1 mRNA showing the strongest signals (A). For each probe, this signal was abolished by incubation with a 100-fold excess of unlabelled oligonucleotide (B). Types I and VI and both β subunits showed varying levels of mRNA expression in Purkinje cells (C, arrows ). Cells of the deep cerebellar nucleus (DCN) expressed different levels of types I, VI, and β1 mRNA (A,D). Types I, II, and VI and the β subunits exhibited scattered mRNA expression in cells of the molecular layer (ML), assumed to be basket or stellate cells (C, arrowhead). Scale bars = 5 mm in A,B; 100 μm in C,D.
| Brain region | Subtype | |||||
|---|---|---|---|---|---|---|
| I | II | III | VI | β1 | β2 | |
| Parahippocampal gyrus | ||||||
| CA4 | + | ++ | ± | ++ | ++ | ++ |
| CA3 | + | +++ | + | +++ | +++ | ++ |
| CA2 | + | +++ | ± | +++ | ++ | ++ |
| CA1 | + | ++ | ± | ++ | ++ | ++ |
| Dentate gyrus | ++ | +++ | ++ | +++ | +++ | +++ |
| Subiculum | + | +++ | + | +++ | +++ | ++ |
| Cortex | ||||||
| Layers II/III | + | +++ | + | +++ | ++ | ++ |
| Layers V/VI | ++ | +++ | + | +++ | +++ | ++ |
| Cerebellum | ||||||
| Granular layer | ++ | ++++ | ++ | +++ | ++++ | +++ |
| Purkinje cells | ++ | − | − | +++ | +++ | ++ |
| Deep cerebellar nuclei | ++ | − | − | ++ | +++ | − |
| Molecular layer | + | + | − | ++ | ++ | + |
- 1 ++++, Very strong expression (>0.4 μCi 35S-ATP.g−1 tissue); +++, strong expression (0.2–0.4 μCi 35S-ATP.g−1 tissue); ++, moderate expression (0.15–0.2 μCi 35S-ATP.g−1 tissue); +, weak expression (0.5–0.15 μCi 35S-ATP.g−1 tissue); ±, very weak/scattered expression (<0.5 μCi 35S-ATP.g−1 tissue); −, no expression. Signals were based on average, relative optical density of film autoradiograms. For cells of the molecular layer and Purkinje cells, expression levels were compared by density of silver grains (see Fig. 4.C).
Northern blot analysis
Northern blot analysis was performed to confirm the subtype specificity of the oligonucleotide probes used in this study (Fig. 1A,B). Radiolabelled probes were hybridised to blots containing RNA isolated from different HEK293 cell lines that stably expressed each of the individual cloned human α- and β-subunit cDNAs. Only the probes derived from the coding region of the genes were tested, because 3′ UTR-derived probes shared no sequence homology. The blots also were probed with a β-actin probe as an RNA loading and quality control, which produced a band of ∼2Kb (Fig. 1B). In each case, subtype probe hybridisation was specific with no cross hybridisation to other subtype RNAs (Fig. 1A.). Radioactive bands of the expected sizes of ∼7.5 Kb for the α-subunit transcripts and 2 Kb for the β-subunit transcripts were observed.
First, the distribution of sodium channel α- and β-subunit mRNAs was investigated in MTN blot experiments by using cDNA probes generated with RT-PCR from human cerebellum RNA and vectors containing cloned channels. Figure 1C,D shows that intense bands were observed in human whole brain, cerebellum, frontal lobe, and hippocampus. For the α subunits, transcripts of between 9 kb and 10.5 kb were expressed most highly in the cerebellum and whole brain, with lower levels seen in the frontal lobe and hippocampus. The β1 and β2 transcripts of ∼2 kb and ∼4 kb, respectively, were observed again showing predominant expression levels in the cerebellum and whole brain. In all cases, no hybridisation was detected in the liver, which was used as a negative control.
Parahippocampal gyrus
The expression of sodium channel α- and β-subunit mRNA in the human hippocampus, subiculum, and entorhinal cortex is shown in Figure 2. Expression patterns in the entorhinal cortex were similar to those seen in the middle frontal gyrus (see below). In the hippocampal formation, all sodium channel mRNAs were expressed in the granule cells of the dentate gyrus and, to a lesser extent, in the pyramidal cells of the CA subfields of Ammon's horn. In general, hybridisation levels were highest in CA3, although this may have been due in part to the relatively high density of pyramidal cells in this region compared with CA1, CA2, and CA4. Subtype I and III mRNAs showed relatively weak expression in CA4 and CA3 and little or no expression in CA2 or CA1. A similar (although more robust) expression was exhibited by β1-subunit mRNA. Subtypes II and VI were expressed strongly and β2 was expressed moderately in all CA regions. Differential mRNA expression also was seen in the subiculum, with subtypes I and III showing low levels of transcript compared with the higher expression levels shown by subtypes II and VI and the β subunits.
Middle frontal gyrus
In the human middle frontal gyrus, individual sodium channel subtypes also showed a differential distribution (Fig. 3). Hybridisation was predominant in the large pyramidal neurons of cortical layers III, V, and VI, although expression also was observed in the smaller nonpyramidal interneurons of the outer layers. Sodium channel subtype I expression was predominantly in the large pyramidal cells of layers V/VI. Low-level positive signal also was observed in nonpyramidal cells of the outer cortical laminae. Subtypes II and VI showed a similar distribution, with strong expression in both outer layer nonpyramidal cells and pyramidal cells of layers III, V, and VI. Type III mRNA was found to be expressed at a low level uniformly throughout the middle frontal gyrus. Of the β subunits, β1 showed strong expression in the large pyramidal cells of layers III, V, and VI, whereas β2 showed a lower level of mRNA expression in those regions. For all subtypes, no mRNA expression was seen in the white matter.
Cerebellum
In human cerebellum, the expression of sodium channel subtypes was heterogeneous among the various neuronal populations (Fig. 4). With all probes, signal was predominant in the granule cell layer of the cerebellum. Subtype I was expressed moderately in the Purkinje cells and weakly in cells of the granular layer. Moderate signal also was noted in the cells of the deep cerebellar nuclei. Weak mRNA expression was discernible in scattered cells in the molecular layer, presumably in basket cells or stellate cells. Subtype II was found to be expressed very strongly in the granular layer but was not present in Purkinje cells. Hybridisation above background was apparent in cells in the molecular layer but not in the deep cerebellar nuclei with this probe. Sodium channel subtype III mRNA was expressed at a moderate level in the granular layer and was absent in Purkinje cells, cells of the molecular layer, and deep cerebellar nuclei. Subtype VI was found to be expressed strongly in all Purkinje cells as well as in cells of the granular layer, and it was expressed moderately in scattered cells of the molecular layer and in deep cerebellar nuclei. The β1 subunit exhibited an mRNA distribution pattern similar (albeit at a higher level) to that of the β2 subunit in the cerebellar cortex. Expression in the granular layer and in Purkinje cells was high in both cases. Robust expression of β1 also was apparent in the cells of the deep cerebellar nuclei. Scattered cells in the molecular layer also exhibited β-subunit mRNA expression.
DISCUSSION
In this study, we developed highly specific cDNA and oligonucleotide probes for the α and β subunits of human brain voltage-gated sodium channels. With these probes, we performed Northern blot analysis and in situ mRNA hybridisation mapping of normal human hippocampal formation, middle frontal gyrus, frontal lobe, and cerebellum. This provides the first detailed study of voltage-gated sodium channel α- and β-subunit mRNA distribution in the human CNS. Our results demonstrate that sodium channel α- and β-subunit mRNAs exhibit differential expression, suggesting that the subtypes have distinct physiologic roles and contribute to the functional heterogeneity of neurons within the CNS. These results also allow a direct comparison of sodium channel expression between rat and human, offering an insight into the conservation of function between species.
Because the brain sodium channel α and β subunits share a high level of nucleotide sequence identity, we stringently tested the specificity of the probes used in this study. Northern blot experiments were performed by using mRNA from a panel of stable cell lines expressing each of the cloned human sodium channel cDNAs. Under hybridisation conditions identical to those used in the in situ experiments, no cross hybridisation between subtypes occurred. Furthermore, for the in situ experiments, we used a second probe for each α subunit that was derived from the 3′ UTR and that shared no sequence identity (J.J.C., unpublished observation). When they were used individually, oligonucleotides designed for the same subtype showed identical distribution. In addition, significant signal displacement occurred when an excess of unlabelled probe was added to the hybridisation mixture (Fig. 4B). To minimise mRNA degradation, we obtained tissue with minimal postmortem delay from eight patients who had died from nonneurologic causes and without prolonged hypoxia (Table 1). Postmortem delay and premortem agonal state are believed to have adverse effects on mRNA stability in tissue (Barton et al., 1993). However, it is unlikely mRNA degradation significantly affected the tissue used in our studies, because differences in intercase hybridisation levels were negligible (data not shown), and the clarity of differential signal observed was excellent.
MTN blots revealed a widespread distribution of α and β subunits in the cerebellum, frontal lobe, whole brain, and hippocampus, in good agreement with previous data obtained for rat α and β subunits (Beckh et al., 1989; Isom et al., 1992, 1995b; Schaller et al., 1995; Levy-Mozziconacci et al., 1998). Broad similarities to expression patterns in rat also were revealed by the in situ hybridisation experiments. In the hippocampal formation, sodium channel mRNA expression was confined to granule cells of the dentate gyrus and pyramidal neurons of the CA regions. Here, subtypes II and VI and the β subunits exhibited the highest levels of expression. The lack of hybridisation in the molecular layers of the dentate gyrus and the hippocampus indicates that transcription occurred in the cell bodies, as expected. Sodium channel mRNA expression in both the temporal and middle frontal cortices varied between cortical layers. The strongest levels of expression were exhibited by subtypes II and VI and the β-subunit mRNAs in the internal pyramidal layer V and in multiform layer VI, with lesser expression in the smaller, nonpyramidal cells of the outer layers. Expression of subtype I and III mRNAs also was stronger in these layers than in the outer laminae. Sodium channel mRNA in the medium and large pyramidal neurons of layer V may reflect their roles in action potential initiation and propagation in the output projection fibres of these cells.
The cerebellar cortex contains three defined layers, the molecular, Purkinje, and granular cell layers, which are characterised by the types of neurons they contain. Within a network of astroglia, the molecular layer is comprised predominantly of parallel axonal fibres of the granular cells and extensive dendritic trees of the Purkinje cells. It also contains stellate and basket cells, which function as interneurons. In all cases, varying levels of sodium channel mRNA expression was seen in the densely packed, small, excitatory neurons of the granular layer. Expression also was apparent in scattered cells of the molecular layer for both α and β subunits. Sodium channel expression in Purkinje cells was exhibited by types I and VI and by the β subunits. In rodent, conflicting reports have suggested that type II mRNA is present (Black et al., 1994; Felts et al., 1997), is absent (Vega Saenz De Miera et al., 1997), or is present at very low levels (Furuyama et al., 1993) in Purkinje cells. These discrepancies may be due in part to the use of two different hybridisation techniques. Black et al. (1994) and Felts et al. (1997) used digoxigenin-labelled ribonucleotide probes, whereas Furuyama et al. (1993) and Vega Saenz De Miera et al. (1997) used radiolabelled oligonucleotide probes. In addition, in the latter study, the absence of type II mRNA in guinea pig Purkinje cells was confirmed by single-cell RT-PCR analysis. Our data are in agreement with these findings, in that type II mRNA is not expressed in these cells in humans. Purkinje cells are the only output neurons of the cerebellar cortex: They form inhibitory synapses with the cells of the deep cerebellar nuclei. Sodium channel expression in these cells matches that found in the Purkinje cells. One interesting exception is β2-subunit mRNA, which seems to be absent in the cells of the deep cerebellar nuclei. This differs from experiments in rat, in which β2 is expressed in all layers of the cerebellum (Gastaldi et al., 1998; Levy-Mozziconacci et al., 1998). This may reflect the variable functional requirements of these cells in rat and human. A number of reports also have revealed the presence of sodium channel mRNAs in rat brain astrocytes (for reviews, see Black and Waxman, 1996; Sontheimer et al., 1996). Further studies are needed to determine whether similar expression occurs in human glial cells, although sodium currents have been recorded from acutely isolated astrocytes from human cortex and hippocampus and in glial cells from human hippocampal tissue slices (Sontheimer and Waxman, 1993; Bordey and Sontheimer, 1998).
Our experiments have highlighted the possible differential expression of type III compared with that seen in the rat CNS. In rat, the type III channel is regarded mainly as an embryonic channel, because it has very limited distribution in the adult brain (Beckh et al., 1989; Brysch et al., 1991; Felts et al., 1997). Our in situ hybridisation data suggest that, in the human adult brain, type III mRNA is expressed at detectable levels throughout two of the three regions examined (cerebral cortex and parahippocampal gyrus) and also is expressed within areas of the third region examined (cerebellum). Expression was relatively high in the dentate gyrus and was comparable to levels of type I in other regions of the hippocampus, in the granular layer of the cerebellum, and in the cortex. This finding is supported by Northern blot analysis, in which intense bands were observed in these regions as well as in the whole brain. It is possible that this apparent increase in type III expression is a factor of ageing in the human brain. However, included in our samples was tissue from a patient age 21 years (Table 1) that showed hybridisation signal intensities similar to those seen in tissue from older patients. Together, these results imply that the type III channel may play a more important role in the adult human brain than has been suggested by rat studies.
The data presented here indicate that the distribution of human brain sodium channels is broadly similar to that seen in rat brain. This suggests that there may be overall conservation of sodium channel function between species. However, additional studies are required to determine whether human channels share similar biophysical or pharmacologic properties with their rat counterparts and whether they also have a characteristic subcellular distribution. It is likely that a variety of pretranscriptional, posttranscriptional, and posttranslational mechanisms may combine to alter channel distribution and function further. For example, transcription of rat type II is known to be regulated by different factors, including nerve growth factor (Mandel et al., 1988; Zur et al., 1995) and cyclic AMP (cAMP; D'Arcangelo et al., 1993; Giraud et al., 1998). In addition, expression patterns are modified by different pathologic conditions in rat (Willow et al., 1986; Bartolomei et al., 1997; Gastaldi et al., 1997, 1998; ) and human (Lombardo et al., 1996). Studies in rat and human also indicate that channel diversity is modified extensively by mRNA splicing (Auld et al., 1988; Sarao et al., 1991; Schaller et al., 1992; Gustafson et al., 1993; Plummer et al., 1997; Dietrich et al., 1998; Lu and Brown, 1998; Oh and Waxman, 1998). In vitro studies indicate that posttranslational modifications of sodium channel proteins may include phosphorylation by cAMP-dependent protein kinase A and protein kinase C (Numann et al., 1991; Li et al., 1992) and interaction with Gβγ subunits (Ma et al., 1997). Further studies of the regulation and properties of the human sodium channel subtypes are required to understand their specific physiologic roles both in normal conditions and in different disease states. Our study provides the first detailed comparative study of sodium channel expression in the human CNS, and it should provide a basis for exploring changes in the patterns of expression that may be associated with human neurologic diseases.
Acknowledgements
This work was supported by a BBSRC/GlaxoWellcome studentship (awarded to WW). The authors thank J. Bullock for the preparation of tissue sections used in this study.


