Combined holographic subsurface radar and infrared thermography for diagnosis of the conditions of historical structures and artworks
ABSTRACT
This paper describes a new application of holographic radar for non-destructive testing applied to cultural heritage items. A holographic radar, called RASCAN, operates in continuous wave multi-frequency mode at 4 GHz range and produces images with high in-plane resolution (about 2 cm). Marble items and other stones have been investigated to validate the method to search for subtle cracks, moisture or to unveil details of structures at shallow depth (up to 2 wavelengths). Other important materials are aged wood items that are investigated for tunnels made by insects. Then the holographic radar imaging has been experimentally compared with infrared thermography to understand the advantages and disadvantages of these methods and to derive indications for solving the problem common in all geophysics of inherent non-uniqueness.
INTRODUCTION
A family of holographic radars, named Rascan, has been produced following more than ten years of research and development. Rascan radars are a completely unique and innovative type of subsurface radar that operates with continuous wave, discrete frequencies around 2 GHz, 4 GHz or 7 GHz depending upon the model (Vasiliev 1999; Ivashov 2000, 2008; Razevig 2008; Capineri et al. 2009). Images are recorded by sweeping the cylindrical horn antenna across an investigated surface, with the transmitter producing five discrete frequencies, which are recorded at two receivers with parallel and cross-polarization relative to the transmitter. The reflected signals are mixed with an internal reference signal to create a holographic image of the subsurface, with plan-view resolution of one half wavelength or better. The use of five frequencies and two polarizations ensures detection of targets with arbitrary orientation at depths up to about 2 wavelengths. Rascan radars have previously shown great promise for shallow, very high resolution scanning of stone, wood, mortar, plaster and other dielectric materials that are important in art and architectural preservation. A particular sensitivity to moisture, even at very low concentrations, has been demonstrated and the knowledge of moisture presence is of critical importance in many antiquities. In addition, Rascan produces plan-view subsurface images in real-time with simple post-processing. Subsurface targets are shown with their true plan-view shapes in the spatial domain; this is a substantial difference with respect to the time-of-flight hyperbolic reflection patterns typical of impulse radar images or synthetic spectrum produced by stepped frequency radar. These characteristics make Rascan a tool readily applied and interpreted by users with no special geophysical training. However, as with all geophysics, there is inherent non-uniqueness.
The actual source or composition of subsurface targets seen in the images cannot be known from Rascan alone. In some cases, the targets can be identified through historical research of intrusive testing. But, particularly for undocumented high-value antiquities, target identification purely by non-destructive means is desired. We have tested the side-by-side use of Rascan radar and infrared thermography as a means of alleviating the non-uniqueness problem. Spatially coincident Rascan and infrared thermography images have been recorded for laboratory mock-ups of stone, wood and plaster structures and artworks containing subsurface cracks, voids, moisture, insect damage, supports, repairs and the like. In addition, some initial side-by-side testing has been performed on actual historic structures and artworks. Since both Rascan and infrared thermography produce real-time, plan-view images, they are easily overlain and compared and both can be interpreted visually, especially by persons familiar with the particular item under investigation. Because they are sensitive to completely independent physical properties (dielectric constant for Rascan and thermal conductivity, heat capacity and emissivity for infrared thermography), this comparison can allow confident identification of conditions of target materials and/or subsurface defects. Moreover, our testing confirms that both are exquisitely sensitive to hidden moisture. Finally, instrumentation for both Rascan and infrared thermography is commercially available, relatively low cost and easy to use and interpret – making this combination of methods a potentially powerful tool for workers engaged in the preservation and restoration of artworks and architecture.
HOLOGRAPHIC RADAR IMAGING WITH RASCAN INSTRUMENT
Traditionally, the type of the subsurface radar used in practice is impulse radar (Finkelstein 1977, Finkelstein, Kutev and Zolotarev 1986). In general, this repeatedly transmits one period of a sine wave signal and records the amplitude and time of flight of reflected impulses (Fig. 1, left); the sampling of the time domain signal must accomplish the Nyquist criterion. Almost all subsurface radars now in commercial production are of this type. The main advantages of impulse radar are the high effective penetration depth into the surveyed medium due to the application of time-varying gain, which amplifies the weaker later/deeper reflected arrivals and the ability to make direct measurement of reflector depths from the reflected signal time-of-flight (Daniels 1996). On the other hand, its main disadvantage is the ultra-wide spectrum of its signal. This can lead to interference with other microwaves devices (e.g., global positioning and navigation systems, communications, electronic switches, etc.) and conflict with existing norms – in particular, the USA Federal Communication Commission (FCC) regulations (FCC 2002).
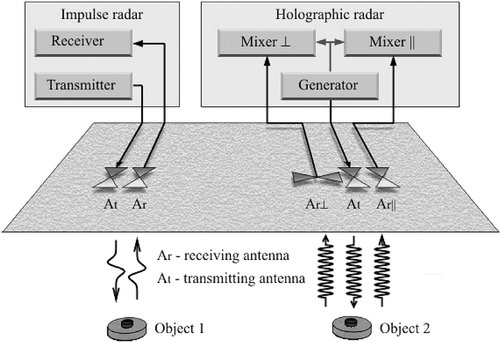
Comparison of impulse and holographic radar schematics.
While the Rascan radar system is based on classical principles of holographic radar, it is completely different from traditional impulse radars or stepped frequency radar. The signal is emitted into the subsurface, which is reflected by heterogeneities with dielectric constant or conductivity different from the host medium. The reflected signal is received by the radar antenna, amplified, processed and displayed on a computer screen. Rascan radars consist of a transmitting antenna and two receivers, parallel and perpendicular to the transmitter polarization (Fig. 1, right).
During scanning the transmitter emits a continuous wave at five discrete frequencies. The receivers record the reflections of these signals. The reflected signals are mixed with an internally generated reference signal that has not been transmitted to the medium. Both the reflected signal and reference signal have the same frequency but the reflected signal has a phase shift that depends on the distance (depth) to the reflector. Thus, the reflected signal and reference signal interfere constructively or destructively depending on the reflector or target depth; thus, the need for five simultaneous frequencies that ensure that a target will be visible on at least one of the frequencies regardless of depth. These five frequencies are automatically switched during scanning and their values are very close (within 10%) to the nominal frequency. At present at the end of each scan 10 images are obtained (five frequencies, two antenna polarizations). Therefore, the units for RASCAN holographic images are actually a digitized amplitude of the interference signals. This signal has an amplitude variation due to the phase variation. This maximum variation of the amplitude is evaluated for each image and the amplitude range values are represented in grey scale. The 256 grey scale levels are chosen to cover the maximum amplitude variation. We observe that images at different frequencies can have different amplitude ranges and also different average values.
Currently, the only feature available in the Rascan software suite is a video animation that presents in sequence the series of the five images for a selected polarization. The results of a work in progress for the combination of these images in a single colour coded image have been presented at PIERS 2009, Moscow (Windsor et al. 2009).
The principle of image formation in Rascan holographic radar is the same as in the simplest optical hologram (Fig. 2). In Fig. 2, a flat monochromatic reference wave with a constant phase falls on a point object and is scattered by it. On a plane some distance behind the object, the reference and scattered waves create an interference pattern.
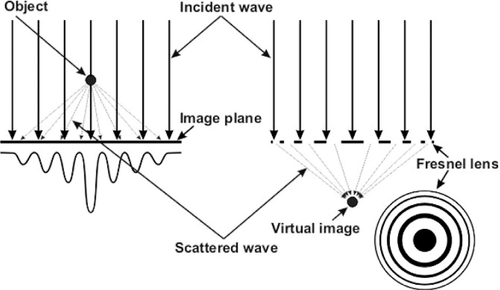
Recording a point source optical holographic interference pattern (left). Hologram reconstruction (right).
If this plane is oriented perpendicular to the reference wave, the interference pattern is a Fresnel lens. In optics, the Fresnel lens can be illuminated to project a virtual image (hologram) of the point object. In Rascan holographic radar, the reference wave is provided by direct coupling of the transmitter and receiver antennas. The scattered wave is recorded by the receiver and the interference pattern is produced in the mixer. There are two important differences between optical and microwave holography (Papi et al. 1971).
First, because the signals are not in the visible waveband, the Fresnel lens cannot be directly illuminated to project a hologram – although numerical reconstruction algorithms have been developed (Chapursky et al. 2002a). Second, an accurate true hologram cannot generally be reconstructed due to signal loss in most materials. That is, the full interference pattern is not recorded because the outer rings (for example for a point scatterer) are attenuated.
However, these are not deficiencies for radar holography. In fact, they are almost fortuitous since the loss of the outer rings produces an interference pattern that typically strongly resembles the actual target object or feature. Thus, when Rascan radars are employed for shallow targets, the natural loss of signal replaces the need for numerical image reconstruction and high-resolution planview subsurface images appear in real time as the scanning is performed. Figure 3 illustrates this phenomenon with Rascan images of a test bed containing 25 mm coins and thin wires. Note the partially preserved Fresnel rings around the coins that reveal that this image is actually an interference pattern.
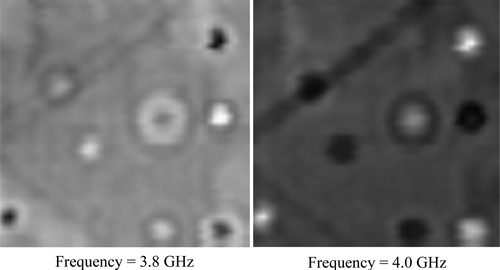
Images of hidden coins, wires and a void recorded by holographic radar Rascan-4/4000 at two operating frequencies. Images are 50 cm by 50 cm.
A comparison of parameters for impulse and Rascan holographic subsurface radars is presented in Table 1. Impulse radars have a continuous frequency wide spectrum, while Rascan holographic radar operates in CW at five different switched single frequencies. These five frequencies are selected in a narrow band that are 1.6–2.0 GHz, 3.6–4.0 GHz or 6.4–6.8 GHz for Rascan-4/2000, Rascan-4/4000 and Rascan-4/7000, respectively. The discrete frequencies make it easy to comply with electromagnetic spectrum regulations and norms. Impulse radars have better effective survey depth because of the possibility to apply time-varying gain. In contrast, Rascan radar can only apply a constant amplification for objects at all depths, with the effective survey depth completely dependent upon signal attenuation in the medium or scattering of signal by shallow heterogeneities that may shade deeper objects. Maximum imaging depth of holographic radars rarely exceeds two or three wavelengths. This is less than that of impulse radars with the same central frequency and with much higher peak power. However, as will be shown below, it is sufficient for many important practical problems. Rascan has a distinct advantage in lateral or plan-view resolution over impulse radars because of the specific design of the radar antenna that combines transmitter and receiver antennae into one apparatus with a small footprint. The signal sampling is controlled by a spatial encoder that samples the low frequency output (low-pass filtered at 1 kHz) of the interference signal obtained by multiplication of two monocromatic signals (reference and received signals). Therefore there is a simplification on the electronic design for the analogue to digital conversion (ADC): the low frequency output can be sampled with high resolution (12 or 16 bit ADC) without aliasing problems.
| Parameter | Impulse radar | Holographic radar | Remarks |
|---|---|---|---|
| Frequency spectrum | Continuous | Discrete | Impulses have necessarily continuous and ultra wideband spectrum |
| Effective penetration depth | Up to 10  |
 |
 |
| Plan-view resolution at shallow depths |  |
 |
 |
| Imaging over metal substrate | Not typically possible | Possible | Impulse radar swamped by reverberations |
| Determination of target depth | Directly from recorded signal | Not available | Recent experiments and calculations may lead to a solution. |
| Adaptation to norms and restrictions | Difficult | Easier | Frequency spectrum of holographic radar could be selected in advance. Impulse radar has a UWB spectrum that can not be changed or limited arbitrarily. |
| Radar cost, USD | 15000–15000 | ~5000 | Holographic radar has proprietary but essentially simple design |
Another important advantage of Rascan radar is the ability to image targets within dielectric materials that lie directly on a metal surface. Such materials cannot currently be inspected non-destructively with impulse radar due to the reverberation of pulses between the radar antenna and strongly reflective metal. Targets in these constructions are typically lost in the multiple reflections or ghosts of transmitted impulse signals (Chapursky et al. 2002b). The ability of holographic radar to image targets above metal surfaces could be very important (for example) in inspection of gilt artworks or structures. The images produced by RASCAN images have a rough analogy with traditional X-ray scanners that also do not measure depth of object but have enough information in many cases for diagnostics of diseases in medicine or reveal volumetric inhomogeneities in a soil or in a building material.
- High resolution in the plane-of-view; 1–2 cm at shallow depths (Bechtel et al. 2008);
- Ability to perform one-sided sounding, without requiring access to both sides of a medium as in X-ray devices;
- Ability to detect not only metal objects in a dielectric medium but also dielectric materials with dielectric constant or conductivity different from that of the medium;
- Ability to image targets in dielectric media above, or directly on, metal surfaces;
- Radiofrequency (RF) emission levels of 10 mW, or two orders of magnitude less than the emitting power of an ordinary mobile phone – providing complete operator safety.
RASCAN HOLOGRAPHIC IMAGING CASE HISTORY
Although the great strength of Rascan is the ability to image a wide variety of targets – both metallic and dielectric, this is sometimes a weakness when interpreting images of unknown subsurface features. In these cases, historical records may provide clues regarding the actual nature of a subsurface feature. An example is a marble medallion in the floor of the Temple of San Biagio (Fig. 4a) in Montepulciano, Italy. Rascan-4/4000 images of the marble medallion reveal a complex internal structure. The spatial correlation between an optical and the Rascan images is high, as an overlay of the two shows (Fig. 4b). With certainty, we can conclude that the targets implied by the contrast patterns in the radar image are dielectric materials and non-metallic. We have formulated hypotheses for interpretation of three contrast patterns enclosed by the grey boxes in Fig. 4(b). The vertical patterns (labelled 1 and 2) may represent the presence of bricks or wooden supports beneath the marble medallion. Furthermore, there is a smooth shift in the contrast patterns when the images obtained at five different single frequencies are viewed as an animation (RSLab2009. http://www.rslab.ru/?lang=english&dir=product&item=rascan4&point=result&entry=animation; accessed August, 2009), which is characteristic of Rascan images of a curved surface. According to the basic principle of imaging with microwave interferometry, this effect is explained as the phase variation with the reflector range (Ivashov et al. 2008). Thus, at the back of the medallion, there may be a curved vault over a void or opening. The third contrast pattern in the Rascan image (tilted grey box at the base of the image) corresponds to a subtle discoloured line on the marble in the optical image and could be explained by the presence of moisture along a fine crack.

a) San Biagio church in Montepulciano (Siena), Italy, b) scanning the medallion in San Biagio with Rascan-4/4000 (left). Optical photograph of the medallion (centre). Rascan image (40 cm by 60 cm) with features in grey boxes (right).
Detailed follow-up historical research indicates that the medallion was laid circa 1590 during the funeral ceremony of a Prelatio of the family Casata Cervini. The actual burial place of the Prelatio is not recorded. However, the hypothesized supports and arched vault suggest the possibility that beneath the medallion could be the remains or relics of the churchman.
In order to support the above interpretation of the Rascan images of the marble medallion based mainly on historical data, a simple laboratory model that mimics the proposed situation was constructed. A 2 cm stone slab was placed on two terracotta bricks (Fig. 5) and scanned with the same Rascan-4/4000 used at San Biagio. The two bricks show clearly behind the granite (Fig. 5), in a manner quite similar to the contrast pattern in the medallion image (Fig. 4b).
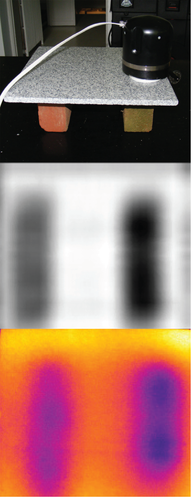
Laboratory model of the medallion supports (above). Rascan (top left) and infrared thermography (bottom left) images of bricks beneath a stone slab. The thermal anomaly is created by the bricks resting on a cool concrete slab. Images are 30 cm by 30 cm. Infrared thermography image spans 2.6° C.
In this case, the historical records helped to form a model that explains the Rascan images. However, without these records, our model is non-unique. That is, many other conceptual models could explain the Rascan images equally well. Another common means of reducing the non-uniqueness of geophysical interpretations is to apply two independent imaging techniques. The particular method selected for comparison with Rascan in this study is infrared thermographic imaging.
COMPARISON OF RASCAN HOLOGRAPHIC IMAGING AND INFRARED THERMOGRAPHY
Infrared thermography is a technology that produces plan-view images that can be readily compared with Rascan but the physics behind the imaging are completely different. Infrared thermography photographs the non-visible infrared emissions from an object, with the wavelength (equivalent to ‘colour’ in optical photography) of these emissions related directly to the surface temperature.
Thus, infrared thermography does not produce subsurface images in the same way as Rascan in that no signals are transmitted by the scanning. However, subsurface features with different temperature can produce surface anomalies that reveal their presence and shape.
Furthermore, subsurface materials with differing thermal conductivity or heat capacity may produce surficial thermal anomalies when an object or structure is subjected to a temperature change or gradient (Maldague 2001).
Although no actual infrared thermography images of the San Biagio medallion were collected, the laboratory model depicted in Fig. 5 was subjected to infrared thermography imaging. In order to introduce a thermal gradient of the type that might develop between the cold earth and a heated temple, the brick and stone model was set upon a cold concrete floor in a warm room. Within minutes, a surficial thermal anomaly was apparent, which was recorded with a FLIRi60 Thermacam (Fig. 5). The thermacam has a sensitivity of 0.1° C. The temperature difference depicted in Fig. 5 is less than 2° C but readily detectable on this image recorded at a distance of approximately one metre.
Due to differences in dielectric constant, the phase difference (and thus Rascan image contrast) will be different for different scanned media. This is illustrated in Fig. 6, which presents a Rascan-4/4000 image of three slabs of different types of stone; marble, granite and slate. These slabs were covered by a 0.3 cm plasterboard. The Rascan image shows that the hidden stones are of different type and also that the two on the left are quite homogeneous (consistent with metamorphic rock), while the one on the right (sedimentary) displays a wide linear anomaly – possibly a dipping joint or bedding plane. An infrared thermography image of the three is also shown in Fig. 6. The room temperature stones were placed on a cold concrete floor to produce a transient heat flow condition. A slight apparent temperature difference between the slate and the marble and granite is evident but may be related to differences in the surface emissivity of the stones and not to an actual temperature difference. That is, due to textural differences on the surfaces, there appear to be temperature variations. However, the stones vary in roughness and therefore possibly in efficiency of IR radiation. This phenomenon was confirmed in two ways: first, the test was repeated with small dots of whiteout correction fluid in the corner of each stone to produce a spot with known constant emissivity of approximately 96% across all three stone types. The spots showed indistinguishable true temperatures for the three stones. Second, when the test was repeated with a thin (0.3 cm) sheet of plasterboard over the stones, no thermal anomaly could be produced on the surface of the plaster. Thus, for detection of differing varieties of stone beneath a dielectric coating of some type (plaster, paint, etc.), Rascan is effective since the dielectric properties of different stones are distinct. However, infrared thermography is not effective for discriminating hidden stones since the thermal properties are similar. They can be discriminated only when exposed as in Fig. 6 (bottom) – a trivial task.
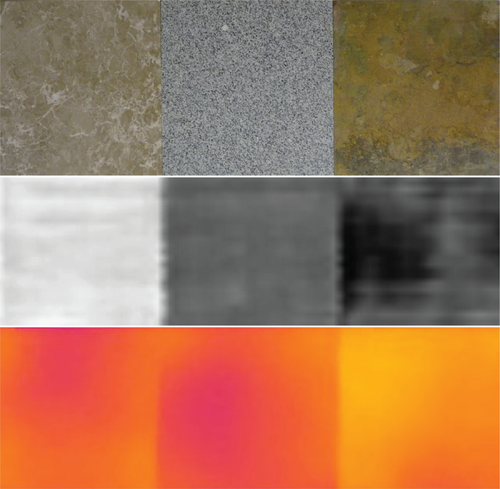
Three stone slabs; marble, granite and slate (top). Rasacan-4/4000 image of the three slabs hidden beneath plasterboard (middle). Infrared thermography image of slabs resting on a cool floor with no covering (bottom). Images are 90 cm by 30 cm. Infrared thermography image spans an apparent range of 1.4° C.
The large dielectric constant of water (80) and the thermal properties of water ensure that Rascan and infrared thermography images are particularly sensitive to moisture, as illustrated in Fig. 7.
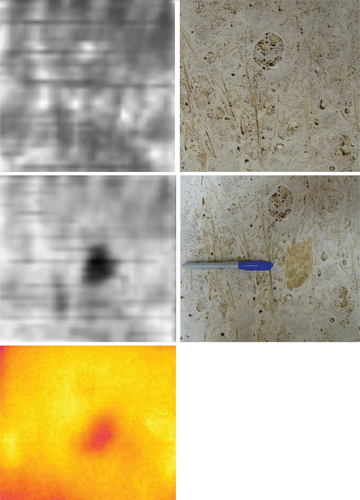
The polished (reverse) face of this 30 cm by 35 cm piece of travertine was scanned with Rascan-4/4000. The dry travertine is shown at top. In the middle, several drops of water create a barely visible damp spot (right of the pen cap) but a strong radar reflector (middle left right) and a distinct infrared thermography anomaly (lower left). The optical photos are mirrored to allow direct comparison with Rascan images. Infrared thermography image spans 2.3° C.
Here, a vesicular travertine was scanned on its polished face. On this face, the vesicles have been filled with some type of mortar; however, ubiquitous small voids remain beneath this surface. The heterogeneity of the travertine is apparent on all of the Rascan-4/4000 images in Fig. 7 but not particularly on the infrared thermography image. For the middle and lower left images of Fig. 7, one of the vesicles has been dampened with a few drops of water. In the Rascan image, it appears with strongly enhanced contrast due to the high dielectric constant of water. In the infrared thermography, the image taken with the warm stone resting on the cold floor also appears quite distinctly – even though it is on the backside of the stone and not on the surface that was infrared thermography imaged. The appearance of the water in the thermal image may be due to a combination of endothermic evaporation and the difference in heat capacity and conduction between dry stone and water (or wet stone). The effect of water is also apparent in Fig. 8, where a slab of marble contains tightly fitted hairline cracks with horizontal and vertical orientations forming a cross-like pattern. Rascan images of the dry cracks reveal the cracks only subtly and infrared thermography images show the dry cracks not at all.
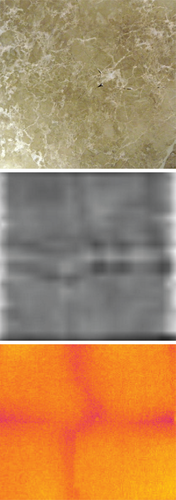
A 30 cm by 30 cm piece of marble contains two nearly invisible, hairline cracks; one vertical and one horizontal (see photo above). At top left is a Rascan-4/4000 image of the slab with the cracks barely dampened using a fine paint brush and bottom left shows an infrared thermography image of the same. In both cases, the moisture highlights the cracks. Infrared thermography image spans 1.8° C.
However, when the cracks were dampened by applying water with a fine paintbrush only to the cracks and allowing capillary action to pull it in (leaving the adjoining stone surface dry), they appear strongly in Rascan and quite dramatically in infrared thermography (see Fig. 8). These experiments indicate that for subsurface imaging of moisture, both Rascan and infrared thermography are extremely effective due to the anomalous dielectric and thermal properties of water relative to most construction and earth materials.
NON-DESTRUCTIVE TESTING OF WOODEN ELEMENTS WITH RASCAN AND INFRARED THERMOGRAPHY
Laboratory tests also suggest the utility of Rascan for inspecting wooden structures or artworks (e.g., icons). In particular, the ability of Rascan to detect features lying above or directly on metal surfaces could allow non-destructive testing of gilt objects if their backsides are accessible. Figure 9 shows optical, Rascan and infrared thermography images of three planks of dry pinewood from a Victorian-era building in Eastern Pennsylvania, USA. These planks were removed as part of a renovation project and display clear evidence of damage from the locally common Eastern Subterranean Termite Reticulitermes flavipes. This termite lives outdoors and underground during the day but follows tunnels into wooden structures at night to feed (Jacobs 2008). In some parts of the world, termite activity can be detected using infrared thermography because the termites live within the wood and the heat of their digestion of cellulose can create detectable thermal anomalies on wooden structure surfaces (James and Rice 2002). However, flavipes lives underground during the day and thus would be detectable in wooden structures only at night. In addition, old abandoned termite workings would present a non-destructive detection problem in any case since the creatures are gone for good. Thus, termite damage is commonly detected using intrusive methods like low-tech screwdriver or awl probing or more high-tech drilling resistance testing (Saporiti-Machado et al. 2003).

Three dry pine boards (c. 1890) with internal termite damage inferred from visible tunnels on edges. Rascan (centre) and infrared thermography (right) anomalies show remarkable coincidence and confirm that the damage visible on edges extends into planks. Planks and images are 25 cm wide, variable length. Infrared thermography images span 3.9° C
The three planks with visible termite tunnels on their edges were scanned with Rascan-4/4000 (Fig. 9, centre). The microwave images reveal anomalies that extend in towards the centres of the planks from areas where damage is visible at their edges.
Therefore, the Rascan images reveal hidden internal damage. The planks were placed on a cold concrete floor to stimulate transient heat flow and within minutes, thermal anomalies could be detected on the wood surface (Fig. 9, right) and eventually faded as thermal equilibrium was reached. The infrared thermography and Rascan anomalies are remarkably coincident given that the physics of the two imaging methods are different. However, we make the hypothesis that in both cases, the air-filled tunnels create the anomaly. For Rascan, the tunnel clusters diffract the incident microwaves, while for infrared thermography, convection in the tunnel transfers heat more rapidly than conduction in the wood.
Note also in the Rascan images of the planks (Fig. 9, centre), subtle parabolic reflection patterns seem to mimic the wood grain visible in the optical photographs (Fig. 9, left). This suggests high sensitivity of Rascan to possibly very small differences in dielectric property.
Although the laboratory tests on planks do reveal hidden damage, a more practical question for art and architecture preservation is whether Rascan or infrared thermography can detect wood damage when it is hidden beneath typical wall coverings, particularly in situations where the wall covering is too valuable to be destructively probed with an awl or drill (e.g., behind murals or frescos). Infrared thermography can be used to locate wood behind plaster walls, i.e., as a high-tech ‘studfinder’ (see Fig. 10). Microwave studfinders are also commercially available. However, the aim of our testing was not just to detect wooden supports but to determine whether damage to the wood could be evaluated.
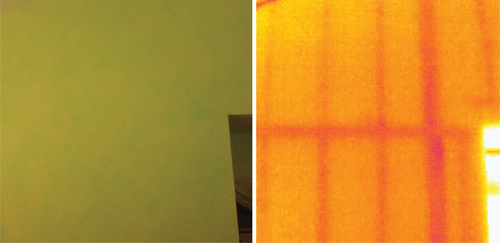
Interior plaster wall on a cold day (indoor-outdoor differential temperature = 15° C). Optical photograph on left, infrared thermography image on right. Infrared thermography image spans 1.4° C.
Figure 11 presents the results of scanning a piece of old wood with damage caused by fungal dry rot (Meruliporia incrassata) and wood boring insects (primarily powder post beetles of the family Lyctidae). The wood is a 15 cm thick rough-hewn plank of cherry from the Wheatland Estate – home of James Buchanan, 15th President of the USA. The damage is readily apparent when the plank is inspected visually. However, when the plank is covered by a 1 cm plaster board (which conceals the plank from visual inspection), a Rascan-4/4000 image scanned through the covering clearly delineates the damaged areas (Fig. 11, middle). This demonstrates the possibility for Rascan to detect wood damage hidden behind plaster, panelling, or other dielectric materials, or to detect non-visible interior features.
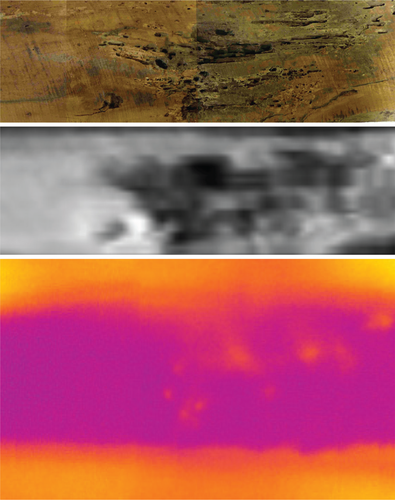
A 90 cm by 30 cm cherry plank (top) with dry rot and insect damage. Damaged zones are clearly evident on the microwave image scanned through concealing plasterboard (middle) and appear minimally on an infrared thermography image of the same (bottom). Infrared thermography image spans 3.1° C and extends laterally beyond the board to show the plasterboard.
The wood plank and plasterboard covering were placed on supports, with ceramic space heaters beneath. The thermal gradient across the wood and plasterboard created a transient heat flow condition under which thermal anomalies appeared on the surface of the plaster within several minutes (Fig. 11, bottom) and then faded as equilibrium was achieved (approximately 30 minutes). Note that the infrared thermography image extends beyond the width of the plank and shows clearly the extent of the hidden wooden plank. Within the plank footprint, there are some temperature variations indicating the most heavily damaged wood. Thus, in this test, while both Rascan and infrared thermography provide non-intrusive evidence of concealed wood damage, Rascan provides greater detail and resolution.
CONCLUSIONS
In summary, despite their different operating frequencies and instrumentation, Rascan holographic radar and infrared thermography imaging provide similar and complementary subsurface detection in a range of situations of importance to art and architectural preservation. Both methods are capable of detecting support elements beneath walls or floors. Due to differences in dielectric properties, Rascan can discriminate (but probably not identify) different types of stone, while the similarity in thermal properties of different stones makes them less distinguishable. Both methods are tremendously sensitive to hidden moisture.
This testing also suggests that water would make a good penetrant to illuminate tiny cracks in non-porous materials for either Rascan or infrared thermography imaging. Both methods can also detect hidden damage in wood but Rascan provides greater resolution and detail. In general, Rascan can be done at any time and under any conditions while infrared thermography requires application of a thermal gradient and images of subsurface features appear only temporarily due to the tendency for all thermal anomalies to eventually equilibrate with their surroundings.
ACKNOWLEDGEMENTS
This work was partially supported by NATO Project CBP.NR. NRCLG.982520 and RFBR (Russia) – EINSTEIN (Italy) grant # 09-07-92420.


