Shear-wave velocity profiling at sites with high stiffness contrasts: a comparison between invasive and non-invasive methods†
ABSTRACT
Three sites of the Italian Strong Motion Network (RAN) have been selected for detailed S-wave profiling, using both borehole and surface wave seismic methods. At these sites, the presence of stiffness contrasts within the soil column is found to influence the surface wave propagation profoundly. Advanced aspects in surface wave inversion such as resolution, accuracy and higher-mode interpretation must be properly taken into account to obtain realistic results from the surface wave dispersion observations. The possibility of mode misidentification and the loss of resolution with depth in surface wave interpretation are explored using synthetic modelling together with active and passive seismic data sets. With high stiffness contrasts, the possibility of mode jumps and higher mode dominance over specific frequency ranges is very probable. This is true also for normally dispersive sites, where the shear velocity increases with depth, though higher mode dominance is recognized as more common in the case of a shear-wave velocity inversion within the soil column and the sensitivity of the dispersion curves with respect to those layers beneath the low-velocity zone may be significantly reduced. Pitfalls in the inversion resulting from mode misidentification can be avoided by investigating the effective phase velocity distribution, using active data sets and full waveform seismic modelling. When an unambiguous modal identification is achieved, the results obtained by surface wave inversion are very satisfactorily consistent with borehole data.
INTRODUCTION
In many engineering and environmental problems, the shear-wave velocity of near surface materials is a key parameter, directly linked to the ground stiffness. More specifically, when estimating the effects of the shallow soils on seismic amplification (the so-called ‘site effects’), a weighted average of the shear-wave velocity of the upper 30 m of soil (VS30) is used in modern seismic codes (CEN 2003) as a soil classification parameter to choose the appropriate design spectra. Down and cross-hole seismic methods are routinely used in such cases. Their main drawback is high cost, due to drilling operations. Although borehole methods permit accurate and detailed reconstruction of the stiffness versus depth profile, the limited volume of soil investigated may be unsatisfactory when dealing with large areas. Hence, approaching the soil characterization problem using only invasive methods is not cost-effective in such cases.
For these reasons, much interest has focused in recent years on non-invasive methods for shear-wave soil characterization. Among them, seismic prospecting using surface waves (Song et al. 1989; Xia et al. 1999; Socco and Strobbia 2004; Park et al. 2007) has been a key subject of research. In surface wave inversion, the shear-wave soil profile is estimated by the inversion of the experimental dispersion (i.e., phase velocity variation with frequency) of surface waves (Xia et al. 1999). Dispersion can be extracted from recorded seismograms using integral transforms of various types (Nolet and Panza 1976; McMechan and Yedlin 1981; Xia et al. 2007).
Several authors have compared active and passive surface wave measurements with borehole results. Malagnini et al. (1997) compared the results of the inversion of explosion-induced Rayleigh waves with cross-hole shear-wave measurements in alluvial formations. Xia et al. (2002) examined the correspondence of active multichannel surface wave data with various borehole methods for soft soil sites. Stephenson et al. (2005) compared active and passive surface wave results with borehole logs, while Brown et al. (2002) tested two-station surface wave measurements against seismic downhole results up to 100 m depth. Boore (2008) studied extensively the properties of near-surface deposits in the Santa Clara Valley (CA), where the stratigraphic column has no dramatic stiffness contrasts and at all the sites investigated the shear velocity is increasing with depth with a moderate gradient.
On the other hand, comparison of borehole and surface wave data at sites with substantial stiffness changes at shallow depths is comparatively infrequent in the scientific literature. In Asten et al. (2005) a blind comparison was reported between passive surface wave recordings, seismic CPT and seismic refraction at a site with about 20 m of soft soil  , overlying firm glacial till
  . Liu et al. (2000) reported the case of alluvial sediments (about 100 m thick) overlying granite bedrock with shear-wave velocity slightly higher than 1500 m/s.
In all the above case studies, the observed dispersion is interpreted as that of the fundamental mode of Rayleigh waves. In the case of high stiffness contrasts (Park et al. 2005), fundamental mode dominance may be restricted to certain frequency ranges only and at normal sites with velocity increasing with depth the assumption that observed dispersion is dominated by the fundamental mode at all frequencies should be taken with caution. In contrast, in the case of velocity inversions, higher mode dominance is more frequently recognized (Forbriger 2003) and it is often difficult to accomplish satisfactory resolution for layers below the low velocity layer (Liang et al. 2008), a problem that is well-known in seismology (i.e., the ‘channel waves’ effect) due to low velocity zones in the upper mantle (Levshin and Panza 2006).
The main purpose of research projects between the Italian Civil Protection Agency and the National Institute of Geophysics and Volcanology (INGV) is to facilitate estimation of realistic scenarios of ground shaking for the Italian territory, immediately following the occurrence of an earthquake. To this end, the effects of the shallow geology have to be taken into account and accurate corrections at the seismic stations must be performed on the basis of the stiffness properties of the near-surface formations. The activity of our group within these research projects is directed towards the detailed soil characterization in terms of S-wave velocity for several sites of the Italian Strong Motion Network (RAN).
As a matter of fact, seismic stations are usually located on rocky sites or at sites where a high stiffness formation is included within the soil column. The main motivation for the present work lies in some interesting observations that have emerged from the comparison of different S-wave profiling methods at such sites, where several potential pitfalls associated with surface wave inversion must be addressed properly to obtain realistic S-wave estimates.
This paper is organized as follows. First, the investigation methods that are compared in this study are briefly reviewed, with emphasis on the acquisition and interpretation procedures. Then, three synthetic examples are introduced to point out some characteristic features of surface wave propagation in earth models containing marked  variations. These key points will be supported by the experimental evidence at three test sites, where the results of different S-wave profiling techniques are described and compared, in order to draw conclusions regarding the potential, the reliability and the limits of the different techniques, with particular focus on surface wave methods.
DATA ACQUISITION AND ANALYSIS
The shear velocity profiling techniques compared in this study are: active and passive surface wave methods based on Rayleigh waves (Socco and Strobbia 2004; Park et al. 2007) and borehole methods, particularly downhole (Hunter et al. 1998) and cross-hole seismics (ASTM 2007). The horizontal-to-vertical spectral ratio method using microtremor data (Bonnefoy-Claudet et al. 2006) was also utilized to examine if the measured resonant frequencies at the three sites match those predicted by theoretical modelling. The assumption underlying these comparisons is that the sites under investigation are nearly one-dimensional within the seismic array spreads. This condition was checked on-site using symmetric shots in active surface wave surveys and performing several single-station microtremor measurements along the seismic arrays.
For the comparison between different methods, the reference depth target for near surface characterization is fixed as the conventional 30 m used for the EC8 soil classification (CEN 2003). The S-wave borehole profiles constitute the reference, allowing the association between shear velocity variations and the stratigraphy derived by continuous coring. The comparison between cross- or downhole shear-wave profiles and the shear-wave profiles obtained by surface wave inversion is ‘blind’, meaning that no information is taken from borehole data to be introduced as a priori information into the surface wave inversion.
Borehole methods
Borehole seismic methods have well established acquisition and interpretation procedures for shear-wave detection (Hunter et al. 1998; ASTM 2007) and are widely used for near surface soil characterization. The main drawbacks of the low-power impact sources (generally a sledgehammer) used for these investigations are the poor repeatability of the source signature and the low trigger precision. These limit the stacking coherency and thereby the possibility to improve the S/N ratio.
To remove the resulting ambiguities, which can be particularly restrictive in the case of high velocities and short travel-times, a significant technological advance was to adopt a new generation borehole sparker, capable of maximizing the emission of either P- or SH-waves using different probe modules. The generation of polarized SH-waves is achieved using additional components mounted on the P-wave borehole sparker probe: a high impedance steel tube, a downhole magnetic compass and a pneumatic clamping device. The steel tube, mounted over the sparker, has a side window that allows the axial pressure pulse to be converted and focused in the horizontal direction (Fig.1). When the probe is pressed to the borehole walls by the pneumatic packer, the seismic pulse generates a horizontal shear motion into the ground. This shear wave can be polarized according to the user’s needs depending on the strike direction (i.e., on the position of the side window), which can be controlled using the embedded downhole compass. This source is used in both cross-hole and downhole prospecting; in the latter case a complementary shallow borehole (1.5–2.0 m) is drilled for the source deployment. The 3C borehole geophone is oriented in the hole by an embedded magnetic compass, in order to properly restrict the SH-wave to the transverse component. The result is a clearer identification of S-waves and enhanced stacking possibilities.
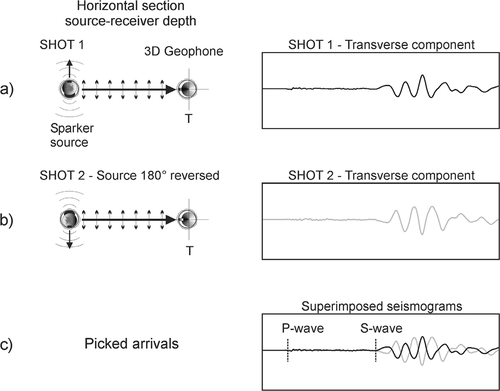
Identification of the shear-wave arrival from the transverse component records of the borehole geophone. The shot direction is set at right angles to the source-receiver line. a) Shot 1 is fired in the transverse direction with respect to the source-geophone line. b) Polarity is reversed and Shot 2 is fired at 180° with respect to the Shot 1 direction. c) Picking of the S-wave arrival is enhanced by overlapping the opposite polarity records at each location.
 (1)
(1)Where  is the corrected traveltime,
  is the traveltime as read from the recorded seismograms,
  is the horizontal offset of the source and
  is the source-receiver depth difference for the
  receiver location. Then, the layer velocities are computed from the slope of the corrected traveltime-distance curves. In the case of cross-hole measurements, source and receivers are deployed at the same depth in the two holes, to permit horizontal raypaths and oriented to give correct recording of SH-waves. In both cases, the S-wave first arrivals are detected in the recorded seismograms by phase inversion of the polarized S-waves generated by 180 degree rotation of the source (Fig.1).
Surface wave methods
Different array geometries and acquisition parameters are used depending on whether surface wave survey is active or passive (seismic noise recordings). While active surface wave acquisition is usually performed using linear and equally-spaced arrays, two-dimensional arrays are generally preferred for passive surface wave acquisition to avoid apparent velocity misinterpretation. The recorded data are processed using integral transform of several types: the phase-shift method (Xia et al. 2007) is preferred for active shot gathers, whereas passive dispersion curves are imaged using frequency-wavenumber methods (Capon 1969) or modified phase shift methods (Park and Miller 2005). Maxima of the transformed shot gather are picked using an automatic maxima search procedure; repeated measurements enable estimation of the observational error on the dispersion curves. Observed dispersion points are then inverted for S-wave velocity as described below, using a forward algorithm based on normal mode computation (‘modal’ inversion).
Forward problem
 (2)
(2)where  is the phase velocity,
  is frequency,
  the number of layers in the model (where the
  layer is the bottom infinite half-space),
  and
and  are respectively the P-wave velocity, the shear-wave velocity, the density and the thickness of a generic layer
  in the earth model. Equation (2) is called the secular or characteristic equation of Rayleigh waves and
  is the secular function. The solutions of the secular equations
  represent the modal curves, giving the variation of phase velocity with frequency for each propagating mode of the Rayleigh wavetrain. The secular function may have multi-valued solutions: for a certain frequency, multiple propagating modes may exist. For higher modes, the solutions are restricted to frequencies above the modal cut off frequency.
Modern propagator methods (Wang and Herrmann 1980) are a class of algorithms that efficiently compute the implicit secular function  . Its zeros are calculated using an iterative root-search procedure based on Brent’s method (Press et al. 1997). Additional control on the computation is performed to detect mode jumps between adjacent solution points with an adaptive step-size, reducing the search step by a factor of 10 in the case of missing solutions. This procedure is repeated up to three times before excluding the possibility of computing an assigned mode for a certain frequency. These automatic controls are important in global inversion, where the forward problem needs to be solved several thousand times and visual inspection is not practical because of the huge number of computed earth models. Full waveform modelling by the reflectivity method (Müller 1985) is used for synthetic seismogram computation and a posteriori control on the modal superposition (effective phase velocity) of the inverted model (Cercato 2009).
Inversion algorithm
For modal surface wave inversion both heuristic and local inversion strategies are routinely used. The very fast simulated annealing (Ingber 1989; Sen and Stoffa 1995) is chosen among global algorithms for its robustness and for the reduced number of inversion parameters to be tuned to the specific problem. The algorithm mimics the physical process of the annealing of a melted solid, where the temperature  (which is the main control parameter of the inversion algorithm) is lowered by an appropriate schedule.
In the very fast simulated annealing algorithm, random models are drawn from a Cauchy-like distribution that is, in turn, a function of temperature. In surface wave modal inversion, the unknowns are the layer shear velocities and thicknesses. Densities and P-wave velocities are required as a priori information. Densities generally vary within a few decimal points for near-surface materials, while P-wave velocities are estimated using a 1D approximation from the first arrival traveltimes on the recorded seismograms. Due to the low sensitivity of the modal dispersion curves on these parameters (Xia et al. 1999; Cercato 2007) these assumptions have a low impact on the surface wave inversion process. Either the P-wave layer velocities or the Poisson’s ratios (which may be known from the geological nature of the deposits) can be held fixed during the inversion, depending on available information.
 (3)
(3)where  is the number of dispersion points,
  is the observed phase velocity at frequency
  and
and  is the predicted phase velocity value for the current model at the same frequency
  .
.
 is bounded within limits such as:
  . At each iteration
  , each model is randomly perturbed and the difference in the energy function is computed as:
 (4)
(4) (5)
(5)Models that lower misfit are always accepted, while models that increase misfit are accepted with a finite (and temperature dependent) probability. This probability-dependent acceptance criterion, together with an appropriate cooling schedule, assures that the solution is not trapped in local minima and that the global minimum is not dependent on the initial guess.
Twenty multiple very fast simulated annealing runs (with 10 000 models) are evaluated during the inversion process, with ten iterations per temperature and an initial temperature  . Very fast simulated annealing is also used for resolution, sensitivity and uncertainty analysis (Sen and Stoffa 1995). The number of total random perturbations per inversion is enough to reach convergence in the estimation of the a posteriori probability distribution.
 accepted models, a mean model is constructed as:
 (6)
(6) (7)
(7)where the square roots of the diagonal elements of C represent the standard deviations of the unknowns.
 (8)
(8)where  is a generic element (
 row and
  column) of the covariance matrix C defined in equation (7).
Microtremors
The horizontal-to-vertical spectral ratio is a widely used seismic technique employing single station (3C) passive noise measurements (microtremors). The ratio is taken between the amplitude spectra of the horizontal components and that of the vertical component. In this paper the horizontal-to-vertical spectral ratio method is used mainly to investigate the natural resonant frequency of the site.
The possibility of estimating the amplification factor via horizontal-to-vertical spectral ratio is questionable, particularly if non-linear soil-behaviour at high strain should be taken into account to assess realistic amplification factors. Additionally, it is often not clear if the H/V peak is linked to the S-wave transfer function or to the ellipticity of the Rayleigh wavetrain (Bonnefoy-Claudet et al. 2006). However, for nearly 1D deposits with strong velocity-contrasts between soft layers and rock basement, the first resonant S-wave peak and the fundamental mode ellipticity are centred around the same frequency value. Hence, the nature of the noise is not a major concern when evaluating the first resonant frequency.
For our examples, which involve high velocity contrasts, we will compare the experimental horizontal-to-vertical spectral ratios with the ellipticity of the Rayleigh-wave fundamental mode, to show if the ellipticity predicted for a certain profile matches the experimental results. Additionally, we usually perform several horizontal-to-vertical spectral ratio measurements, to assess if the fundamental frequency is stable within the investigated area, hence confirming the 1D assumption underlying the seismic prospecting interpretation. Each horizontal-to-vertical spectral ratio measurement consists of at least one-hour of recording time. The seismic signals are recorded at a sampling rate of 125 Hz using a 24-bit seismic recorder (Reftek130) equipped with a three-component long-period seismometer (Le3d-5sec; eigenfrequency of 0.2 Hz). The horizontal-to-vertical spectral ratios are computed following the processing procedures developed within an European project (http://sesame-fp5.obs.ujf-grenoble.fr). We select, for each microtremor record, the stationary portion of the signal adopting an anti-trigger algorithm to remove strong transients inside the time histories. The selected time windows have been detrended and 5% cosine tapered. The Fourier amplitude spectra were computed and then smoothed following Konno and Omachi (1998) and the two horizontal spectra are combined into a quadratic mean before dividing by the vertical component spectrum. The final horizontal-to-vertical spectral ratios are obtained by averaging the H/V spectral ratios from all the selected time windows.
SYNTHETIC MODELLING
Selected earth models taken from recent literature will be used for synthetic modelling and inversion. The purpose is to mimic properties shown by the real data examples that will be introduced in the next section. With reference to Table 1, the earth model A05 is a four layer model after Asten et al. (2005), the earth model LP06 is a two layer model after Levshin and Panza (2006), while the earth model L02 is a six layer model after Liang et al. (2008).
| Layer number |  |
 |
 |
 |
|---|---|---|---|---|
| A05 (Asten et al. 2005) | ||||
| 1 | 500 | 130 | 1.80 | 2.0 |
| 2 | 1700 | 140 | 2.00 | 2.8 |
| 3 | 1700 | 160 | 2.00 | 17.0 |
| 4 | 1700 | 550 | 2.40 |  |
| LP06 (Levshin and Panza 2006) | ||||
| 1 | 1000 | 500 | 1.80 | 10.0 |
| 2 | 3000 | 1500 | 1.80 |  |
| L02 (Liang et al. 2008) | ||||
| 1 | 650 | 194 | 1.82 | 2.0 |
| 2 | 750 | 270 | 1.86 | 2.3 |
| 3 | 600 | 100 | 1.60 | 2.5 |
| 4 | 1800 | 485 | 1.96 | 2.8 |
| 5 | 2150 | 603 | 2.02 | 3.2 |
| 6 | 2800 | 740 | 2.09 |  |
A synthetic shot gather is generated by reflectivity modelling (Müller 1985) for each earth model. It is then transformed into the frequency-phase velocity  spectrum (Xia et al. 2007), where the absolute maxima of the spectrum are picked at each frequency using an automatic maxima-search procedure. To generate the 72-channel synthetic shot gathers of particle velocity, a vertical point source at the surface level is selected and attenuation is introduced for numerical stability (Müller 1985). Uniform quality factors (
 and
and  ) are used for all layers, with a twofold purpose: avoiding singularities in the calculation of the slowness integrals (as needed by the reflectivity method to create the synthetic seismograms) and limiting the distortion induced by attenuation on the ideal elastic dispersion curves. The embedded source wavelet is a Ricker wavelet with a 20 Hz frequency peak; receiver spacing
  m and source offset
  m are selected for all models.
Figure 2 displays the results of synthetic modelling for model A05. Figure 2(c) shows that the fundamental mode is dominant over the entire frequency range of the synthetic measurements. On the other hand, as shown in Fig. 3(c) for model LP06, a mode jump from the fundamental to the first higher mode is predicted at about 18 Hz. Similar results where a mode jump is associated with a stiff bottom layer, are shown in Socco and Strobbia (2004) and Park et al. (2005). Going further, if a major stiffness contrast is associated with a velocity inversion (i.e., the shear-wave velocity is not monotonically increasing with depth) the possibility of higher-mode dominance is considered more common (Forbriger 2003). Model L02 is an example of this case. In fact, the synthetic seismograms in Fig. 4 show a quite complicated effective phase velocity pattern, with higher mode dominance above 25 Hz due to the shallow velocity inversion.
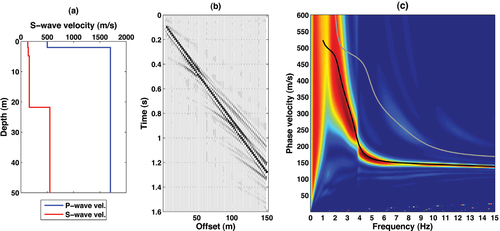
Synthetic modelling of the earth model A05 in Table 1. The earth model velocity profiles, synthetic shot gather and the related  spectrum are labelled a), b) and c). In c) the black and grey solid lines represent the fundamental and the first higher modes, respectively.
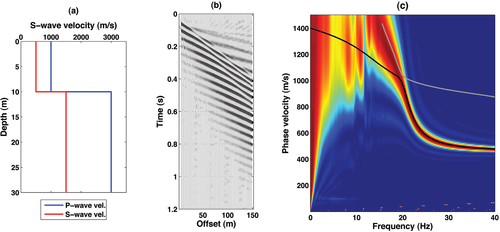
Synthetic modelling of the earth model LP06 in Table 1. The earth model velocity profiles, synthetic shot gather and the related  spectrum are labelled a), b) and c). In c) the black and grey solid lines represent the fundamental and the first higher modes, respectively.
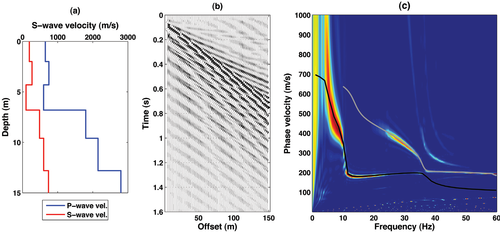
Synthetic modelling of the earth model L02 in Table 1. The earth model velocity profiles, synthetic shot gather and the related  spectrum are labelled a), b) and c). In c) the black and grey solid lines represent the fundamental and the first higher modes, respectively.
 (9)
(9)The fundamental mode sensitivities for model L02 are displayed in Fig. 5. As pointed out by Liang et al. (2008), the sensitivities of the fundamental mode with respect to shear-wave velocity for the layers below the low-velocity layer (LVL) are extremely low and the resolution associated with those layers is poor. This may constitute a severe limitation for the resolving power of surface wave methods in such cases. Moreover, the possibility of detecting single branches of modal curves depends on the actual mode superposition (effective phase velocity), which can be quite complicated (as in Fig. 4) and on the characteristics of the experiment such as array geometry, acquisition parameters and ambient noise.
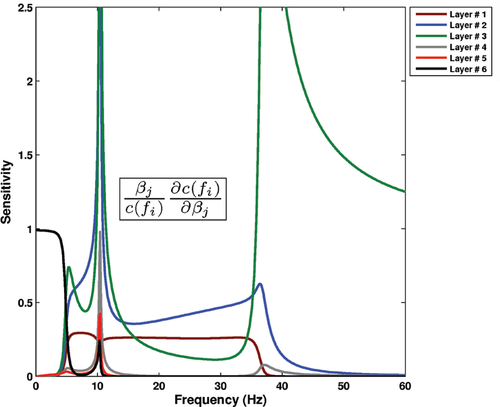
Sensitivities of the fundamental mode dispersion curve with respect to the layer shear wave velocities of the earth model L02 in Table 1.
REAL DATA EXAMPLES
Three case histories have been selected from among the sites investigated of the Italian seismic network, to point out peculiarities in surface wave behaviour, similar to the synthetic cases introduced in the previous section. For each site, the borehole prospecting results together with the stratigraphy retrieved from continuous coring are introduced first, in order to give an overall picture of the site under investigation. Nonetheless, surface wave inversion is carried out without including information taken from boreholes in the inversion process, in order to perform a blind comparison between the different prospecting methods.
Gubbio (PG), Central Italy
The site of the first case study is located in the Gubbio basin (PG), Central Italy. This sedimentary basin is characterized by significant site effects (Pacor et al. 2007; Bindi et al. 2009). Earthquakes recorded by seismological stations deployed within the Gubbio basin are indeed characterized by large amplification and duration of the seismic ground motion, especially at low frequency  . The geometry and the acquisition parameters of the seismic investigations carried out at this site are reported in Table 2 and the survey locations are displayed in Fig. 6. In particular, to investigate the dispersion properties at low frequency, we adopted a large aperture 2D array using long-period seismological seismometers (Le3d-5s) as receivers.

Survey location at the Gubbio site. The white open circle indicates the downhole location. The green solid line marks the 108 channel array for active surface wave prospecting, while the red solid line represents the 2D L-shaped passive array with 24 low-frequency receivers. The blue circles represent single station horizontal-to-vertical spectral ratio measurements.
| Type of receivers | Number of receivers | Array geometry | Receiver spacing | Source type | Source offset | Sampling rate | |
|---|---|---|---|---|---|---|---|
| SW – active | 4.5 Hz − vert. | 108 | Linear | 2 m | Shotgun | Max. 50 m | 0.250 ms |
| SW – passive | 0.2 HZ − vert. | 24 | L-shaped |  30 m 30 m |
– | – | 8 ms |
| Downhole | 14 Hz −3C | 3 | – | 1 m | Borehole Sparker | 3.5 m from top hole | 31  |
Figure 7 reports the results of downhole prospecting down to 48 m depth. A strong shear velocity contrast is retrieved at about 44 m, where the clayey alluvial material is passing to coarser deposits such as heterogeneous sandy gravel. An example seismogram of the active seismic prospecting is shown in Fig. 8(a). In Fig. 8(b,d) it is shown how higher surface wave modes can be enhanced by time-offset muting on active recordings (Ivanov et al. 2005). Comparing the  panel of the unmuted seismogram in Fig. 8(b) with the
  panel of the muted seismogram in Fig. 8(d), it is observed that, although close to one another, the fundamental mode and the first higher mode branches remain distinct. Hence, this case study resembles the synthetic example of Fig. 2, where the fundamental mode is dominant over the entire frequency range.
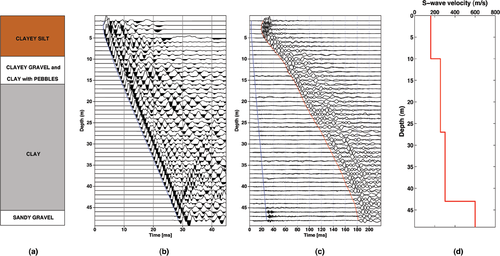
Downhole seismograms at Gubbio (PG), Central Italy. a) Simplified stratigraphic column. b) P-wave records (vertical component): the blue line indicates the first arrivals. c) S-wave records (transverse component). For each receiver position, the two traces corresponding to the opposite shot directions are superimposed; the red and blue lines show the S-wave and the P-wave arrivals respectively. d) The S-wave velocity profile.
In Fig. 9, we show the results of very fast simulated annealing inversion of the fundamental dispersion curve extracted from active shot gathers only. When looking at Fig. 9(a), one may infer that the inverted models are in good agreement with borehole results, with limited uncertainty on layer parameters (Fig. 9d,e). It may be noted that, especially for the minimum misfit model (red solid line) in Fig. 9(a), the bottom layer velocity obtained from the very fast simulated annealing inversion, which is averaged over a broad volume, tends to be lower than the point value obtained by downhole seismics.
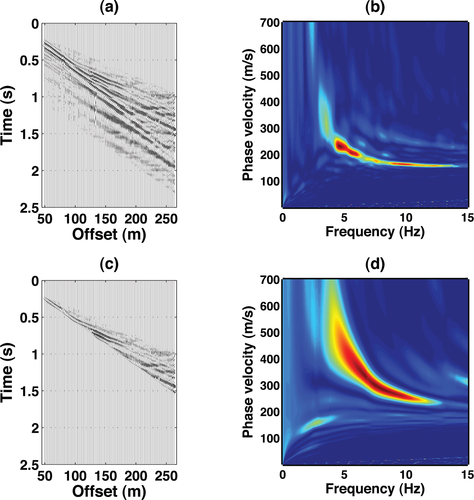
Effects of time-offset muting on shot gathers at the Gubbio site. a) Unmuted seismograms. b)  panel of the unmuted seismograms in (a). c) Shot gather obtained by muting the original seismograms in (a) after muting below 280 m/s. d)
  panel of the muted seismograms in (c): the first higher mode is enhanced.
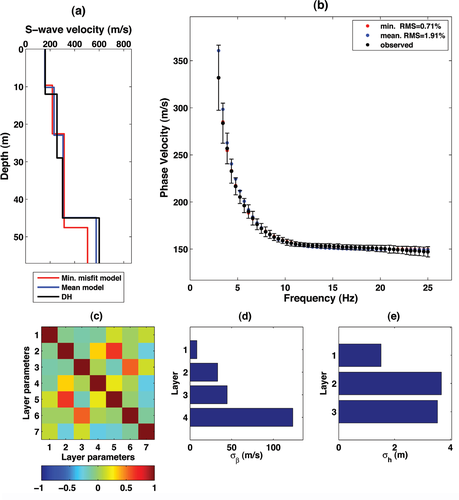
Active surface wave data inversion at Gubbio. a) Mean model (blue solid line) and minimum misfit model (red solid line) obtained by very fast simulated annealing inversion compared with the downhole results (black solid line). b) Observed and predicted dispersion curves. c) Standard correlation matrix after very fast simulated annealing inversion. The first four layer parameters correspond to layer shear velocities while the last three (5–7) correspond to layer thicknesses. d) Uncertainty estimation for layer shear velocities after very fast simulated annealing inversion. e) Uncertainty estimation for layer thicknesses after very fast simulated annealing inversion.
This is emphasized and extended considering passive recordings (2D L-shaped array in Fig. 6 and Table 2), expanding the observed dispersion points to lower frequency ranges. In Fig. 10 we show an example of an  panel (Park and Miller 2005) obtained transforming the passive recordings of the 2D array. The combined dispersion curve obtained merging dispersion data from active and passive recordings is displayed in Fig. 11. This combined dispersion ensemble has been inverted by very fast simulated annealing and the inversion results are reported in Fig. 12. The deployment of a large aperture array and the use of long-period receivers permitted the extraction of low-frequency dispersion points and the retrieval of a
  velocity profile deeper than the one obtained by inverting only active data (Fig. 9). When sampling a larger volume of soil by the 2D array, the high-impedance contrast retrieved between 40–50 m depth by downhole prospecting and active surface wave data is less pronounced at about 20%.
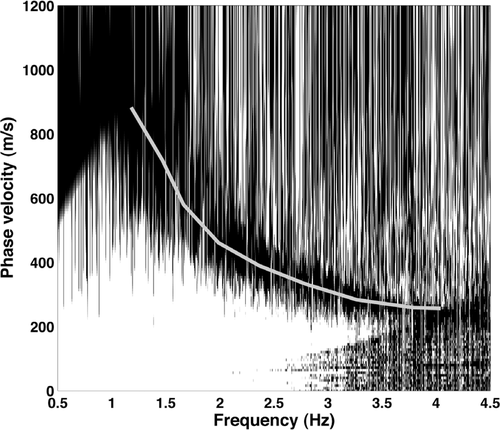
Example  panel of passive recordings by 2D L-shaped array with picked dispersion.

Combined dispersion curve at the Gubbio site. The black circles represent the dispersion points extracted from active shot gathers, while the grey circles are the dispersion points from passive recordings.
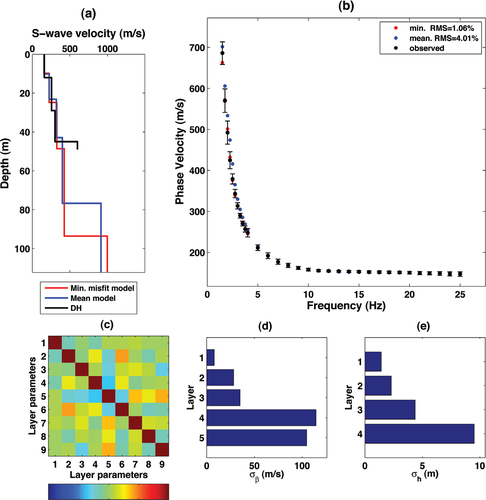
Combined (active and passive) surface wave data inversion at Gubbio. a) Mean model (blue solid line) and minimum misfit model (red solid line) obtained by very fast simulated annealing inversion compared with the downhole results (black solid line). b) Observed and predicted dispersion curves. c) Standard correlation matrix after very fast simulated annealing inversion. The first five layer parameters correspond to layer shear velocities while the last four (6–9) correspond to layer thicknesses. d) Uncertainty estimation for layer shear velocities after very fast simulated annealing inversion. e) Uncertainty estimation for layer thicknesses after very fast simulated annealing inversion.
This is an important point when comparing borehole data and surface wave inversion results. The meaning of the shear-wave profile obtained by down- or cross-hole prospecting is local and may be ascribed to a particular portion of the heterogeneous alluvial sandy gravel, while the surface wave inversion profiles may be more representative of the behaviour of an enlarged area. The results of the a posteriori full-waveform modelling using the reflectivity method (Fig. 14) show the different behaviour of the models obtained by inverting the active and the combined dispersion data set. In the case of active prospecting only (Fig. 14a,b), the frequency range is such as to interpret the bottom layer of the downhole results (heterogeneous sandy gravel with shear velocity of about 600 m/s) as the bottom half-space of the inverted model.
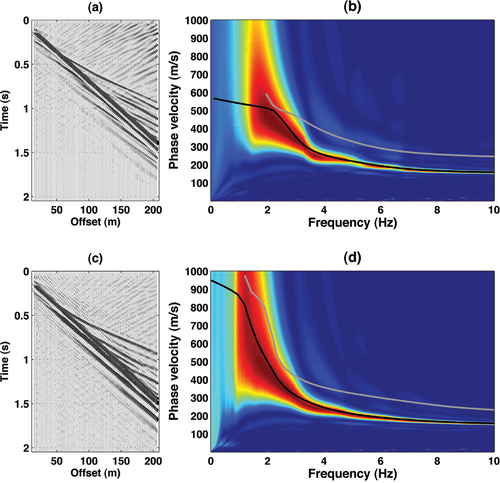
Gubbio (PG) site: a posteriori full waveform modelling using the reflectivity method. a) Synthetic seismograms using the downhole earth model. b)  spectrum of the synthetic shot gather in (a). c) Synthetic seismograms using the minimum misfit model of the combined very fast simulated annealing inversion (red line in Fig. 12a). d)
  spectrum of the synthetic shot gather in (c). In b) and d) the black and grey solid lines represent the fundamental and first higher modes, respectively.
When operating the 2D array, the sampled soil volume is larger in both the vertical and the horizontal directions and some local levels that are laterally heterogeneous may be averaged. The gradient of the shear velocity versus depth obtained by inversion of the combined data set (Fig. 12a) is moderate and the results of the synthetic modelling in Fig. 14(c,d) show a better mode separation and a clearer fundamental mode dominance than the model inferred from active data only (Fig. 14a,b). At the Gubbio site, the near-surface investigation did not reach the base-rock. The site is characterized by alluvial deposits whose shear velocity is gradually increasing with depth.
In such situations, the assumption of a homogeneous bottom half-space at moderate depths, which is dependent on the experimental dispersion bandwidth, is fictitious.
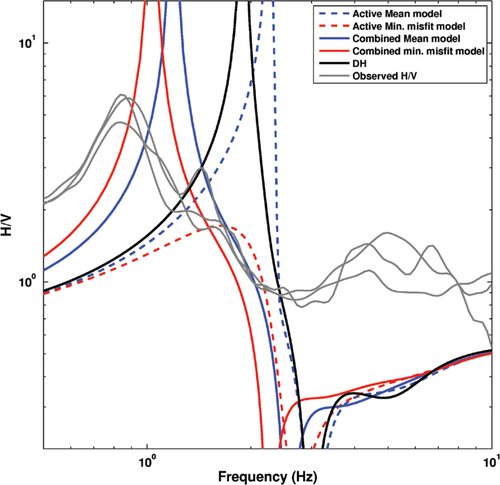
The horizontal-to-vertical spectral ratio data collected at this site are shown in Fig. 13 where they are compared with the fundamental mode Rayleigh wave ellipticity computed for the downhole earth model (black solid line), the minimum misfit models and mean models obtained by active and combined (active and passive) inversion by very fast simulated annealing (Figs 9 and 12, respectively). It can be inferred that a deep velocity contrast, causing a well-defined frequency peak in the horizontal-to-vertical spectral ratio values at about 0.8 Hz, could be resolved by neither downhole nor surface wave investigations where, due to the array aperture, the nature of noise and the fact that vertical receivers only were deployed, it was not possible to pick consistent dispersion points down to the resonant frequency.
In this particular case, a larger seismological array is necessary to reach the depth of the contrast giving the horizontal-to-vertical spectral ratio peak, although, as stressed above, the shear-wave resolution for surface array methods decreases with depth. Nevertheless, the shear-wave characterization is very consistent among different methods for the near-surface targets: the variability in the values of the contrast at the horizon at 40–50 m depth does not seem to have relevant implications as far as soil amplification is concerned. Furthermore, it is out of the depth ranges commonly required by seismic codes.
Valmontone (RM), Central Italy
The second test site is located in Valmontone, which is a small town about 30 km south of Rome, Italy. The results of cross-hole investigation are reported in Fig. 15: in this case, loose alluvial formations constitute the shallower layers, passing to loose volcanic deposits at about 15 m below the ground level, without a consistent change in shear-wave velocity. In contrast, the transition between loose volcanic deposits and stiff volcanic units (mainly tuff) is sharp, with shear-wave velocity increasing to about 850 m/s at 26 m depth.
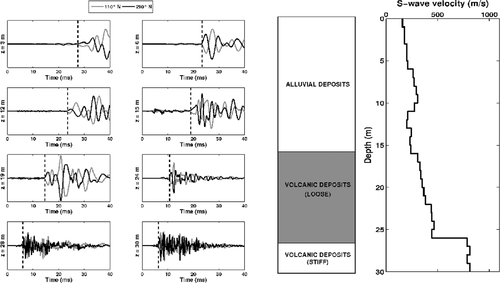
Seismic cross-hole prospecting at Valmontone (RM). Left: example seismograms at various depths. Centre: simplified stratigraphic column. Right: shear-wave profile down to 30 m.
Surface wave prospecting has been carried out using the acquisition geometry described in Table 3. The array spread was limited due to logistical restrictions, as the test site is within an urbanized area. S-wave inversion is treated assuming P-wave velocity and density on the basis of independent information: laboratory testing and seismic refraction (acquired simultaneously with surface wave active acquisition) respectively.
| Type of receivers | Number of receivers | Array geometry | Receiver spacing | Source type | Source offset | Sampling rate | |
|---|---|---|---|---|---|---|---|
| SW – active | 4.5 HZ –vert. | 48 | Linear | 2 m | Shotgun | Max. 8 m | 0.125 ms |
| SW – passive | 4.5 HZ –vert. | 72 | Cross (2D) | 2 m | – | – | 2 ms |
| Cross-hole | 14 Hz –3C | 3 | – | 1 m | Borehole Sparker | 5 m borehole Distance | 31  /is /is |
A prominent feature of the transformed  panel of recorded seismograms, shown in Fig. 16(b), is the presence of a near vertical asymptote at low frequency (about 4.5 Hz). A possible mode jump, like the synthetic example in Fig. 3, can be seen by muting in time-offset (Ivanov et al. 2005). Figure 16(d) displays the f-c panel after muting in time offset below 280 m/s; a probable osculation point (Forbriger 2003) is detected, where the fundamental and the first higher mode approach each other. In this case, if the dispersion is assigned as fundamental-mode dominated over the entire frequency range, a severe overestimation of the bedrock velocity may occur.
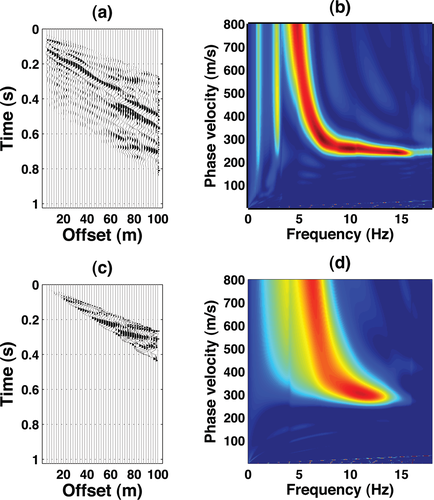
Effects of time-offset muting on shot gathers at Valmontone site. a) Unmuted seismograms. b)  panel of the unmuted seismograms in (a). c) Shot gather obtained by muting the original seismograms in (a) below 280 m/s. d)
  panel of the muted seismograms in (c).
The results of very fast simulated annealing inversion are displayed in Fig. 17. A ‘conservative’ picking of fundamental mode data only (black circles in Fig. 17b) is adopted, on the basis of the time-offset results in Fig. 16. As a matter of fact, considering only fundamental mode data but avoiding mode misidentification, the inverted models (both the mean and minimum misfit earth models) are extremely consistent with the cross-hole results (Fig. 17a), with low uncertainty on the inverted model parameters (Fig. 17d,e). Reflectivity modelling of the minimum-misfit model inverted by simulated annealing is shown in Fig. 18, where the synthetic  spectrum (Fig. 18d) is compared to an observed
  spectrum (Fig. 18b). What is more, if one looks at Fig. 18(d), where the fundamental and the first higher surface wave modes are superimposed on the synthetic
  spectrum, an osculation point associated with a mode jump is predicted at about 4.5 Hz. At this site, a high impedance contrast at moderate depths (about 25 m) is responsible for a multi-modal behaviour, like in the synthetic case of Fig. 3, although, in practice, the possibility of mode separation depends also on array resolution.
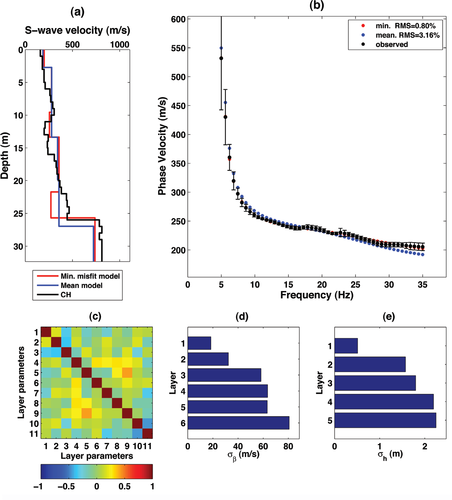
Active surface wave data inversion at Valmontone. a) Mean model (blue solid line) and minimum misfit model (red solid line) obtained by very fast simulated annealing inversion compared with the cross-hole results (black solid line). b) Observed and predicted dispersion curves. c) Standard correlation matrix after very fast simulated annealing inversion. The first six layer parameters correspond to layer shear velocities while the last five (7–11) correspond to layer thicknesses. d) Uncertainty estimation for layer shear velocities after very fast simulated annealing inversion. e) Uncertainty estimation for layer thicknesses after very fast simulated annealing inversion.
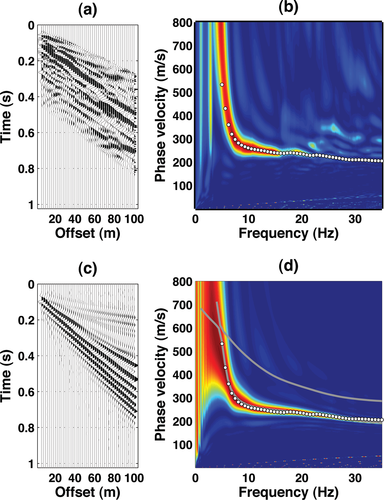
Valmontone (RM) site: a posteriori full waveform modelling using the reflectivity method. a) Real forward shot gather and b) its  spectrum. c) Synthetic shot gather from the minimum misfit model in Fig. 17(a). d) Frequency-phase velocity spectrum of the seismograms in (c). Solid grey lines are the fundamental and first higher modes, while the open circles are observed dispersion points.
| Type of receivers | Number of receivers | Array geometry | Receiver spacing | Source type | Source offset | Sampling rate | |
|---|---|---|---|---|---|---|---|
| SW – active | 4.5 HZ – vert. | 120 | Linear | 2 m | Shotgun | Max. 80 m | 0.250 ms |
| SW – passive | 4.5 HZ -vert. | 120 | Linear | 5 m | – | – | 8 ms |
| Cross-hole | 14 HZ –3C | 3 | – | 1 m | Borehole Sparker | 5 m borehole Distance | 31  /s /s |
The results from the passive 2D array are not reported because, due to the limited aperture of the array and the nature of seismic noise at this site, they did not add information beyond the observations in the active data set. The horizontal-to-vertical spectral ratio data collected in this site are shown in Fig. 19, where they are compared with the fundamental mode Rayleigh wave ellipticity computed for the cross-hole earth model (black solid line), the minimum misfit model (red solid line) and mean model (blue solid line) obtained by very fast simulated annealing inversion (Fig. 17a). This is a further confirmation of the consistency of the inverted models, as the experimental resonant frequency of the H/V spectral ratios is in good agreement with the predicted ellipticity of all three earth models, although a low-frequency peak (0.7 Hz) suggests the presence of deeper bedrock.
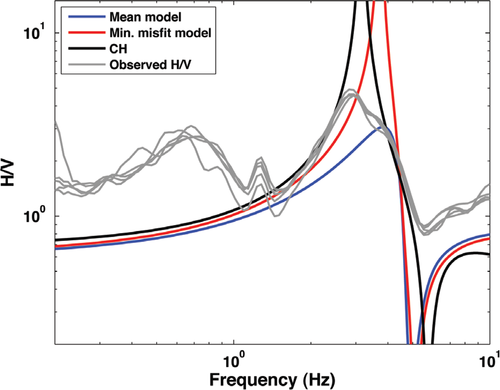
With the help of time-offset muting, a possible osculation point was detected for this case study and mode misidentification avoided. This inference is confirmed by the a posteriori full waveform modelling. In this case study, all the employed techniques, including the independent cross-hole and horizontal-to-vertical spectral ratio investigations, converged towards a fully consistent interpretation.
Barisciano (L’Aquila), Central Italy
In this last real data example, the geological scenario is completely different from the previous test sites. As can be noted from the cross-hole results at the site of Barisciano (AQ), displayed in Fig. 20, the shear velocity profile is marked by a major velocity inversion at a depth of about 36 m. From the borehole stratigraphy (Fig. 20, centre), the near-surface deposits are made up of limestone gravel, passing to sand at 36 m depth. The entire soil column is characterized by high shear-wave velocities.
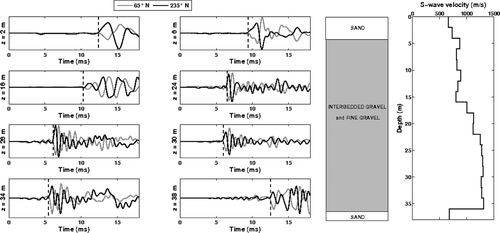
Seismic cross-hole prospecting at Barisciano (AQ). Left: example seismograms at various depths. Centre: simplified stratigraphic column. Right: shear-wave profile
Some example shot gathers (forward and reverse) are displayed in Fig. 21, where the maxima of the transformed shot gathers (Fig. 21b,d) clearly indicate the presence of a velocity inversion.
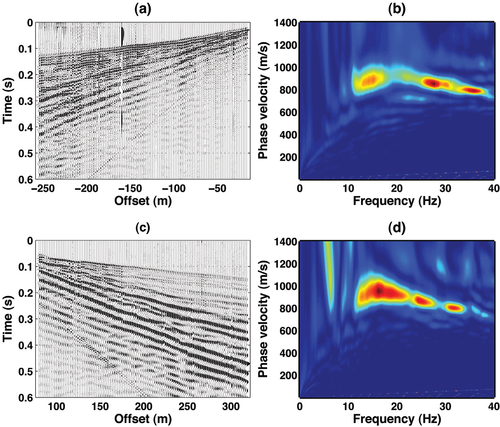
Processing of the real data collected at the Barisciano test site. a) Reverse shot gather (20 m offset). b) Frequency-phase velocity spectrum of shot gather (a). c) Forward shot gather (80 m offset). d) Frequency-phase velocity spectrum of seismogram (c).
Signal propagation is excellent at this site and broad aperture active arrays with large offsets (up to 80 m) were recorded with very good S/N ratio. Passive recordings were not of help for this site and are not displayed. These showed no features that may have improved the reconstruction of the near-surface, while single station horizontal-to-vertical spectral ratio measurements indicate the probable presence of very deep bedrock, related to a resonant frequency of about 0.5 Hz, which is substantially out of range for near-surface characterization. As for the previous case studies, the dispersion curve ensemble was inverted using very fast simulated annealing inversion: the results are displayed in Fig. 22. It is recognized that the reconstruction is in substantial agreement with the borehole profile, although the shear velocity of the low velocity layer is defined with considerable uncertainty (about 150 m/s, Fig. 22d).
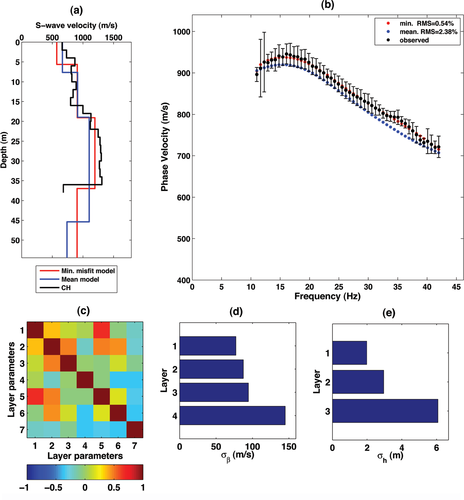
Active surface wave data inversion at Barisciano (AQ). a) Mean model (blue solid line) and minimum misfit model (red solid line) obtained by very fast simulated annealing inversion compared with the cross-hole results (black solid line). b) Observed and predicted dispersion curves. c) Standard correlation matrix after very fast simulated annealing inversion. The first four layer parameters correspond to layer shear velocities while the last three (5–7) correspond to layer thicknesses. d) Uncertainty estimation for layer shear velocities after very fast simulated annealing inversion. e) Uncertainty estimation for layer thicknesses after very fast simulated annealing inversion.
It is remarkable that no clear information about layers below the velocity inversion could be retrieved, although the lowest frequency dispersion points are well above the nominal frequency of the receivers. In this case, we can infer a condition that is similar to the one depicted in Fig. 4, apart from the fact that no higher mode dominance at high frequency is observed in the real case, probably because the velocity inversion is much deeper in the real case than in the synthetic one.
Figure 23 reports the result of the full waveform modelling of an earth model that is obtained by adding four layers of increasing velocity below a six-layer shear-wave profile similar to the cross-hole measurements in Fig. 20. The resulting  panel of the synthetic shot gather obtained by reflectivity modelling is reported in Fig. 23(b). Even in this ideal noise-free case, the consistency of spectral maxima below the velocity inversion is very poor.
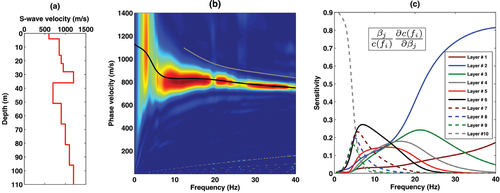
Barisciano (AQ) site: a posteriori full waveform modelling using the reflectivity method.(a) Shear-wave profile obtained by adding four layers below a six-layer shear-wave profile similar to the cross-hole measurements in Fig. 20. b) The  synthetic spectrum obtained after reflectivity modelling. The black and grey solid lines represent the fundamental and the first higher mode respectively. c) Sensitivity of the fundamental mode with respect to layer shear velocity for the earth model in (a).
The sensitivity analysis displayed in Fig. 23(c) may be of help in explaining this behaviour. It is seen in the figure that the sensitivity of the fundamental mode dispersion curves for the layers below the LVL (layer 6 in the model) is always less than the sensitivity to the variation of the LVL shear velocity itself (black solid line). Although the sensitivities with respect to these layers have a peak centred at about 5 Hz, their curves are well below the values of the LVL sensitivity in this area. However, as far as the near-surface is concerned, again for this example the agreement between cross-hole results and inverted shear-wave profile from surface wave prospecting is commendable.
DISCUSSION
The structure of the earth model plays a fundamental role as far as surface wave mode superposition is concerned. We have modelled three classes of 1D earth models in the section ‘Synthetic modelling’, which resemble the interpreted results at three test sites in Central Italy. In the case of normally dispersive test sites (where the velocity is gradually increasing with depth) it is generally recognized that the Rayleigh wave fundamental mode is dominant over the entire frequency range, either for active and passive data sets. The situation is different when a considerable stiffness contrast is present within the soil column. As modelled by the reflectivity method (Fig. 3) and verified in the case-study of Valmontone (in section ‘Valmontone (RM), Central Italy’), mode jumps may characterize the phase velocity superposition and higher modes may be dominant over specific frequency ranges.
In case of a shear velocity inversion at depth, as stated by Liang et al. (2008) (synthetic model in Fig. 4) and inferred in the case study of Barisciano (in section ‘Barisciano (L’Aquila), Central Italy’), the sensitivity of Rayleigh wave dispersion curves tends to remain low for the layers below the low velocity zone. This may lead to poorly resolved inversion for these layers.
Passive recordings are site and time dependent: the frequency range available at a certain location may be useless for the problem under investigation. Generally, the use of passive methods is to reach lower frequencies and deeper targets than using active prospecting only. Again, the interpreter must be aware that the lower the frequency the poorer the resolution and that it is impossible to resolve thin layers beyond a certain depth using surface wave methods only.
For example, in the case study of Gubbio (in section ‘Gubbio (PG), Central Italy’) we found there to be a clear discrepancy between the results obtained by downhole and active surface wave prospecting (down to about 50 m of depth) with the deeper soil profile obtained using passive recordings. In the latter case, the investigated soil volume is much larger and the results may be considered as averages over a wider spatial extent. This variability should not affect amplification significantly.
Generally, high stiffness contrasts in the near-surface are responsible for well-defined resonant frequency peaks (as in the case study of Valmontone): this result can further support the structural reconstruction of the subsoil. In certain geological settings in Central Italy, where the bedrock is deep (deeper than 100 m), such as at Gubbio and Barisciano, horizontal-to-vertical spectral ratio surveying is more relevant for seismological studies than for near-surface characterization.
CONCLUSIONS
Some points are well understood when comparing surface wave inversion results to invasive shear-wave profiling methods, such as cross- and downhole: borehole investigations are more expensive and their interpretation is more direct and simple. A relevant issue is that borehole seismics, particularly cross-hole surveys, are able to investigate the entire soil column with the same resolution, while surface wave surveys are characterized by a rapid loss of resolution with depth. Furthermore, surface wave inversion needs some a priori information such as P-wave velocities and layer densities to infer the S-wave velocity profile (Xia et al. 1999; Socco and Strobbia 2004).
In spite of that, the examples reported in this paper support that the resolution achieved by surface wave inversion is adequate to provide an accurate shear-wave soil classification according to modern seismic codes (CEN 2003). In the three case studies reported, which all have marked stiffness contrasts present in the soil profile, the borehole and the (blind) inverted shear-wave profiles, correlate well. In some situations the detail obtained by surface wave inversion, when compared to borehole results, may be unsatisfactory for certain applications (where the association of the shear-wave values to lithological units is strictly required), although it is generally adequate for engineering site amplification studies. On the other hand, as the shear-wave velocity profiles obtained by surface waves involve the investigation of larger volumes of soil than borehole surveys, the surface wave inversion may be considered more representative of a certain region, whereas borehole results are more detailed but pertinent to the borehole location only and their extension to the surroundings is often questionable.
Nevertheless, in sites with high stiffness contrasts, we have pointed out a few potential pitfalls for surface wave inversion, mainly associated with modal misidentification and with overestimation of the surface wave resolving power. More specifically, the presence of particular shear-wave variations with depth is often responsible for higher mode dominance, not only in case of a low-velocity layer but also for normally dispersive sites where the shear velocity increases with depth. Hence, it is important to check about surface wave modal superposition using active data sets and full waveform modelling, to avoid mode misidentification.
As the detail that can be obtained by surface wave inversion decreases with depth, to assess the quality of the inverted shear-wave profiles, it is also strongly recommended that sensitivity analysis and uncertainty estimation be performed to avoid overestimated detail in the shear-wave profiles, which could be misleading for engineering applications.
To this end, the role of active multichannel analysis of surface waves (MASW) appears very important in defining the effective Rayleigh wave velocity distribution, to avoid mode identification pitfalls when working solely with passive data.
The choice of the optimal technique for shear-wave soil profiling depends on several factors, either technical (including the depth target and the required resolution) or non-technical (funds and budget available, cost effectiveness, logistics, time requirements). It is the authors’ opinion that an integrated approach is particularly advantageous when the study is not restricted to a specific site but involves territorial problems, such as seismic zonation.
ACKNOWLEDGEMENTS
The experimental data reported in this manuscript were acquired in the research projects DPC-S4 and DPC-S3 supported by the Italian Civil Protection Agency (Dipartimento di Protezione Civile, DPC). Giorgio De Donno (‘Sapienza’ University of Rome), Salomon Hailemikael (‘Sapienza’ University of Rome), Francesco Pugliese (‘Sapienza’ University of Rome) and Luigi Improta (INGV) are thanked for their help during field operations. Finally, the authors are indebted to Dr A.J. Haines (University of Cambridge) for his language editing of the final version of the manuscript.


