Tasks, Automation, and the Rise in U.S. Wage Inequality
Abstract
We document that between 50% and 70% of changes in the U.S. wage structure over the last four decades are accounted for by relative wage declines of worker groups specialized in routine tasks in industries experiencing rapid automation. We develop a conceptual framework where tasks across industries are allocated to different types of labor and capital. Automation technologies expand the set of tasks performed by capital, displacing certain worker groups from jobs for which they have comparative advantage. This framework yields a simple equation linking wage changes of a demographic group to the task displacement it experiences. We report robust evidence in favor of this relationship and show that regression models incorporating task displacement explain much of the changes in education wage differentials between 1980 and 2016. The negative relationship between wage changes and task displacement is unaffected when we control for changes in market power, deunionization, and other forms of capital deepening and technology unrelated to automation. We also propose a methodology for evaluating the full general equilibrium effects of automation, which incorporate induced changes in industry composition and ripple effects due to task reallocation across different groups. Our quantitative evaluation explains how major changes in wage inequality can go hand-in-hand with modest productivity gains.
1 Introduction
Wage inequality has risen sharply in the United States and other industrialized economies over the last four decades.1 Figure 1 depicts some of the most salient changes in the U.S. wage structure since 1980: while the real wages of workers with a post-graduate degree rose, the real wages of low-education workers fell or remained stagnant. The real earnings of men without a high-school degree are now 15% lower than they were in 1980.

This paper proposes a new approach for thinking about wage inequality. In our theory, shifts against less skilled workers result from technologies that automate and thus displace workers from tasks they used to perform. Our main contribution is to develop a general version of this theory and show how it can be applied to quantify the effects of automation on wages and inequality. Based on this approach, we document that between 50% and 70% of the overall changes in the U.S. wage structure over the last four decades are driven by automation. In particular, automation reduced the relative, and in some cases real, wages of workers specializing in routine tasks in industries undergoing rapid automation (such as those working in blue-collar jobs in manufacturing industries that introduced numerical-controlled machinery and industrial robots, or those in clerical tasks in industries that introduced software-based automation). In contrast, worker groups that were not displaced from their tasks, such as those with a post-graduate degree or women with a college degree, enjoyed wage gains.
Our framework models the allocation of a range of tasks across industries to capital and demographic groups, each with a different comparative advantage. Technological progress can increase the productivity of some demographic groups (e.g., skill-biased technological change, SBTC, can augment the productivity of groups with higher education); it can raise the productivity of capital in its current tasks; and most importantly, it can automate work—which means that the productivity of machines and algorithms increases in tasks previously allocated to workers, thus expanding the range of tasks performed by capital. Our model clarifies the distinct effects of these technological changes: automation displaces workers from tasks where they had comparative advantage, reducing their relative wages and even possibly their real wages.2 In contrast, technologies directly improving the productivity of skilled labor do not involve any displacement and always increase the wages of unskilled workers. In addition, their effects on inequality and factor shares are ambiguous and depend on elasticities of substitution.
The most important contribution of our framework is to provide a methodology for empirically investigating these predictions. At the center of this contribution is a simple equation that relates wage changes of a worker group to the direct task displacement it experiences—a measure summarizing the share of tasks this group of workers loses directly to automation. We show that a group's direct task displacement can be measured as a (weighted) average of automation-driven labor share declines across industries where it specializes in tasks that can be automated.
The second part of the paper documents a robust negative reduced-form relationship between direct task displacement and real wages across groups of workers. For this empirical exercise, we focus on 500 demographic groups defined by education, gender, age, race, and native/immigrant status. We identify tasks that can be automated with those that are routine (as classified in Acemoglu and Autor (2011)). Our first measure of task displacement exploits observed industry labor share declines, which in our framework are closely connected to automation.3 Our preferred measure of task displacement uses information on automation-driven industry labor share declines, which we estimate using data on the adoption of robots, specialized software, and dedicated machinery across industries. These proxies of automation account for 45% of the observed changes in industry labor shares from 1987 to 2016. Using both measures, we find a strong association between task displacement and wages. In our baseline regressions, direct task displacement explains 50–70% of the changes in wage structure across groups between 1980 and 2016. This holds regardless of whether we control for standard forms of SBTC (e.g., allowing the productivity of workers to evolve as a function of their education levels and gender), which account for 10% of the changes in the wage structure. Consistent with the notion that task displacement reflects changes in labor demand, we also estimate negative effects of task displacement on employment.
The relationship between task displacement and wages is unaffected when we control for other potential determinants of industry labor shares and earnings, such as changes in industry concentration and markups, Chinese import competition, and deunionization, and these factors themselves do not appear to have a sizable effect on the U.S. wage structure. Our results also remain unchanged when we control for other forms of capital deepening and TFP growth unrelated to automation. This shows that our estimates are driven by automation and not by other forms of technological progress or capital deepening. Finally, we also show that offshoring-induced task displacement has similar effects on wages, though offshoring accounts for a smaller share of the observed changes in task displacement and the wage structure than automation.4
Although our reduced-form analysis documents a strong negative relationship between direct task displacement and relative wage changes across worker groups, it misses three indirect channels via which automation affects wages in general equilibrium. First, in our regressions, the common effect of productivity increases on wages goes into the intercept, and so our results are not informative about real wage level changes. Second, because automation concentrates in some industries, it will change the industry composition of the economy, which in turn shifts the demand for different types of workers. Third, our reduced-form evidence focuses on the direct task displacement experienced by each group of workers, but does not account for ripple effects, which result from displaced workers competing against others for non-automated tasks, bidding down wages and spreading automation's effects more broadly in the population.
The third part of the paper undertakes a quantitative exploration of these general equilibrium mechanisms and estimates the full implications of automation for the wage structure, real wages, TFP, output, and the industry composition of the economy. Our framework provides explicit formulas to compute these general equilibrium effects as functions of direct task displacement as well as the cost savings from automation, industry demand elasticities, and a propagation matrix representing the strength of ripple effects between different groups of workers (i.e., how much the displacement of group g affects the wage of group  ). The propagation matrix can be estimated by parameterizing group-level interactions as functions of the distance between groups. We combine these estimates with a standard parameterization of demand across industries, available estimates of cost savings from automation, and our measures of direct task displacement to compute the full general equilibrium implications of automation.
We find that automation—incorporating general equilibrium effects—accounts for 50% of the changes in the wage structure during this period and explains 80% of the rise in the college premium. At the same time, we estimate that automation reduced the real wage of high-school dropout men by 8.8% and high-school dropout women by 2.3%. These sizable distributional effects are accompanied by small increases in the average wage level, GDP, and TFP. For example, we find that automation accounts only for a (cumulative) 3.4% increase in TFP between 1980 and 2016. We conclude that stagnant and declining real wages and slow productivity growth can go hand-in-hand in the presence of rapid automation.
Our work contributes to various literatures. First, our conceptual framework builds on previous task models, in particular, Zeira (1998), Acemoglu and Zilibotti (2001), Autor, Levy, and Murnane (2003), Acemoglu and Autor (2011), and Acemoglu and Restrepo (2018), as well as Grossman and Rossi-Hansberg's (2008) model of offshoring. Relative to these papers, our main innovation is our methodology for measuring and estimating the effects of task displacement on wages. The central element of this methodology is the explicit formulas linking wage changes to task displacement, which underpin our empirical work. As part of this contribution, we also develop a general version of existing models of automation and offshoring, in which there are many sectors, many tasks within each sector, and a large number of demographic groups with flexible comparative advantage across tasks and sectors (see also Jackson and Kanik (2020) for a complementary framework to study the implications of automation on inequality).
Most closely related to our paper is Autor, Levy, and Murnane (2003), who also focus on the effects of technologies automating routine tasks and complementing non-routine workers. Our paper can be seen as a generalization of their conceptual framework and derives an explicit relationship between task displacement and wages, which we use in both reduced-form and structural estimation. Other empirical explorations of the consequences of automation include Acemoglu and Autor (2011), Graetz and Michaels (2018), and Acemoglu and Restrepo (2020). These works do not estimate the direct and/or general equilibrium effects of task displacement on the wage structure. Acemoglu and Restrepo (2020), for example, estimated the causal impacts of industrial robots on local employment and wages, but did not look at their effects on the national wage structure, which is our main focus here. It is also important to recall that industrial robots are one of several automation technologies adopted in the U.S. economy over the last four decades.5
Second, our work builds on but fundamentally departs from the traditional literature on SBTC. This literature starts with an aggregate production function of the form  , where H and L are high-skill and low-skill labor, and
  and
and  represent technologies augmenting these workers. SBTC corresponds to technology becoming more favorable to high-skill workers (e.g., a bigger increase in
  than in
  , provided that F has an elasticity of substitution greater than 1). Several works, including Bound and Johnson (1992), Katz and Murphy (1992), Krueger (1993), Autor, Katz, and Krueger (1998), and Card and Lemieux (2001), have explored the evolution of between-group wage inequality in response to changes in factor supplies and skill-augmenting technologies (increases in
  ). We differ from this literature in a number of ways. Most importantly, our focus is on automation technologies displacing certain groups of workers and not on technologies complementing high-skill workers. Our theoretical framework and our empirical results point to a limited role for factor-augmenting technologies in shaping the U.S. wage structure over the last four decades.6
Third, our work builds on and complements the literature exploring the effects of lower equipment and computer prices on wage inequality through capital-skill complementarity. This literature posits an aggregate production function of the form  , in which capital (or equipment) K directly complements skilled workers. These ideas go back to Griliches (1969), and their implications for U.S. wage inequality have been explored in Krusell, Ohanian, Ríos-Rull, and Violante (2000) and Burstein, Morales, and Vogel (2019). As with the SBTC literature, the main mechanism via which technology and capital impact inequality in this literature is through complementarity—thus without any role for task displacement. We clarify the distinction between automation and the capital-skill complementarity studied in this literature, and show that automation has a powerful impact on inequality even when there are no direct capital-skill complementarities.
The rest of the paper is organized as follows. The next section introduces our framework and derives the key equations for our empirical work. Section 3 presents our data and measurement strategy. Section 4 presents the reduced-form evidence. Section 5 explores the general equilibrium effects of automation. Section 6 concludes. Appendix A of the Supplemental Material (Acemoglu and Restrepo (2022)) contains proofs and reports our main robustness checks. Appendix B, which is available upon request, provides additional theoretical results and robustness checks for our quantitative exercise.
2 Conceptual Framework: Tasks, Wages, and Inequality
We start with a single-sector model that illustrates how automation and other technologies affect wages. We then move to our multi-sector model and formally derive the task displacement measure we use in our empirical work.
2.1 Single Sector
Environment and Equilibrium
 using a constant elasticity of substitution (CES) aggregator with elasticity
  ,
,

 ):
):

 is the amount of labor of type g allocated to task x, while
  is the amount of task-specific capital produced for and assigned to this task. The
  and
and  terms represent standard factor-augmenting technologies, which make factors uniformly more productive in all tasks. More importantly, productivity has a task-specific component, represented by the functions
  and
and  , which determine comparative advantage and specialization patterns. Task-specific productivity is zero for factors that cannot perform a task.
 , is produced using the final good at a constant marginal cost
  . Net output, which is equal to consumption, is therefore obtained by subtracting the production cost of capital goods from output:

Labor is supplied inelastically, and we denote the total supply of labor of type g by  .
.
A market equilibrium is defined as an allocation of tasks to factors and a production plan for capital goods that maximizes consumption. Given a supply of labor  , a market equilibrium is specified by wages
  , capital production decisions
  , and an allocation of labor to tasks,
  such that: (i) the allocation of tasks to factors minimizes costs; (ii) capital production decisions maximize net output; and (iii) the markets for capital goods and different types of labor clear. We set the final good as the numeraire, so that the
  's correspond to real wages. Throughout, when a task can be produced at the exact same unit cost by different factors, we assume it is allocated to capital or to the type of labor with the higher index, and we also assume that each factor has a strict comparative advantage for some tasks.7
Task Shares
 represent the set of tasks allocated to labor of type g, and
  the set of tasks allocated to capital. These sets are equilibrium objects that satisfy


 and
and  , which we refer to as the task shares of workers of type g and capital, respectively, give the measure of the set of tasks allocated to a factor weighted by the “importance” of the tasks.8 Task shares depend on the sets
  and
and  , and thus on wages, factor-augmenting technologies, and task productivities. Consequently, they are functions of the vectors of wages w and technology
  , but we omit this dependence when it causes no confusion.
The next proposition characterizes the equilibrium, and expresses factor prices, shares, and output as functions of task shares. Because production in this economy is “roundabout” (capital is produced linearly from the final good), output can be infinite. In Appendix A-2 of the Supplemental Material, we derive an Inada condition that ensures finite output (in the one-sector case, this condition implies  ), and we assume throughout that it is satisfied.
Proposition 1. (Equilibrium)There is a unique equilibrium. In this equilibrium, output, wages, and the capital share in GDP,  , can be expressed as functions of task shares:
 (1)
(1) (2)
(2) (3)
(3)The proposition establishes that task shares—the  's and
  —are the key objects summarizing the distributional effects of technology. Equation (1) shows that output can be represented as a CES aggregate of different types of labor and capital, with elasticity of substitution λ. However, this representation differs from the standard CES production function for three reasons. First, the distribution parameters, which are exogenous in the standard CES, are now endogenous and are given by the task shares, the
  's. They are functions of not just factor prices (via the dependence of the sets
  and
and  on factor prices), but also technology. Second, despite appearances, the elasticity of substitution between factors is not equal to λ, but
  . The exact value of σ depends on endogenous substitution taking place as tasks are reallocated (again captured by changes in the sets
  and
and  , or variations in the
  's and
  in response to factor prices). Finally, the term
  accounts for the roundabout nature of production.
Equation (2) is intuitive: real wages are given by the marginal product of each type of labor, which is a function of output per worker (raised to the power  ) and the factor-augmenting technology,
  (raised to the power
  ). More novel and central to our empirical strategy is that wages also depend directly on task shares, the
  's, highlighting a key aspect of our model: the real wage of a factor is linked to its task share.
Although task shares are endogenous objects, Proposition 1 is useful because it clarifies how the impact of automation technologies on equilibrium outcomes work via their influence on task shares. In particular, automation impacts equilibrium prices and quantities by reallocating tasks away from labor and thus reducing the  's. Building on this insight, we next show that the effects of automation on wages can be studied by tracing its impact on task shares.
The Effects of Technology
To understand the distinct effects of automation, it is useful to first contrast them with those of other technologies:
▪ Factor-augmenting technologies: represented by higher  or
or  . Factor-augmenting technologies have been the focus of much of the macro and labor literatures. They are qualitatively different from automation technologies and arguably a significant abstraction, since there are no examples of technologies that increase factor productivity in all or even most tasks.
 for
for  in the case of labor or in
  for
for  in the case of capital. For example, we may have improvements in the tools used by workers to perform one of their tasks (think of GPS making drivers better at navigation), or upgrades in capital equipment used to produce the same task. Formally, we consider infinitesimal increases in
  for
for  , and define the direct effect of these changes on group g's task share as
 (4)
(4) is defined similarly for capital.
▪ Automation and offshoring: automation corresponds to increases in the productivity of capital (or reductions in the cost of producing this type of capital) at tasks previously assigned to labor and leads to the displacement of workers from these tasks. Examples of automation technologies include numerical control machinery or industrial robots taking over tasks from blue-collar workers or the introduction of specialized software automating various back-office and clerical tasks. Offshoring also leads to the displacement of workers and can be incorporated into this framework by assuming that tasks can be performed abroad and imported in exchange of  units of the final good (see also Grossman and Rossi-Hansberg (2008)).
 (previously performed by workers of group g) such that capital now outperforms labor in these tasks. We define two objects that summarize the effects of automation. The first is the (direct) task displacement experienced by g:
 (5)
(5)
 denotes the cost reduction from automating task
  .9
.9  is also a function of the underlying technology (capital productivity in the tasks in
  after the change in technology).
Figure 2 depicts the effects of productivity deepening and automation on the allocation of tasks to factors. The direct effects in equations (4) and (5) are shown with the shaded areas (corresponding to the tasks where the productivity of capital or labor increased), while the induced ripple effects, which alter task shares of worker groups that are not themselves directly impacted by new technologies, are depicted with the dashed curves.

The direct effects of technology and ripple effects. The left panel shows the effects of an increase of  in the productivity of group g in tasks in
  . The right panel depicts the effects of automation technologies that reduce the task share of worker g by
  .
.
We now characterize the implications of these technologies, while abstracting from ripple effects, which allows us to illustrate their direct impacts and derive a simple estimating equation. The following assumption rules out ripple effects and is maintained until Section 5, where we characterize and estimate the full general equilibrium effects of automation on the wage structure:
Assumption 1.
- 1. Workers can only produce non-overlapping sets of tasks (i.e.,
 only if
  for all
  ).
). - 2.
 and
and  for all
  , where the constants
  and
and  are defined such that, in this case,
  .
.
The first part of the assumption imposes that each task can be performed by at most one type of labor, which ensures that a group displaced from the tasks it specializes in cannot in turn displace other workers from their tasks. The second part imposes that capital productivity is high enough and the cost of capital is low enough that all tasks in the set  , where capital has positive productivity, will be allocated to capital, that is,
  (see Appendix B-1 for details and a derivation of these thresholds).
The next proposition characterizes the implications of these technologies for wages, TFP, and output in terms of their direct effects on task shares and cost savings from automation.
Proposition 2. (Technology Comparative Statics)Consider a change in technology (such as factor-augmenting, productivity-deepening, and automation). The impact on real wages, TFP, output, and the capital share are
 (6)
(6) (7)
(7) (8)
(8) (9)
(9) ,
,  , and
, and  is the share of group g in GDP.
Let us first consider factor-augmenting and productivity-deepening technologies that make workers (or capital) more productive at their current tasks. With no ripple effects, factor-augmenting and productivity-deepening technologies have identical implications, summarized by the terms  and
and  . Equation (6) gives their impact on the wage structure. The real wage of group g increases due to productivity gains, represented by the expansion of output, dlny. These technologies further affect relative wages through the term
  , whose sign depends on whether the elasticity of substitution between type g labor and other factors, λ, is greater than or less than 1.10 This ambiguous impact is rooted in the fact that technologies that make workers from group g more productive simultaneously lower the price of the tasks these workers produce. When
  , the first effect dominates, and technologies making a group of workers more productive will raise their relative wages. This is the standard mechanism emphasized in the SBTC literature (e.g., Katz and Murphy (1992)). Technologies increasing the productivity of group g raise the wage of all other workers (and technologies increasing the productivity of capital at its current tasks raise all wages). This is the reason theories that emphasize skill-biased technologies or capital-skill complementarities have a hard time accounting for the stagnant or decreasing wages of unskilled workers (see Acemoglu and Autor (2011)).
The impact of factor-augmenting and productivity-deepening technologies on TFP can be computed from (8) as 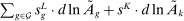 . This formula, which follows from Hulten's theorem, has a simple envelope logic: a 1% increase in the productivity of all workers in group g leads to an increase in TFP of
  . Likewise, a 1% increase in the productivity of capital at all tasks leads to an increase in TFP of
  . Relative to their modest effects on the wage structure (especially for values of λ close to 1), these technologies have large productivity effects. If factor-augmenting and productivity-deepening technologies were at the root of changes in the wage structure, we should see sizable TFP gains.

 . This negative displacement effect is the defining feature of automation technologies.
The implications of automation for TFP and factor shares are distinct from those of other technologies as well. The change in TFP is now  . If cost savings from automation,
  , are modest, automation could have a sizable impact on the wage structure via task displacement and still bring only small aggregate productivity gains. In this case, the displacement effect can outweigh the productivity effect and the real wage for displaced groups can decline, as we will see in our general equilibrium analysis.
Equation (9) also shows that automation always increases the capital share and reduces the labor share of value added—an observation that will be at the core of our measurement approach, in Section 2.4. This, too, is in stark contrast to what one would get from factor-augmenting and productivity-deepening technologies, whose impact on factor shares depends on whether  .
.
2.2 Full Model: Multiple Sectors
 . Output in industry i is produced by combining the tasks in some set
  , with measure
  , using a CES aggregator with elasticity
  :
:

 is a Hicks-neutral productivity term.
  denotes the set of tasks in industry i allocated to workers of type g, and
  denotes those allocated to capital. We define industry-level task shares,
  and
and  , as:
, as:

We assume that industry outputs are combined into a single final good (aggregate output) using a constant returns to scale aggregator,  . In the text, we work with the implied expenditure shares,
  , where
  is the vector of industry prices.11
The next proposition generalizes Proposition 1 to this environment and characterizes the equilibrium in terms of task shares. As before, we denote the direct impacts of productivity deepening and automation on task shares in industry i by  and
and  , respectively.
Proposition 3. (Equilibrium in multi-sector economy)There is a unique equilibrium. In this equilibrium, output, wages, and industry prices can be expressed as functions of task shares defined implicitly by the solution to the system of equations:
 (10)
(10) (11)
(11) (12)
(12)The proposition shows that task shares, the  's and
  's, continue to be key determinants of real wages, and we can express the equilibrium of the economy as a function of task shares, though we no longer have a closed-form solution for output. In addition, the impact of automation technologies on equilibrium outcomes again works via their influence on task shares.
2.3 Wage Equation Without Ripple Effects
 (13)
(13) ,
,  , and
, and  denotes the share of group g's income earned in industry i, so that
  .
.Equation (13) generalizes (6) to a multi-sector economy. As before, a common productivity effect increases wages. In the presence of multiple sectors, wages additionally depend on changes in industry composition that take place in response to technological shifts. The implications of these industry changes are captured by workers' exposure to industry shifters,  (the second term). Most centrally, group g's wage again depends on its direct task displacement—the automation-induced displacement it experiences, but now summed across all industries.
Equation (13) summarizes the key empirical prediction of our model: groups experiencing greater (automation-driven) task displacement should see relative wage declines. In what follows, we use this equation, which focuses on the direct effects of automation, as the basis for our reduced-form analysis. Our general equilibrium exploration in Section 5 will allow for additional ripple effects and will incorporate the wage impacts of productivity increases and induced changes in industry composition.
2.4 Mapping the Model to Data and Measuring Task Displacement
Our reduced-form analysis estimates an empirical analogue of equation (13), relating wage changes of different worker groups to their task displacement. In this equation:
▪ The common expansion of output, dlny, will be absorbed by the constant term.
▪ The industry shifters term  will be parameterized by group g's exposure to changes in industry (log) value added shares.
 , which incorporates factor-augmenting and productivity-deepening technologies, will be parameterized as in the SBTC literature. In particular, we assume that these technologies augment skills associated with education and gender, and impose

 is an additional unobserved component, and
  and
and  will be absorbed by dummies for education levels and gender. As a further refinement, we allow group-specific shifters to also depend on baseline group wages, which can be thought to proxy for skills.
▪ Finally, the key explanatory variable is our measure of direct task displacement driven by advances in automation technologies,  .
.
We use two complementary strategies to measure automation-driven task displacement, both of which rely on an initial observation: displacement takes place in tasks that can be automated, which we proxy with routine tasks.12 Formally, we impose:
Assumption 2.Only routine tasks can be automated and, within an industry, different groups of workers are displaced from their routine tasks at a common rate.
 , which yields measures that are more transparent and easier to interpret. Appendix A-3 of the Supplemental Material shows that when
  and Assumptions 1 and 2 hold, (direct) task displacement can be measured as
 (14)
(14) , is the share of wages earned by group g workers in industry i (relative to their total earnings) and captures this group's exposure to industry i; (2) the second term,
  , parameterizes the specialization of group g in routine jobs within industry i, which are the ones directly impacted by automation. This term is computed as the share of wages earned in routine jobs in industry i by workers in group g (relative to their total earnings in that industry),
  , divided by the share of wages earned in routine jobs by all workers in industry i (relative to the total wage bill of the industry),
  ; (3) the (percent) decline in industry i's labor share driven by automation,
  . The automation-driven labor share decline quantifies the direct losses of routine tasks experienced by workers in an industry.
Our two measures of task displacement differ in how they treat this last term. Our first and simpler strategy assumes that the observed decline in the labor share of an industry,  , can be entirely attributed to automation. This strategy is valid when
  (so that factor prices do not affect the labor share), there are no changes in markups, and there are no other influences on industry wages (such as changes in worker rents). We explore later the role of these factors and provide alternative measures of task displacement that adjust for each of them.
Our second and preferred approach uses data on the adoption of automation technologies at the industry level to isolate automation-driven declines in industry labor shares. Specifically, we estimate  as the predicted change in the (log) labor share of an industry based on its adoption of automation technologies (and offshoring).
We present results using both strategies throughout the paper. Our preference for the second strategy is rooted in the fact that it exploits actual measures of automation, such as adoption of industrial robots, dedicated machinery, and specialized software. It also allows us to estimate the extent of task displacement generated by automation and offshoring. In our robustness checks and general equilibrium analysis, we use more general measures of task displacement that are valid when  and Assumption 1 is relaxed.
3 Data, Measurement, and Descriptive Patterns
In this section, we describe our data sources and measures of task displacement, and provide a first look at the relationship between task displacement and real wage changes.
3.1 Main Data Sources
We use data from the BEA Integrated Industry-Level Production Accounts on industry labor shares, factor prices, and value added for 49 industries from 1987 to 2016.13 We complement these data with three industry-level proxies for adoption of automation technologies. These are: (1) change in the value of dedicated machinery services in value added between 1987 and 2016; (2) change in the value of specialized software services in value added between 1987 and 2016;14 (3) the adjusted penetration of robots from 1993 to 2014, which measures robot adoption driven by international advances in technology (from Acemoglu and Restrepo (2020)). We regress changes in industry (log) labor shares between 1987 and 2016 on these three proxies for automation technologies and compute the automation-driven decline in the labor share as the predicted value in this regression.15 In addition, we look at a measure of changes in intermediate imports to proxy for offshoring (from Feenstra and Hanson (1999)). Finally, to control for other trends affecting industries, we use data on total capital to value added ratio and industry TFP, sales concentration, estimates of markups, unionization rates, and measures of Chinese import competition (from Autor, Dorn, and Hanson (2013)).
On the worker side, we use Census and American Community Survey (ACS) data to trace the labor market outcomes of 500 demographic groups defined by gender, education (less than high school, high-school graduate, some college, college degree, and post-graduate degree), age (using 10-year age bins, from 16–25 years to 56–65), race/ethnicity (White, Black, Asian, Hispanic, Other), and native versus foreign-born. For each demographic group, we measure real hourly wages and other labor market outcomes in 1980 (using the 1980 U.S. Census) and in 2016 (pooling data from the 2014–2018 ACS), and compute the change in real wages, employment, and non-participation rates between 1980 and 2016. In Section 4.6, we zero in on variation in labor market outcomes for demographic groups across U.S. regions and commuting zones.
3.2 Changes in Industry Labor Shares and Automation
Figure 3 depicts the industry-level variation in labor share declines (the basis of our first measure of task displacement, shown with the light gray/blue bars) and the component of the labor share decline driven by automation technologies (a summary measure of overall automation in the industry and the basis of our preferred task displacement variable, shown with the dark gray/orange bars) from 1987 to 2016.16 The figure reveals considerable variation in industry labor share changes, with the largest declines taking place in mining, chemical products, petroleum, primary metals, motor vehicles, computers and electronics, computer services, and legal services. There is also a strong correlation between the light gray (blue) and the dark gray (orange) bars, indicating that industries with the largest labor share declines are those that have been at the forefront of automation technology adoption. Industries most affected by automation are consequently similar to those listed above and include motor vehicles, primary metals, computers and electronics, computer services, plastic and rubber products, and legal services.17

Percent decline in industry labor shares (in light gray/blue) and automation-driven labor share declines (in dark gray/orange), 1987–2016. See text for variable definitions.
Figure 4 illustrates the relationship between automation and industry labor share changes. Panel A depicts a strong negative association between labor share changes and adjusted penetration of robots ( ). Panel B shows this association for the combined change in specialized software and dedicated machinery services (
 ). Panel C presents the relationship between observed labor share changes and the predicted labor share decline based on our three proxies of automation, which together account for 45% of the variation in industry labor share changes. Table A-I in the Supplemental Material further explores this relationship. It shows that offshoring matters for the labor share decline as well, but accounts for only 2% of the variation across industries.

Relationship between automation technologies and changes in industry labor shares. See text for variable definitions. The five industries with the highest and the five industries with the lowest changes in their labor shares are identified in the figures.
Table A-I also confirms that the inclusion of changes in total capital to value added ratio, sales concentration, markups, import competition, and unionization rates does not change the correlation between our proxies of automation and industry labor share changes. In fact, conditional on our proxies of automation, these variables do not have a sizable or statistically significant effect on industry's labor shares. Note also that changes in total capital to value added ratio are a “bad control,” since our proxies of automation all contribute to the capital stock. Nevertheless, the fact that this variable has no discernible effect on our results suggests that specialized software, dedicated equipment, and industrial robots capture types of capital that lead to sizable declines in labor shares, presumably because they are used for automation, while other forms of capital are not.
3.3 Task Displacement and Wages Across Demographic Groups
We compute (direct) task displacement for our 500 demographic groups using equation (14). Specialization patterns across industries and routine jobs, the ω terms, are computed from the 1980 Census—a year that predates major advances in automation technologies—while  corresponds to the 1987–2016 change in industry labor share or its component driven by automation technologies, as described in the previous subsection.18
Figure 5 presents our two measures of task displacement for the 500 groups of workers. Panel A shows that these two measures—one computed from changes in the labor share on the horizontal axis, and the other exploiting the component driven by automation on the vertical axis—are strongly correlated ( ). This figure also reveals sizable differences in task displacement across demographic groups, using either measure: some demographic groups experienced a 25% direct reduction due to automation between 1980 and 2016, while others saw no change in their task shares.

Direct task displacement measures for the 500 demographic groups in our sample. The left panel shows a scatter plot between our two task displacement measures. The first, computed from observed labor share declines, is on the horizontal axis, while the second, computed from automation-driven labor share declines, is on the vertical axis. The 45○ degree line is shown in black. The right panel plots our measure of task displacement computed from automation-driven labor share declines against the baseline hourly wages of groups in 1980. Marker sizes indicate the share of hours worked by each group and shades of gray (different colors) indicate education levels. See text for variable definitions.
Panel B plots our measure of task displacement based on automation-driven labor share declines for all groups sorted by their baseline wage in 1980. We see that (direct) task displacement has been particularly high during this period for groups in the middle of the wage distribution—thus playing both an unequalizing and a polarizing role.
Figure 6 provides a first glimpse of the association between (direct) task displacement and real wage changes across demographic groups. The top two panels plot the bivariate relationship between our two task displacement measures and real wage changes from 1980 to 2016. These plots reveal a strong correlation between task displacement and changes in real wages, with groups experiencing the highest levels of task displacement seeing their real wages fall or stagnate. The bottom two panels display a simple falsification exercise. They demonstrate that the relationships depicted in the top two panels are not driven by secular trends adversely affecting some groups and are not present between 1950 and 1980—a period that predates major advances in automation. Rather, all demographic groups, including those that experienced adverse task displacement after 1980, enjoyed robust real wage growth, of about 50%, between 1950 and 1980.

Reduced-form relationship between task displacement and changes in real hourly wages. Panel A plots changes in real hourly wages for 1980–2016 against our task displacement measure computed from observed labor share declines. The slope of the regression line is −1.6 (standard error = 0.09). Panel B plots changes in real wages for 1980–2016 against our task displacement measure computed from automation-driven labor share declines for 1980–2016. The slope of the regression line is −1.65 (standard error = 0.10). Panels C and D plot pre-trends (changes in real hourly wages for 1950–1980) against our two task displacement measures for 1980–2016. The slopes of the regression lines in both Panels C and D are −0.28 (standard error = 0.28). Marker sizes indicate the share of hours worked by each group and shades of gray (different colors) indicate education levels. See text for variable definitions.
Both figures identify different education levels, highlighting that task displacement has been much higher for workers without a college degree. Consequently, workers without college have much lower, and in some cases negative, real wage changes. The relationship between task displacement and real wage changes is not just between education groups, however: a negative association between changes in wages and task displacement within education groups is visible from this figure as well.
Table A-II in the Supplemental Material provides descriptive statistics for the 500 demographic groups in our analysis and further corroborates these patterns. For example, it shows that workers in the top quintile of the (direct) task displacement distribution saw their real wage decline by 12%, while workers in the least exposed groups enjoyed real wage growth of about 26%.
4 Reduced-Form Evidence of the Effects of Task Displacement
This section presents our main reduced-form results. It highlights how automation-induced task displacement explains a large fraction of the changes in the U.S. wage structure between 1980 and 2016.
4.1 Baseline Results
 (15)
(15) denotes the log change in real hourly wages for workers in group g between 1980 and 2016. The error term
  represents residual group-specific changes in supply or demand. As in all of our other results, regressions are weighted by total hours worked by each group and standard errors are robust to heteroskedasticity.
|
Dependent Variables: |
||||
|---|---|---|---|---|
|
Change in Hourly Wages, 1980–2016 |
||||
|
(1) |
(2) |
(3) |
(4) |
|
|
Panel A. Task displacement based on labor share declines |
||||
|
Task displacement |
−1.60 |
−1.32 |
−1.31 |
−1.66 |
|
(0.09) |
(0.16) |
(0.19) |
(0.44) |
|
|
Industry shifters |
0.21 |
0.31 |
0.35 |
|
|
(0.09) |
(0.12) |
(0.16) |
||
|
Exposure to industry labor share decline |
0.18 |
|||
|
(0.66) |
||||
|
Relative specialization in routine jobs |
0.07 |
|||
|
(0.07) |
||||
|
Share variance explained by task displacement |
0.67 |
0.55 |
0.55 |
0.70 |
|
R-squared |
0.67 |
0.70 |
0.84 |
0.84 |
|
Observations |
500 |
500 |
500 |
500 |
|
Panel B. Task displacement based on automation-driven labor share declines |
||||
|
Task displacement |
−1.65 |
−1.41 |
−1.36 |
−1.86 |
|
(0.10) |
(0.20) |
(0.21) |
(0.47) |
|
|
Industry shifters |
0.15 |
0.10 |
0.20 |
|
|
(0.11) |
(0.14) |
(0.16) |
||
|
Exposure to industry labor share decline |
−0.68 |
|||
|
(0.80) |
||||
|
Relative specialization in routine jobs |
0.10 |
|||
|
(0.08) |
||||
|
Share variance explained by task displacement |
0.64 |
0.55 |
0.53 |
0.72 |
|
R-squared |
0.64 |
0.66 |
0.83 |
0.83 |
|
Observations |
500 |
500 |
500 |
500 |
|
Other covariates: |
||||
|
Manufacturing share, education and gender dummies |
✓ |
✓ |
||
- Note: This table presents estimates of the relationship between task displacement and the change in hourly wages across 500 demographic groups, defined by gender, education, age, race, and native/immigrant status. The dependent variable is the change in hourly wages for each group between 1980 and 2016. Panel A reports results for our measure of task displacement based on observed labor share declines. Panel B reports results for our measure of task displacement based on automation-driven labor share declines. In addition to the covariates reported in the table, columns 3 and 4 control for baseline wage shares in manufacturing and dummies for education (for no high-school degree, completed high school, some college, college degree, and post-graduate degree) and gender. All regressions are weighted by total hours worked by each group in 1980. Standard errors robust to heteroskedasticity are reported in parentheses.
Our identifying assumption is that the two (direct) task displacement measures are uncorrelated with other trends affecting wages—except through automation-driven task displacement.
Panel A of the table presents results with our first measure of task displacement, constructed from observed declines in industry labor shares. Panel B presents results with our second, preferred measure of task displacement, which focuses on the component of the labor share declines driven by automation technologies.
Column 1 presents a bivariate regression identical to the one shown in Figure 6. In Panel A, we see a precise and sizable relationship between task displacement and wage growth, with a coefficient of −1.6 (s.e. = 0.09). This estimate implies that a 25% increase in task displacement—which corresponds to the displacement experienced by white American men aged 26–35 with no high-school degree—is associated with a 40% (relative) wage decline. The bottom rows report the share of wage changes explained by task displacement.19 Our measure of task displacement alone explains 67% of the variation in wage changes between 1980 and 2016.
The remaining columns document that this bivariate relationship is robust. Column 2 controls for industry shifters, which absorb labor demand changes coming from the expansion of industries in which a demographic group specializes. The coefficient estimate for task displacement is similar to the one in column 1, −1.32 (s.e. = 0.16). Column 3, which we take as our baseline specification for the rest of the paper, controls for gender and education dummies and a group's share of earnings in manufacturing. These account for other demand factors favoring highly-educated workers and for the effects of the secular decline of manufacturing. The coefficient estimate remains very similar to column 2, −1.31 (s.e. = 0.19). Even after the inclusion of these controls, task displacement continues to explain 55% of the variation in wage changes during this period.
Our first task displacement measure in Panel A combines industry-level changes in labor shares with the distribution of employment of workers across industries and (routine and non-routine) occupations. Column 4 includes two more variables, corresponding to the constituent parts making up our task displacement measure. The first is the exposure of a demographic group to industry-level declines in the labor share, but without focusing on whether employment is in routine tasks in that industry. The second is a group's relative specialization in routine jobs, but this time without exploiting industry-level changes in task displacement.20 Column 4 shows that these two variables themselves do not explain real wage changes (conditional on task displacement), while task displacement remains very strongly correlated with wage changes. This result confirms that our measure of task displacement is not confounded by other industry-level changes impacting labor shares and wages or by other trends affecting workers specializing in routine tasks. Rather, it is demographic groups specializing in routine tasks in industries undergoing sizable labor share declines that suffer relative wage declines. The lack of a negative impact on groups specializing in non-routine tasks also confirms that our results are not driven by a mechanical association between changes in the average wages paid in an industry and changes in its labor share.
Panel B presents results using our preferred measure of task displacement based on the component of the labor share decline driven by automation technologies. The estimates of the effects of task displacement and the shares of variance explained by this variable are, in all cases, very similar to those in Panel A. In column 3, for example, the coefficient estimate of task displacement is −1.36 (standard error = 0.21), compared to −1.31 in the same specification in Panel A. The share of wage structure changes explained by task displacement in this column is also similar: 53%, compared to 55% in Panel A.21
Overall, our baseline results document a strong association between task displacement and real wage changes, and support our presumption that this association is capturing the (direct) causal effect of automation-driven task displacement experienced by a demographic group. We next bolster the case that this is indeed a causal relationship and is highly robust.
4.2 Instrumental-Variables Estimates
Our preferred measure of task displacement is based on the component of the industry labor share decline that is driven by our proxies of automation. A complementary approach entails using these proxies as instruments for our first measure of task displacement based on observed labor share declines. Table II pursues this approach and confirms that estimating equation (15) via two-stage least squares (2SLS) yields similar results.22
|
Dependent Variable: Change in Hourly Wages 1980–2016 |
|||||||
|---|---|---|---|---|---|---|---|
|
Instruments: |
Robot APR, Machinery, and Software |
Robot APR |
Dedicated Machinery |
Specialized Software |
Robot APR and Software |
Machinery and Software |
Offshoring |
|
(1) |
(2) |
(3) |
(4) |
(5) |
(6) |
(7) |
|
|
Panel A. 2SLS estimates instrumenting task displacement with our automation and offshoring proxies |
|||||||
|
Task displacement |
−1.23 |
−1.22 |
−0.83 |
−1.46 |
−1.33 |
−1.20 |
−0.81 |
|
(0.19) |
(0.25) |
(0.39) |
(0.36) |
(0.21) |
(0.18) |
(0.30) |
|
|
Share variance explained by task displacement |
0.50 |
0.39 |
0.17 |
0.22 |
0.52 |
0.49 |
0.12 |
|
R-squared |
0.84 |
0.84 |
0.83 |
0.84 |
0.84 |
0.84 |
0.82 |
|
First-stage F |
846.91 |
98.00 |
29.53 |
68.00 |
432.89 |
716.72 |
30.62 |
|
Overid p-value |
0.07 |
0.58 |
0.33 |
||||
|
Observations |
500 |
500 |
500 |
500 |
500 |
500 |
500 |
|
Panel B. 2SLS estimates controlling for industry and occupational specialization |
|||||||
|
Task displacement |
−1.56 |
−1.26 |
−0.08 |
−3.11 |
−2.06 |
−1.36 |
−2.49 |
|
(0.50) |
(0.83) |
(0.97) |
(1.12) |
(0.56) |
(0.49) |
(0.71) |
|
|
Exposure to industry labor share decline |
0.54 |
0.30 |
−1.91 |
−1.19 |
0.15 |
0.30 |
0.06 |
|
(0.76) |
(0.91) |
(1.57) |
(1.63) |
(0.85) |
(0.77) |
(0.96) |
|
|
Relative specialization in routine jobs |
0.06 |
0.01 |
−0.18 |
0.29 |
0.13 |
0.03 |
0.20 |
|
(0.09) |
(0.14) |
(0.17) |
(0.17) |
(0.09) |
(0.09) |
(0.11) |
|
|
Share variance explained by task displacement |
0.63 |
0.41 |
0.02 |
0.47 |
0.80 |
0.55 |
0.37 |
|
R-squared |
0.84 |
0.83 |
0.82 |
0.76 |
0.84 |
0.84 |
0.83 |
|
First-stage F |
170.40 |
6.32 |
30.15 |
3.87 |
26.12 |
190.09 |
23.71 |
|
Observations |
500 |
500 |
500 |
500 |
500 |
500 |
500 |
-
Note: This table presents 2SLS estimates of the relationship between task displacement and changes in hourly wages for 500 demographic groups, defined by gender, education, age, race, and native/immigrant status. The dependent variable is the change in hourly wages for each group between 1980 and 2016. Panel A reports 2SLS estimates using our measures of automation and offshoring to instrument for our measure of task displacement based on observed labor share declines. Formally, we use instruments of the form
 , where our proxy is either the adjusted penetration of robots, our measures of changes in dedicated machinery and specialized software services, or our measure of offshoring. Panel B provides 2SLS estimates where we also control for relative specialization in routine jobs and exposure to industry labor share declines (this last term instrumented also using our proxies for technology and offshoring). Formally, the models in this panel also use instruments of the form
  . In addition to the covariates reported in the table, all specifications control for industry shifters, group's baseline wage share in manufacturing, and dummies for education (for no high-school degree, completed high school, some college, college degree, and post-graduate degree) and gender. All regressions are weighted by total hours worked by each group in 1980. Standard errors robust to heteroskedasticity are reported in parentheses.
Panel A presents 2SLS estimates for a specification analogous to column 3 of Table I. Column 1 uses all three of our proxies as instruments. The first-stage F-statistic is very high (846.9). The 2SLS estimate for the effect of task displacement, −1.23 ( ), and the implied share of variance of wage changes explained by task displacement, 50%, are similar to those in column 3 of Table I, obtained by directly using our second measure of task displacement.
The remaining columns explore the contribution of each of the proxies of automation. Column 2 uses the adjusted penetration of robots by itself. Columns 3 and 4 focus on dedicated machinery and specialized software as proxies for automation. Columns 5 and 6 include the software measure together with each one of the other two proxies for automation. The 2SLS estimates are similar across columns 1–6 and the hypothesis that they are all equal cannot be rejected. This finding is consistent with our exclusion restriction that the effects of these technologies operate through task displacement.
Finally, in column 7, we turn to offshoring—measured as the change in the share of imported intermediates in an industry. As expected, offshoring also contributes to task displacement and depresses real wages of exposed groups, but it only explains 12% of the variation in wage changes.
Panel B of the table presents estimates corresponding to the specification in column 4 of Table I (thus also controlling for exposure to industry labor share declines, instrumented by our automation proxies, and for relative specialization in routine jobs). The results in this panel are similar, though less precise in some specifications (such as in columns 2 and 3 where we use, respectively, the adjusted penetration of robots and dedicated machinery as the only instruments).
In what follows, we focus on estimates using our measure of task displacement based on automation-driven labor share declines, as in Panel B of Table I, rather than the 2SLS models presented in this subsection.
4.3 Task Displacement versus SBTC
How important is task displacement relative to other forms of SBTC? Table III explores this question by considering different specifications of SBTC. The first column of this table regresses wage changes on a full set of dummies for gender and education levels, but excludes our task displacement measure. As explained in Section 2.4, these controls absorb any factor-augmenting productivity trends common to all workers with the same education level or gender. Column 1 shows that these SBTC variables are significant and have the expected signs. For example, between 1980 and 2016, the relative wage of workers with a college (but no post-graduate) degree increased by 25% relative to those with a high-school degree, and the relative wage of workers with a post-graduate degree increased by 42% relative to high-school graduates. In this model, education dummies explain 55% of the variation in wage changes during this period.
|
Dependent Variable: Change in Hourly Wages 1980–2016 |
||||||
|---|---|---|---|---|---|---|
|
SBTC by Education Level and Gender |
SBTC by Wage Level |
|||||
|
Task Displacement Measure |
Labor Share Declines |
Automation-Driven Declines |
Labor Share Declines |
Automation-Driven Declines |
||
|
(1) |
(2) |
(3) |
(4) |
(5) |
(6) |
|
|
Gender: women |
0.17 |
0.10 |
0.13 |
0.25 |
0.15 |
0.17 |
|
(0.02) |
(0.02) |
(0.02) |
(0.02) |
(0.03) |
(0.03) |
|
|
Education: no high school |
0.02 |
0.02 |
0.03 |
0.05 |
0.04 |
0.05 |
|
(0.02) |
(0.02) |
(0.02) |
(0.02) |
(0.02) |
(0.02) |
|
|
Education: some college |
0.05 |
−0.07 |
−0.05 |
0.03 |
−0.06 |
−0.03 |
|
(0.03) |
(0.03) |
(0.03) |
(0.02) |
(0.03) |
(0.03) |
|
|
Education: full college |
0.25 |
−0.02 |
0.03 |
0.18 |
0.01 |
0.05 |
|
(0.04) |
(0.05) |
(0.05) |
(0.04) |
(0.05) |
(0.05) |
|
|
Education: more than college |
0.42 |
0.08 |
0.15 |
0.29 |
0.09 |
0.16 |
|
(0.05) |
(0.06) |
(0.06) |
(0.05) |
(0.06) |
(0.06) |
|
|
Log of hourly wage in 1980 |
0.23 |
0.12 |
0.11 |
|||
|
(0.05) |
(0.04) |
(0.05) |
||||
|
Task displacement |
−1.31 |
−1.36 |
−1.03 |
−1.01 |
||
|
(0.19) |
(0.21) |
(0.18) |
(0.24) |
|||
|
Share variance explained by: |
||||||
|
—educational dummies |
0.55 |
0.08 |
0.17 |
0.37 |
0.09 |
0.18 |
|
—baseline wage |
0.15 |
0.07 |
0.07 |
|||
|
—task displacement |
0.55 |
0.53 |
0.43 |
0.39 |
||
|
R-squared |
0.76 |
0.84 |
0.83 |
0.81 |
0.85 |
0.83 |
|
Observations |
500 |
500 |
500 |
500 |
500 |
500 |
|
Other covariates: |
||||||
|
Industry shifters and manufacturing share |
✓ |
✓ |
✓ |
✓ |
✓ |
✓ |
- Note: This table presents estimates of the relationship between SBTC proxies, task displacement, and the change in hourly wages across 500 demographic groups. These groups are defined by gender, education, age, race, and native/immigrant status. The dependent variable is the change in hourly wages for each group between 1980 and 2016. Columns 2 and 5 report results using our measure of task displacement based on observed labor share declines. Columns 3 and 6 report results using our measure of task displacement based on automation-driven labor share declines. In addition to the covariates reported in the table, all specifications control for industry shifters and baseline wage shares in manufacturing. The bottom rows of the table report the share of variance explained by task displacement and the different proxies of skill-biased technical change. All regressions are weighted by total hours worked by each group in 1980. Standard errors robust to heteroskedasticity are reported in parentheses.
However, most of the differences between workers with different education levels disappear once our task displacement measures are included in columns 2 and 3 (these models are identical to column 3 in Panels A and B of Table I). Notably, there is no longer any differential wage growth for workers with a college degree relative to those with a high-school degree. Likewise, task displacement explains, respectively, 80% and 65% of the rise in the post-graduate premium with our two measures. Task displacement also explains more than 50% of the overall changes in the wage structure, while the education dummies explain less than 17%. In addition, task displacement accounts for 4–7 percentage points of the 17% decline in the gender wage premium during this period. These results are the basis for our claim that much of the change in the U.S. wage structure between 1980 and 2016 is due to task displacement, with a minor role for standard (factor-augmenting) SBTC.
The next three columns go one step further and allow for differential trends that depend on the baseline wage level of each demographic group, which could proxy for dimensions of group skills that go beyond education and gender. The results of these demanding specifications are similar to those in the first three columns, and our task displacement measure explains about 40% of the observed wage changes, while differential trends by education and baseline wages explain, respectively, 18% and 7% of the variation.
In Table A-III in the Supplemental Material, we also control for the differential evolution of the supply (population size) of different demographic groups, which is the equivalent of the relative supply controls in Katz and Murphy (1992) and Card and Lemieux (2001). The inclusion of these controls raises the explanatory power of our task displacement measure (because demographic shifts have gone in favor of groups experiencing task displacement). Now, task displacement explains 63%–72% of the changes in the U.S. wage structure, while the education dummies continue to explain a small portion (4%–18%) of the variation.
In summary, our results show that task displacement has been at the root of the changes in the wage structure from 1980 to today, while other forms of SBTC had limited explanatory power.
4.4 Employment Outcomes
If task displacement leads to lower labor demand for a demographic group, we should see an impact not just on its wage but on its employment as well.23 Table IV presents results for the employment to population ratio in the top panel and non-participation rate in the bottom panel.
|
Dependent Variable: Labor Market Outcomes 1980–2016 |
||||||
|---|---|---|---|---|---|---|
|
Task Displacement Based on Labor Share Declines |
Task Displacement Based on Automation-Driven Labor Share Declines |
|||||
|
(1) |
(2) |
(3) |
(4) |
(5) |
(6) |
|
|
Panel A. Employment to population ratio |
||||||
|
Task displacement |
−0.68 |
−0.46 |
−0.78 |
−0.75 |
−0.44 |
−0.82 |
|
(0.11) |
(0.14) |
(0.32) |
(0.11) |
(0.16) |
(0.39) |
|
|
Share variance explained by: |
||||||
|
—task displacement |
0.31 |
0.21 |
0.36 |
0.35 |
0.20 |
0.38 |
|
—educational dummies |
0.10 |
0.12 |
0.15 |
0.15 |
||
|
R-squared |
0.31 |
0.77 |
0.78 |
0.35 |
0.77 |
0.78 |
|
Observations |
500 |
500 |
500 |
500 |
500 |
500 |
|
Panel B. Non-participation rate |
||||||
|
Task displacement |
0.67 |
0.37 |
0.77 |
0.75 |
0.35 |
0.80 |
|
(0.12) |
(0.14) |
(0.31) |
(0.12) |
(0.16) |
(0.39) |
|
|
Share variance explained by: |
||||||
|
—task displacement |
0.30 |
0.17 |
0.34 |
0.33 |
0.16 |
0.36 |
|
—educational dummies |
0.16 |
0.19 |
0.21 |
0.22 |
||
|
R-squared |
0.30 |
0.80 |
0.81 |
0.33 |
0.80 |
0.81 |
|
Observations |
500 |
500 |
500 |
500 |
500 |
500 |
|
Covariates: |
||||||
|
Industry shifters, manufacturing share, education, and gender dummies |
✓ |
✓ |
✓ |
✓ |
||
|
Exposure to labor share declines and relative specialization in routine jobs |
✓ |
✓ |
||||
- Note: This table presents estimates of the relationship between task displacement and labor market outcomes for 500 demographic groups, defined by gender, education, age, race, and native/immigrant status. In Panel A, the dependent variable is the change in the employment to population ratio between 1980 and 2016. In Panel B, the dependent variable is the change in the non-participation rate between 1980 and 2016. Columns 1–3 report results using our measure of task displacement based on observed labor share declines. Columns 4–6 report results using our measure of task displacement based on automation-driven labor share declines. In addition to the covariates reported in the table, columns 2–3 and 5–6 control for industry shifters, baseline wage shares in manufacturing, and dummies for education (for no high-school degree, completed high school, some college, college degree, and post-graduate degree) and gender. Columns 3 and 6 control for relative specialization in routine jobs and groups' exposure to industry labor share declines. All regressions are weighted by total hours worked by each group in 1980. Standard errors robust to heteroskedasticity are reported in parentheses.
We find that task displacement is associated with lower employment to population ratios. The first three columns use the measure of task displacement based on industry labor share declines, while the next three columns rely on our preferred measure, exploiting the component of labor share declines driven by automation technologies. Panel B reveals that most of the adjustment takes place via non-participation. For example, using the estimates from column 5 based on our preferred measure, we see that a 10 percentage point higher task displacement is associated with a 4.4 percentage point decline in employment between 1980 and 2016, and a similar 3.5 percentage point increase in non-participation. Additionally, columns 3 and 6 in both panels confirm that the employment effects do not reflect adverse trends against all workers specialized in routine jobs or those employed in industries with declining labor shares. Rather, as with our wage results, they are driven by task displacement. Overall, our task displacement measure explains between 16% and 38% of changes in employment and participation between 1980 and 2016.24
4.5 Confounding Trends: Capital, TFP, Deunionization, Imports, and Markups
The main challenge in interpreting our reduced-form estimates as the causal effect of automation on relative wages is the possibility that labor share changes or their component driven by automation technologies are confounded by other industry-level trends. We directly confront these threats to identification in this subsection.
A first concern is that our task displacement measures may capture not just the effects of automation but of other investments or other types of technological change. We already saw in Table A-I that, conditional on our automation measures, changes in the total capital to value added ratio are not correlated with industry labor shares. Columns 1–2 and 5–6 in Panel A of Table V further explore the role of capital intensity and industry productivity by controlling for exposure to changes in industry capital to value added ratios and TFP growth. Consistent with our interpretation that wage inequality is shaped by task displacement, rather than overall capital intensity or productivity growth resulting from non-automation technologies, exposure to these industry variables has no direct impact on wages and does not alter the relationship between task displacement and wages.25 These results support our conceptual framework and identifying assumption.
|
Dependent Variable: Change in Hourly Wages 1980–2016 |
||||||||
|---|---|---|---|---|---|---|---|---|
|
Task Displacement Based on Labor Share Declines |
Task Displacement Based on Automation-Driven Labor Share Declines |
|||||||
|
Other shocks: |
Changes in |
Changes in TFP by Industry |
Change in Chinese Import Competition |
De-Unionization Rates |
Changes in |
Changes in TFP by Industry |
Change in Chinese Import Competition |
De-Unionization Rates |
|
(1) |
(2) |
(3) |
(4) |
(5) |
(6) |
(7) |
(8) |
|
|
Panel A. Controlling for main effect of other shocks |
||||||||
|
Task displacement |
−1.31 |
−1.31 |
−1.26 |
−1.31 |
−1.36 |
−1.38 |
−1.28 |
−1.32 |
|
(0.17) |
(0.19) |
(0.20) |
(0.22) |
(0.20) |
(0.22) |
(0.22) |
(0.23) |
|
|
Exposure to industry shock |
0.01 |
−0.04 |
0.01 |
0.02 |
0.01 |
−0.11 |
0.02 |
−1.08 |
|
(0.13) |
(0.37) |
(0.01) |
(0.84) |
(0.14) |
(0.37) |
(0.01) |
(0.77) |
|
|
Share variance explained by: |
||||||||
|
—task displacement |
0.55 |
0.55 |
0.53 |
0.55 |
0.53 |
0.54 |
0.50 |
0.51 |
|
—industry shock |
0.00 |
0.00 |
−0.01 |
−0.00 |
0.00 |
0.01 |
−0.02 |
0.16 |
|
R-squared |
0.84 |
0.84 |
0.84 |
0.84 |
0.83 |
0.83 |
0.83 |
0.83 |
|
Observations |
500 |
500 |
500 |
500 |
500 |
500 |
500 |
500 |
|
Panel B. Controlling for effects on workers in routine jobs |
||||||||
|
Task displacement |
−0.87 |
−1.30 |
−1.14 |
−1.64 |
−0.75 |
−1.46 |
−1.25 |
−2.20 |
|
(0.22) |
(0.21) |
(0.27) |
(0.45) |
(0.27) |
(0.26) |
(0.35) |
(0.67) |
|
|
Exposure to industry shock |
0.28 |
−0.02 |
0.03 |
−0.32 |
0.36 |
−0.27 |
0.03 |
−2.42 |
|
(0.18) |
(0.46) |
(0.03) |
(0.76) |
(0.18) |
(0.49) |
(0.03) |
(0.89) |
|
|
Exposure of routine jobs to industry shock |
−0.28 |
−0.03 |
−0.01 |
0.74 |
−0.37 |
0.15 |
−0.00 |
1.71 |
|
(0.15) |
(0.21) |
(0.02) |
(0.82) |
(0.15) |
(0.23) |
(0.02) |
(1.18) |
|
|
Share variance explained by: |
||||||||
|
—task displacement |
0.36 |
0.55 |
0.48 |
0.69 |
0.29 |
0.57 |
0.49 |
0.86 |
|
—industry shock |
0.12 |
0.01 |
0.02 |
−0.16 |
0.15 |
−0.02 |
−0.02 |
−0.11 |
|
R-squared |
0.84 |
0.84 |
0.84 |
0.84 |
0.84 |
0.83 |
0.83 |
0.83 |
|
Observations |
500 |
500 |
500 |
500 |
500 |
500 |
500 |
500 |
 Ratio by Industry
 Ratio by Industry
- Note: This table presents estimates of the relationship between task displacement and the change in hourly wages across 500 demographic groups controlling for trade in final goods, declining unionization rates, other forms of capital investments, and other technologies leading to productivity growth in an industry. These groups are defined by gender, education, age, race, and native/immigrant status. The dependent variable is the change in hourly wages for each group between 1980 and 2016. In Panel A, we control for the main effect of these shocks on workers in exposed industries. In Panel B, we allow these shocks to have a differential impact on workers in routine jobs in exposed industries. Columns 1–4 report results using our measure of task displacement based on observed labor share declines. Columns 5–8 report results using our measure of task displacement based on automation-driven labor share declines. In addition to the covariates reported in the table, all specifications control for industry shifters, baseline wage share in manufacturing, and dummies for education (for no high-school degree, completed high school, some college, college degree and post-graduate degree) and gender. All regressions are weighted by total hours worked by each group in 1980. Standard errors robust to heteroskedasticity are reported in parentheses.
In Appendix Table A-IV of the Supplemental Material, we adopt a complementary strategy to control for changes in capital intensity. We relax both Assumption 1 and  , so that the elasticity of substitution between capital and labor is no longer equal to 1. We then adjust our task displacement measures for changes in industry capital utilization and other movements in factor prices. The results of this exercise are similar to our baseline findings.26
Changes in worker bargaining power can also impact industry labor shares and worker wages. To investigate this issue, in columns 3 and 7, we include workers' exposure to industries with declining unionization rates, which may have reduced their rents, thus contributing both to labor share declines and changes in the wage structure. Finally, columns 4 and 8 include the exposure of different demographic groups to industries facing greater Chinese import competition. Although industry shifters already account for the effects of trade in final goods, this specification controls for other effects of trade with China, such as those working through changes in rent-sharing. With both controls, our task displacement measures have similar coefficients to the ones we saw in Table I and continue to explain about 50% of the changes in the U.S. wage structure. We find no evidence that declining unionization rates or Chinese import competition has a direct impact on the wage structure (beyond their potential effects working through changes in industry composition).
Panel B of the table shows similar results when we allow each of these industry shocks to have a differential impact on workers specializing in routine jobs. In all cases, the effects of task displacement on wages are largely unaffected.27
Another important concern centers on the role of changes in industry concentration and markups, which also impact industry labor shares and might directly affect the wage structure. Table VI explores the role of these factors. Columns 1 and 5 in Panel A control for workers' exposure to industries with rising sales concentration, and the other columns include their exposure to markup changes using three alternative estimates of industry markups. These are: markups computed from accounting data, markups estimated using the (inverse of the) material share, and markup estimates following the production function approach in De Loecker, Eeckhout Jan, and Unger (2020) (see Appendix B-3 for details).
|
Dependent Variable: Change in Hourly Wages 1980–2016 |
||||||||
|---|---|---|---|---|---|---|---|---|
|
Task Displacement Based on Labor Share Declines |
Task Displacement Based on Automation-Driven Labor Share Declines |
|||||||
|
Change in Sales Concentration |
Markups From Accounting Approach |
Markups From Materials Share |
Markups From DLEU (2020) |
Change in Sales Concentration |
Markups From Accounting Approach |
Markups From Materials Share |
Markups From DLEU (2020) |
|
|
(1) |
(2) |
(3) |
(4) |
(5) |
(6) |
(7) |
(8) |
|
|
Panel A. Controlling for main effect of markups and concentration |
||||||||
|
Task displacement |
−1.37 |
−1.31 |
−1.42 |
−1.31 |
−1.40 |
−1.34 |
−1.40 |
−1.37 |
|
(0.18) |
(0.20) |
(0.20) |
(0.18) |
(0.21) |
(0.22) |
(0.22) |
(0.21) |
|
|
Exposure to changes in markups or concentration |
1.87 |
0.26 |
−0.77 |
−0.67 |
1.40 |
−0.90 |
−0.34 |
−0.67 |
|
(1.43) |
(1.44) |
(0.43) |
(1.00) |
(1.50) |
(1.37) |
(0.43) |
(1.08) |
|
|
Share variance explained by: |
||||||||
|
—task displacement |
0.57 |
0.55 |
0.59 |
0.55 |
0.54 |
0.52 |
0.54 |
0.53 |
|
—markups/concetration |
0.04 |
−0.00 |
−0.07 |
0.01 |
0.03 |
0.01 |
−0.03 |
0.01 |
|
R-squared |
0.84 |
0.84 |
0.84 |
0.84 |
0.83 |
0.83 |
0.83 |
0.83 |
|
Observations |
500 |
500 |
500 |
500 |
500 |
500 |
500 |
500 |
|
Panel B. Net out markups from construction of task displacement |
||||||||
|
Task displacement |
−1.74 |
−1.71 |
−1.12 |
−1.32 |
−2.11 |
−2.11 |
−0.90 |
−1.31 |
|
(0.22) |
(0.24) |
(0.15) |
(0.16) |
(0.34) |
(0.33) |
(0.14) |
(0.20) |
|
|
Exposure to changes in markups or concentration |
0.69 |
−0.68 |
−2.09 |
−2.13 |
0.01 |
−1.71 |
−0.27 |
−0.49 |
|
(1.50) |
(1.40) |
(0.53) |
(0.75) |
(1.53) |
(1.35) |
(0.44) |
(1.12) |
|
|
Share variance explained by: |
||||||||
|
—task displacement |
0.57 |
0.56 |
0.54 |
0.50 |
0.48 |
0.48 |
0.52 |
0.53 |
|
—markups/concetration |
0.02 |
0.01 |
−0.19 |
0.03 |
0.00 |
0.03 |
−0.02 |
0.01 |
|
R-squared |
0.83 |
0.83 |
0.85 |
0.86 |
0.82 |
0.82 |
0.82 |
0.82 |
|
Observations |
500 |
500 |
500 |
500 |
500 |
500 |
500 |
500 |
- Note: This table presents estimates of the relationship between task displacement and the change in hourly wages across 500 demographic groups controlling for changes in market structure and markups. These groups are defined by gender, education, age, race, and native/immigrant status. The dependent variable is the change in hourly wages for each group between 1980 and 2016. In Panel A, we control for groups' specialization in industries with changes in market structure leading to higher markups. In column 1, we proxy changes in market structure by rising sales concentration in the industry. In columns 2–4, we directly control for changes in markups. These are computed as the ratio of revenue to costs in column 2, the inverse of the materials' share in gross output in column 3, and markups estimated using a production function approach as in De Loecker, Eeckhout Jan, and Unger (2020) in column 4. In Panel B, we also subtract the percent increase in markups from the percent decline in the labor share when computing our measure of task displacement (using the accounting markup in columns 1 and 5). Columns 1–4 report results using our measure of task displacement based on observed labor share declines (net of markups in Panel B). Columns 5–8 report results using our measure of task displacement based on automation-driven labor share declines (net of markups in Panel B). In addition to the covariates reported in the table, all specifications control for industry shifters, baseline wage shares in manufacturing, and dummies for education (for no high-school degree, completed high school, some college, college degree and post-graduate degree) and gender. All regressions are weighted by total hours worked by each group in 1980. Standard errors robust to heteroskedasticity are reported in parentheses.
In all specifications and with either measure of task displacement, our results are similar to the baseline estimates presented in Table I. For example, the effects of task displacement range between −1.31 and −1.42, while exposure to changes in concentration or markups have little explanatory power for wages.
Panel B goes one step further and uses a measure of task displacement that partials out the component of industry labor share changes driven by markups.28 This correction does not affect our conclusions, and our point estimates for the effects of task displacement remain sizable and precise. Even with this correction, markup changes do not have a robust effect on wages and explain no more than 3% of the variation in wage changes.
The findings in this table suggest that our task displacement variable is not picking up confounding effects of changes in markups or concentration. These results imply that task displacement—and not so much rising market power—has played a defining role in the surge in U.S. wage inequality over the last four decades.
Our baseline measure of task displacement equates jobs that can be automated with routine jobs, as defined in Acemoglu and Autor (2011). Table A-V in the Supplemental Material Appendix A reports analogous results when we use other measures of jobs that can be automated. The results are similar when we rely on the measure of automatable jobs constructed by Webb (2020) based on the text of new patents. Table A-VI controls for the exposure of workers to occupations in the bottom tercile of the overall wage distribution and the interaction between this exposure and industry automation. This has no effect on our task displacement results and these variables themselves are not significant. This robustness check confirms that task displacement is capturing the effects of automation on worker groups specializing in tasks that can be automated rather than on workers in low-pay occupations.
4.6 Regional Variation
Task and industry composition vary greatly across regions and commuting zones in the United States. To further test the association between task displacement and wages, we now investigate whether regional variation in task displacement also predicts changes in sub-national wage structures.
Table VII provides estimates that exploit regional differences in specialization patterns. The main difference is that now the unit of observation is given by group-region cells, and we exploit differences in specialization across these cells to construct our task displacement measures. In Panel A, we look at 300 demographic groups defined by gender, education, age, and race across nine U.S. regions (giving us a total of 2633 observations excluding empty cells). The results using both measures of task displacement are similar to those in Table I.
|
Dependent Variable: Change in Hourly wages 1980–2016 |
||||||
|---|---|---|---|---|---|---|
|
Task Displacement Based on Labor Share Declines |
Task Displacement Based on Automation-Driven Labor Share Declines |
|||||
|
(1) |
(2) |
(3) |
(4) |
(5) |
(6) |
|
|
Panel A. Variation across U.S. regions |
||||||
|
Task displacement |
−1.60 |
−1.07 |
−1.31 |
−1.66 |
−1.14 |
−1.41 |
|
(0.11) |
(0.12) |
(0.25) |
(0.11) |
(0.13) |
(0.29) |
|
|
R-squared |
0.62 |
0.81 |
0.82 |
0.61 |
0.81 |
0.82 |
|
Observations |
2633 |
2633 |
2633 |
2633 |
2633 |
2633 |
|
Panel B. Variation across U.S. regions absorbing national trends by group |
||||||
|
Task displacement |
−1.30 |
−0.26 |
−0.37 |
−1.34 |
−0.37 |
−0.51 |
|
(0.10) |
(0.08) |
(0.12) |
(0.06) |
(0.11) |
(0.15) |
|
|
R-squared |
0.88 |
0.95 |
0.95 |
0.89 |
0.95 |
0.95 |
|
Observations |
2633 |
2633 |
2633 |
2633 |
2633 |
2633 |
|
Panel C. Variation across commuting zones |
||||||
|
Task displacement |
−1.23 |
−0.94 |
−1.12 |
−1.37 |
−1.23 |
−1.43 |
|
(0.15) |
(0.14) |
(0.22) |
(0.17) |
(0.18) |
(0.29) |
|
|
R-squared |
0.36 |
0.56 |
0.56 |
0.38 |
0.57 |
0.57 |
|
Observations |
20,768 |
20,768 |
20,768 |
20,768 |
20,768 |
20,768 |
|
Panel D. Variation across commuting zones absorbing national trends by group |
||||||
|
Task displacement |
−0.77 |
−0.42 |
−0.41 |
−1.02 |
−0.58 |
−0.65 |
|
(0.07) |
(0.07) |
(0.15) |
(0.07) |
(0.07) |
(0.16) |
|
|
R-squared |
0.71 |
0.78 |
0.79 |
0.72 |
0.78 |
0.80 |
|
Observations |
20,768 |
20,768 |
20,768 |
20,768 |
20,768 |
20,768 |
|
Covariates: |
||||||
|
Industry shifters, manufacturing share, education and gender dummies |
✓ |
✓ |
✓ |
✓ |
||
|
Exposure to labor share declines and relative specialization in routine jobs |
✓ |
✓ |
||||
- Note: This table presents estimates of the relationship between task displacement and the change in real wages across demographic groups × region cells. In Panels A and B, we focus on 300 demographic groups defined by gender, education, age, and race across 9 Census regions. In Panels C and D, we focus on 54 demographic groups defined by gender, education, age, and race across 722 commuting zones. The dependent variable is the change in hourly wages for each cell between 1980 and 2016. In Panels B and D, we provide estimates controlling for group fixed effects, which account for all national trends affecting a specific group. Columns 1–3 report results using our measure of task displacement based on observed labor share declines. Columns 4–6 report results using our measure of task displacement based on automation-driven labor share declines. In addition to the covariates reported in the table and the panel headers, columns 2–3 and 4–5 control for industry shifters, baseline wage shares in manufacturing, regional dummies, and dummies for education (for no high-school degree, completed high school, some college, college degree and post-graduate degree) and gender. Columns 3 and 6 control for relative specialization in routine jobs and groups' exposure to industry labor share decline. All regressions are weighted by total hours worked by each group-region cell in 1980. Standard errors robust to heteroskedasticity and correlation within demographic group (in Panels A and B) or commuting zone (in Panels C and D) are reported in parentheses.
In Panel B, we separate regional and national changes by including a full set of demographic group fixed effects that absorb all national trends affecting a demographic group. We find negative and significant but smaller effects of task displacement (especially in columns 2–3 and 5–6). These estimates imply that task displacement at the regional level matters and has a precisely-estimated negative impact on wages, which is in line with our theory. However, these results also indicate that local differences in task displacement are not as important as national changes for understanding the evolution of the wage structure.29
Panels C and D repeat this exercise for 54 demographic groups defined by a coarser grouping of gender, education, age, and race, but now across 722 U.S. commuting zones (for a total of 20,768 observations). The results are similar to those in Panels A and B.
4.7 Further Robustness Checks
The Supplemental Material provides a number of additional checks, all of which support our conclusions. First, in Table A-VII, we provide estimates of the effects of task displacement excluding immigrants, as well as separate estimates for men and women. Second, in Table A-VIII, we present stacked-differences models with two periods, 1980–2000 and 2000–2016, which explore the differential patterns of task displacement between these subperiods. Panel A estimates the same specifications as in Table I, but now using stacked differences, while Panel B allows covariates to have different coefficients in the two subperiods. The results in both panels are similar to, but smaller in some specifications than, those in Table I. In Panel C, we report period-by-period estimates of the effects of task displacement on wage changes and confirm that our estimates are comparable across the 1980–2000 and 2000–2016 periods.30 Finally, in Table A-IX, we present comparable results when we use labor share data from the BLS, exclude extractive industries, winsorize the labor share changes, or focus only on industries with a declining labor share to construct our measure of task displacement.
5 General Equilibrium Effects and Quantitative Analysis
Our reduced-form evidence documented a strong negative relationship between (direct) task displacement and relative wage changes across worker groups. This evidence misses three general equilibrium effects. First, in our regressions, the common impact of productivity on real wages is in the intercept, making our estimates uninformative about wage level changes. Second, although our regressions control for observed changes in industry composition, they do not separate industry shifts induced by automation, missing one component of the total impact of automation. Third and most importantly, our regression estimates focus on the direct effects of automation via task displacement and do not account for the resulting ripple effects, which also impact the wage structure. In this section, we develop a methodology to quantify the effects of technological changes that accounts for these mechanisms, and for brevity, focus on automation technologies.
5.1 General Equilibrium Effects and the Propagation Matrix

 . Because worker groups now compete for tasks, task shares in each industry are a function of both wages and technology, and also depend on industry shifters,
  .
. on the real wage of group g. For example, in the case of automation technologies,
  corresponds to the direct task displacement of group g. Denote by z the column vector of
  's and differentiate (2) to obtain

 is the
  Jacobian of the function
  with respect to the vector of wages w. This Jacobian summarizes the impact of a change in wages on task allocation (which was equal to zero under Assumption 1). We refer to the
  matrix Θ as the propagation matrix. Although this matrix is much lower-dimensional than the full set of task-specific productivity functions (the
  's), it fully accounts for ripple effects and the general equilibrium implications of technological changes.
In Appendix A-2, we prove that Θ is well defined and has several properties. First,  captures the extent of competition for tasks between groups
  and g. Second, we show that the row sum of Θ, which we denote by
  , is always between 0 and 1. Third, Θ satisfies the following symmetry property:
  for any two groups g and
  (where
  is the labor share of group g in aggregate output). Finally, the entries of Θ also specify whether different workers are q-complements or q-substitutes: an increase in the supply of workers of type
  reduces the real wage of type g if and only if
  (Appendix B-1 relates these entries to common measures of elasticities of substitution). In what follows, we denote the gth row of the propagation matrix by
  .
.
The next proposition characterizes the general equilibrium effects of automation on wages, industry prices, TFP, and aggregate output (GDP).
Proposition 4. (GE Effects)The effects of automation on wages, industry prices, and aggregates are given by the solution to the system of equations:

 ,
,  , and
, and  .
.
As before, real wage changes depend on the productivity effect (dlny), the induced shifts in industry composition ( ), and the (direct) task displacement experienced by all groups (
 ). In the presence of ripple effects, these direct impacts are pre-multiplied by the gth row of the propagation matrix
  . Intuitively, because of ripple effects, wage changes for a group depend on whether other groups that compete for the same tasks are being displaced from their tasks. The gth row of the propagation matrix,
  , has all the necessary information for computing the effects on group g from the task displacement experienced by other groups.31
The proposition also shows that we can compute the full general equilibrium impact of automation on wages, industry shares and prices, TFP, GDP, and the capital share by solving the above system of equations. The solution to this system will be a function of the same objects we emphasized in Section 2: direct task displacement experienced by different groups (the  's) and cost savings from automation (the
  's). In addition, we now need two more ingredients. First, it is necessary to specify the full demand system across industries to determine how technological changes impact industry composition, which will in turn affect the wage structure. Second, we have to parameterize and estimate the propagation matrix to account for the endogenous reallocation of tasks in response to automation and the resulting ripple effects. The formulas in this proposition clarify that the direct task displacement generated by automation is the (exogenous) impulse that leads to a change in task shares, while ripple effects encoded in the propagation matrix and changes in industry composition determine the full general equilibrium implications of this task displacement.32
5.2 Parameterization, Calibration, and Estimation
Measuring Task Displacement and Cost Savings From Automation
 . In this case, automation-driven task displacement experienced by group g in industry i can be measured as
 (16)
(16) (17)
(17) denotes the percent change in the labor share driven by automation in industry i. The term
  in the denominator adjusts for the substitution toward automated tasks following a cost reduction of
  .
.We continue to present results using both measures of task displacement, but for brevity, will focus on our preferred strategy that relies on the component of labor share declines driven by automation. Appendix A-3 shows that when  and there are ripple effects, this component can be estimated from an industry-level regression of the adjusted decline in the labor share,
  , on our measures of industry automation. Here,
  is the elasticity of substitution between capital and labor in industry i, and
  and
and  are observed factor price changes facing industry i. The term
  corrects for the endogenous changes in labor share due to factor prices and isolates the direct impact of automation on the labor share (see also Grossman and Oberfield (2021)). In the text, we also set
  ,
,  , and
, and  , and explore robustness to variations in each one of these parameters in Table A-XI).33
Industry Demand
We use a simple CES demand system across industries as in footnote 11:  . Following Buera, Kaboski, and Rogerson (2015), we set the elasticity of substitution between industries to
  .
.
Propagation Matrix
 as a function of their distance (dissimilarity) across
  dimensions. In particular, we assume that

 and g, denoted here by
  . The assumption of common diagonal term is consistent with our reduced-form analysis, which did not find evidence of significant heterogeneities in the effects of task displacement across groups. The parameter
  gives the importance of dimension n in mediating ripple effects. We choose the following dimensions along which we measure distance between groups: occupational and industry employment shares (which account for overlaps in the types of tasks performed) and education by age (which allows for the possibility that, among workers with or without college, workers of similar ages might be more substitutable than those of different ages; see Card and Lemieux, 2001).
 is derived from the unobserved wage effects for group g, denoted by
  in (15). Specifically, using vector notation,
  . To estimate the parameters of this system, we impose the exclusion restriction that each group's (automation-driven) task displacement, Task displacement
 , is orthogonal to u, or equivalently to υ, which leads to the moment conditions;34

Table A-X in the Supplemental Material provides GMM estimates for θ and  based on these moment conditions. Columns 1–3 use the task displacement measure based on the observed industry labor share declines, while columns 4–6 use our task displacement measure based on the automation-driven labor share declines. We find positive and significant estimates for ripple effects by occupation, industry, and within age ×education cells. These estimates imply that demographic groups that are directly displaced by automation then compete for tasks performed by other groups that have similar age and education and that specialize in similar occupations and industries.
5.3 General Equilibrium Estimates
This subsection presents general equilibrium estimates of the consequences of automation. We use Proposition 4 to compute the full general equilibrium effects of (direct) task displacement, which we measure using equations (16) and (17).
Table VIII summarizes our findings. The first column depicts the data, while the second column presents our general equilibrium estimates when direct task displacement is given by our measure based on observed labor share declines. The third column provides our preferred estimates, feeding in direct task displacement numbers based on the automation-driven component of industry labor share declines. In what follows, we focus on the results in this last column.
|
Data for 1980–2016 |
Using Task Displacement Based on Labor Share Declines |
Using Task Displacement Based on Automation-Driven Labor Share Declines |
|
|---|---|---|---|
|
(1) |
(2) |
(3) |
|
|
Wage structure: |
|||
|
Share wage changes explained: |
|||
|
—due to changes in industry composition |
6.78% |
6.33% |
|
|
—adding direct displacement effects |
100.54% |
93.34% |
|
|
—accounting for ripple effects |
48.35% |
46.88% |
|
|
Rise in college premium |
25.51% |
21.82% |
21.02% |
|
—part due to direct displacement effect |
40.92% |
37.71% |
|
|
Rise in post-graduate premium |
40.42% |
24.06% |
22.42% |
|
—part due to direct displacement effect |
48.04% |
43.57% |
|
|
Change in gender gap |
15.37% |
1.83% |
1.90% |
|
—part due to direct displacement effect |
6.31% |
5.94% |
|
|
Share with declining wages |
53.10% |
41.71% |
42.26% |
|
—part due to direct displacement effects |
49.61% |
51.52% |
|
|
Wages for men with no high school |
−8.21% |
−7.18% |
−8.41% |
|
—part due to direct displacement effects |
−13.97% |
−15.11% |
|
|
Wages for women with no high school |
10.94% |
1.24% |
−3.40% |
|
—part due to direct displacement effects |
6.21% |
−2.82% |
|
|
Aggregates: |
|||
|
Change in average wages, dlnw |
29.15% |
5.71% |
5.18% |
|
Change in GDP per capita, dlny |
70.00% |
23.42% |
20.95% |
|
Change in TFP, dlntfp |
35% |
3.77% |
3.42% |
|
Change in labor share, dsL |
−8 p.p |
−11.69 p.p |
−10.41 p.p |
|
Change in K/Y ratio |
30.00% |
41.93% |
38.10% |
|
Sectoral patterns: |
|||
|
Share manufacturing in GDP |
−8.80 p.p |
−0.41 p.p |
−0.52 p.p |
|
Change in manufacturing wage bill |
−35.00% |
−8.23% |
−12.85% |
|
(per capita) |
- Note: This table summarizes the effects of task displacement on the wage distribution, real wage levels, aggregates, and industry outcomes. These are computed using the formulas in Proposition 4 and the parameterization and estimates for the industry demand system and the propagation matrix in Section 5.2. Column 2 computes the model predictions based on our measure of task displacement from industry labor share declines, while column 3 computes the model predictions based on our measure of task displacement from automation-driven labor share declines. The wage data reported in column 1 are from the 1980 U.S. Census and 2014–2018 ACS. The data for GDP, the labor share, the capital-output ratio data, and the industry patterns for manufacturing are from the BEA and the BLS. The TFP data are from Fernald (2014).
The first panel of the table summarizes the effects of automation on the wage structure. This information is also displayed in Figure 7, which decomposes the contribution of the different mechanisms via which task displacement affects wages (with demographic groups sorted by their baseline wage in 1980 on the horizontal axis). Panel A of the figure plots the common productivity effect,  , which raises the wages for all groups by close to 45%.

Contribution of productivity effects, industry shifts, direct displacement effects, and ripple effects to the predicted change in hourly wages, 1980–2016. Marker sizes indicate the share of hours worked by each group and shades of gray (different colors) indicate education levels. See text for variable definitions.
Panel B adds changes in industry composition induced by automation,  . Because
  , automation induces a shift toward sectors, such as services, that have less automation and increases the demand for workers specialized in these sectors. However, this effect is modest, accounting for less than 7% of the observed changes in the U.S. wage structure.
Panel C adds the direct task displacement effects, given by  . Direct task displacement generates sizable dispersion in wage changes and causes as much as a 25% decline in the real wages of some groups. The comparison between Panels B and C shows that the main impact of automation on the wage structure is via direct task displacement. This reiterates that automation is distinct from trade in final goods and from other technologies that do not generate task displacement and impact labor demand mainly by changing industry composition.
The results in Panel C show that direct task displacement accounts for as much as 94% of the overall changes in the U.S. wage structure between 1980 and 2016 (see the second row of Table VIII). The reason why this is larger than the 50–70% estimate we obtained in Section 4 is instructive. Our reduced-form analysis did not allow for ripple effects, which were thus partially captured by our task displacement measures. Our general equilibrium framework clarifies that ripple effects enable directly-displaced demographic groups to compete for non-automated tasks performed by other groups and hence spread the impacts of task displacement across groups. This is confirmed in Panel D of Table VIII, which depicts the full effects of automation on wages after accounting for ripple effects using our estimates of the propagation matrix. For example, the direct impact of automation on high-school graduate white men aged 26–35 in Panel C of Figure 7 is −13.3%. But once we allow for ripple effects in Panel D of Figure 7, this demographic group experiences a smaller, 5.5%, decline in real wages. In contrast, the direct impact on Hispanic high-school dropout women aged 36–45 is a 2.6% real wage increase, but incorporating ripple effects, this group suffers a 3.3% real wage decline.
As a summary, Figure 8 plots the predicted wage changes in the model and the observed real wage changes between 1980 and 2016. In addition to accounting for a large fraction of the variation in U.S. wage structure, automation explains several other salient aspects of the labor market during this period. First, even though there is a large (close to 45%) productivity effect, real wages for 131 demographic groups (making up 42% of the 1980 population) decline because of automation (in the data, 121 groups, making up 53% of the 1980 population, experienced real wage declines). This result highlights how automation can generate meaningful real wage declines, which contrasts with the canonical SBTC model, where technological progress is predicted to increase the real wages of all groups. Second, in general equilibrium, task displacement generates a 21% increase in the college premium (80% of the observed increase) and a 22% increase in the post-graduate premium (55% of the observed increase). Finally, task displacement alone closes the gender gap by about 2%. Interestingly, in all these cases, the direct effects of task displacement are dampened once we account for ripple effects. For example, the direct effect of automation is to reduce the gender gap by 6%, but because displaced men compete for tasks previously performed by women, in general equilibrium the gender premium declines only by 2%.

Observed wage changes (vertical axis) versus predicted wage changes in general equilibrium due to automation (horizontal axis). the 45○ line is shown in black. Marker sizes indicate the share of hours worked by each group and shades of gray (different colors) indicate education levels. See text for variable definitions.
Despite matching several salient aspects of the changes in the U.S. wage structure, our model misses a significant portion of wage growth for highly-educated workers at the top of the wage distribution. This may reflect the complementarity between some of the new technologies and post-graduate workers or other forces, such as winner-take-all dynamics in some high-skill professions, which are both absent from our model.
The second panel of Table VIII turns to the model's implications for aggregates. Despite the large distributional effects documented above, task displacement generates only a cumulative 3.4% TFP gain over 1980–2016, and this is the reason why average real wages are predicted to grow slowly (only by 5.2%) and many groups experience real wage declines. This small TFP increase is intuitive in light of the characterization in Proposition 4: TFP gains from automation can be approximated as the product of the share in GDP of displaced tasks ( ), which is approximately 10%, and average cost reductions of 30%, thus yielding a
  increase in TFP. In contrast to this small automation-induced increase in productivity, in the data TFP grew by 35% during this period, and average real wages rose by 29% (though two thirds of the latter is due to educational upgrading of the workforce, which is not present in our model). These numbers confirm that there were other technological advances—such as factor-augmenting and productivity-deepening technologies, industry TFP, or even new tasks—contributing to GDP, wage growth, and productivity between 1980 and 2016. However, the congruence between the model-implied changes in wage structure and the data suggests that these other technological changes had small effects on inequality, except possibly at the top of the wage distribution. Finally, task displacement due to automation accounts for the observed decline in the labor share (by construction) and the observed increase in the capital-GDP ratio over this period. This last finding implies that the amount of investment accompanying automation in our model is in the ballpark of the data.
The third panel of Table VIII summarizes the industry implications of task displacement. In line with the modest TFP gains estimated above, we see that task displacement generates small changes in industry composition and accounts for only 0.5 of the 8.8 percentage point decline in the share of manufacturing in GDP. Despite its small impact on industry composition, task displacement within manufacturing generates a large, 13%, reduction in the wage bill of that sector, accounting for a third of the decline in manufacturing labor demand for 1980–2016.
6 Concluding Remarks
This paper argued that a significant portion of the rise in U.S. wage inequality over the last four decades has been driven by automation (and to a lesser extent offshoring), which displaces certain worker groups from employment opportunities for which they had comparative advantage. To develop this point, we proposed a conceptual framework where tasks are allocated to different types of labor and capital, and automation technologies expand the set of tasks performed by capital at the expense of workers previously employed in these tasks. We derived a simple equation linking wage changes of a demographic group to the task displacement it experiences.
Our reduced-form evidence is based on estimating this equation and reveals a number of striking new facts. Most notably, we documented that 50–70% of the changes in the U.S. wage structure between 1980 and 2016 are accounted for by the relative wage declines of worker groups specialized in routine tasks in industries experiencing rapid automation. We also verified that our task displacement variable captures the effects of automation technologies (and to a lesser degree offshoring) rather than changes in overall capital intensity, other types of technologies, markups, industry concentration, unionization, or Chinese import competition. These alternative economic trends do not appear to play a major role in the evolution of the U.S. wage structure between 1980 and 2016 and have negligible effects on our estimates.
Our reduced-form regressions focus on the direct effects of task displacement on wages, but miss important general equilibrium forces. We developed a methodology to quantify the general equilibrium implications of task displacement, which can account for the implications of automation working through productivity gains, ripple effects and changes in industry composition. Our full quantitative evaluation shows that task displacement explains close to 50% of the observed changes in the U.S. wage structure. Most notably, task displacement leads to sizable increases in wage inequality, but only small productivity gains—thus providing a possible resolution to a puzzling feature of the U.S. data.
There are several interesting areas for future research. First, our framework has been static, and any effects from capital accumulation, dynamic incentives for the development of new technologies, and education and skill acquisition are absent. Incorporating these effects is an important direction for future research.
Second, we did not attempt to model and estimate the effects of technologies introducing new labor-intensive tasks (which we argued to have been important in previous work, Acemoglu and Restrepo (2018)). This is another avenue for future research.
Third, our strategy exploited industry-level trends in automation and labor share. Several recent works have pointed out that labor share declines concentrate on a subset of, often largest, firms (e.g., Autor et al. (2020), Kehrig and Vincent (2020)). Acemoglu, Lelarge, and Restrepo (2020) showed that in French manufacturing, these are the firms that adopt automation technologies and expand at the expense of their competitors, where the actual declines in labor demand take place. This pattern confirms that it is (automation-driven) reductions in the labor share at the industry level, rather than at the firm level, that are relevant for task displacement, but also suggests that modeling the competition between automating and non-automating firms is yet another interesting area for future research (see, e.g., Hubmer and Restrepo (2021)).
Finally, our empirical work has been confined to the United States and the 1980–2016 period, for which we have all the data components necessary for our reduced-form and quantitative analyses. Expanding these data sources and the empirical exploration of the role of task displacement to earlier periods and other economies is an important direction for research that may help us understand the technological and institutional reasons why the U.S. wage structure was quite stable for the three decades leading up to the mid-1970s.
 and simultaneously reduces
  . This more general version would capture some displacement effects, though without microfoundations it is not clear why technological progress would make some workers less productive. Our theory can be viewed as providing microfoundations for this type of general SBTC model.
 and for any g and
  (with the convention that
  stands for k),
  is not constant for all
  .
.
 , where the expression is evaluated at the new level of capital productivity and initial equilibrium wages.
 on group g wages is
  , where
  is the elasticity of substitution between group g and other workers. Because an increase in
  expands the set of tasks performed by group g,
  . Under Assumption 1, however, there are no ripple effects, and thus
  .
.
 . This formulation imposes homotheticity, which can be relaxed by allowing expenditure shares to additionally depend on the level of consumption.
 as
as  and compute the share of the variance in y explained by
  as
as  . These shares add up to the
  of the regression, which is also reported in the table.

 , where our proxy is the adjusted penetration of robots, changes in the value of dedicated machinery services in value added, or changes in the value of specialized software services in value added, or combinations thereof. When we include exposure to industry labor share declines as a covariate in Panel B, we use variables of the form
  as instruments.
 and there are ripple effects, our baseline task displacement measure in equation (14) becomes

 , accounts for the influence of factor prices. In this expression,
  is the elasticity of substitution between capital and labor in industry i, and
  and
and  are the observed change in factor prices faced by the industry. Table A-IV provides results using both this adjusted measure and its analogue focusing on automation-driven labor share declines.
 , our baseline task displacement measure in equation (14) becomes

 . This is consistent with our choice of the elasticity of substitution between capital and labor,
  , here, because under Assumption 1,
  . Thus, in both cases, we are setting the elasticity of substitution between capital and labor to unity. In the Supplemental Material, we explore the robustness of our results to
  and
and  , which is consistent with the range of elasticity of substitution estimates in (Karabarbounis and Neiman (2013), Oberfield and Raval (2020)). The estimate
  comes from Humlum (2020), and in the Supplemental Material, we show robustness to
  and
and  . Finally, 30% cost savings from automation are in line with the estimates for industrial robots surveyed in Acemoglu and Restrepo (2020). Although cost savings may differ across technologies and industries, we do not have data to estimate such differences. We additionally report estimates from our model with endogenous labor supply in Appendix B-1.
 and
and  , where the sum runs over 330 occupations and 192 industries in the U.S. Census, respectively. In addition, the sigmoid function takes the form

 is a tuning parameter governing the decay of the function. For
  , we get
  . More generally, the sigmoid function has a maximum of 1 when there is no dissimilarity between two groups. In our baseline estimates in Table A-X, we use a quadratic tuning parameter,
  . In the Supplemental Material, we provide analogous estimates for different values of the tuning parameter; see Tables A-10 and A-XI.